Reports 1-1 of 1 Clear search Modify search
Environmental Monitoring (Environmental Monitoring)
tringali, fiori, spinicelli, paoletti, zaza, IFAE team - 15:51 Saturday 13 June 2026 (69222) Print this report
Instrumented baffle modes measurement

Preliminary measurements

On June 10 and 11 we installed the setup and performed preliminary measurements in order to check the instrumentation and optimize the measurering setup.

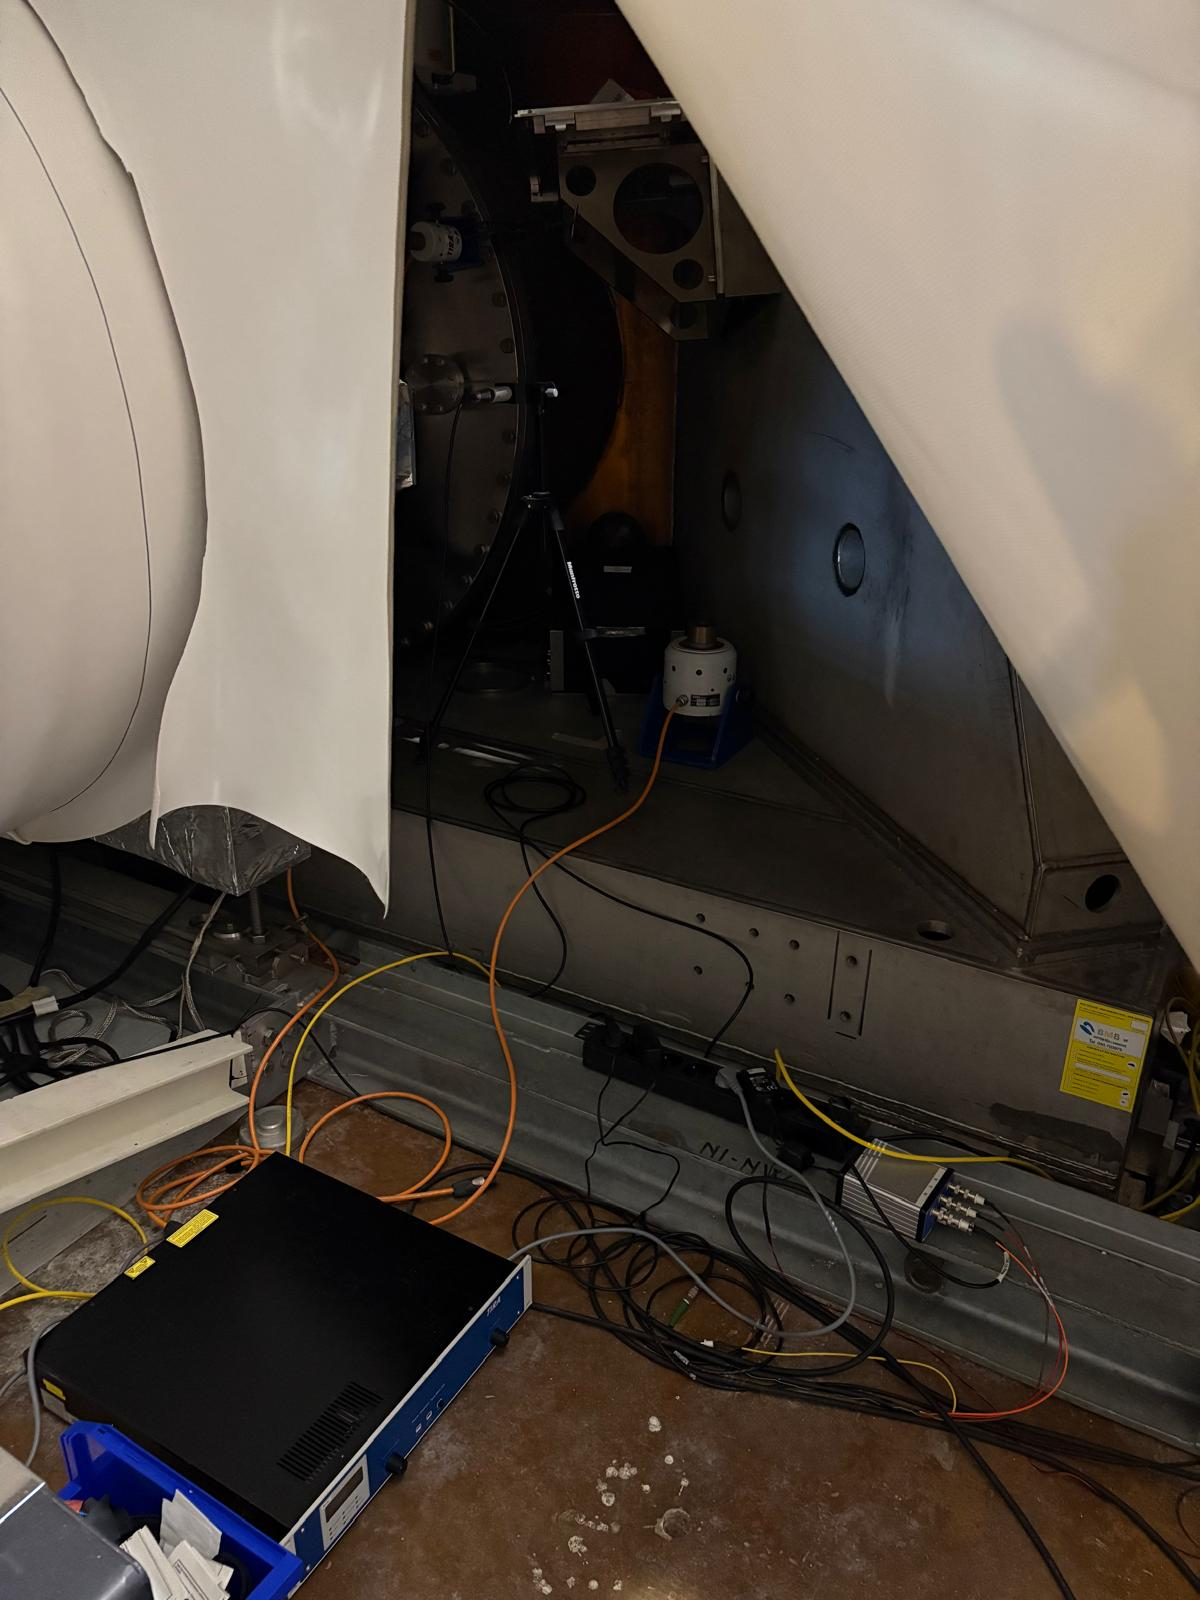
We installed two shakers on the exterior of the NI chamber: the large shaker is placed om the NI tower base, NW corner, and the small shaker clamped to the North big flange (thank you Antonio for helping in this installation). The shakers (in turn, manually) are connected to the amplifier which is driven from a DAC ch in the TCS room.
After a careful cleaning of all the tools, we moved inside the NI.

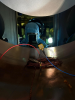
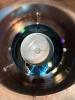
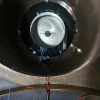
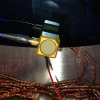
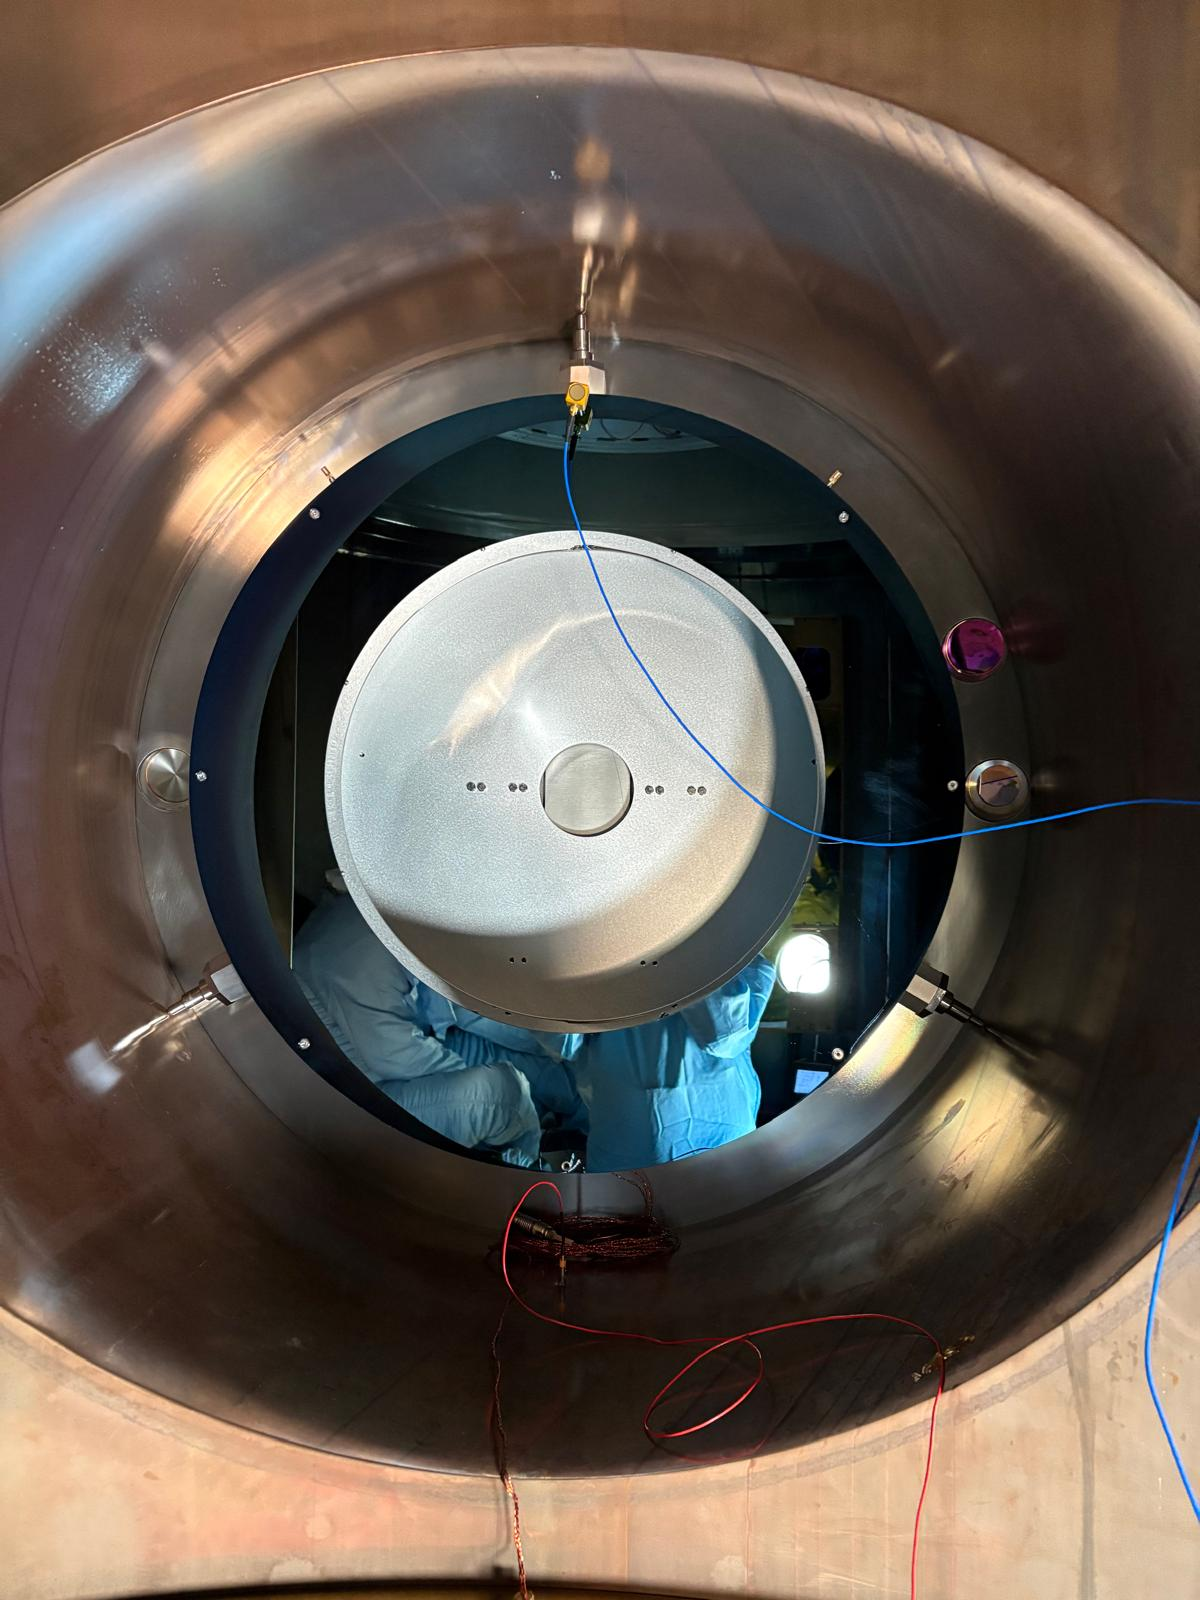
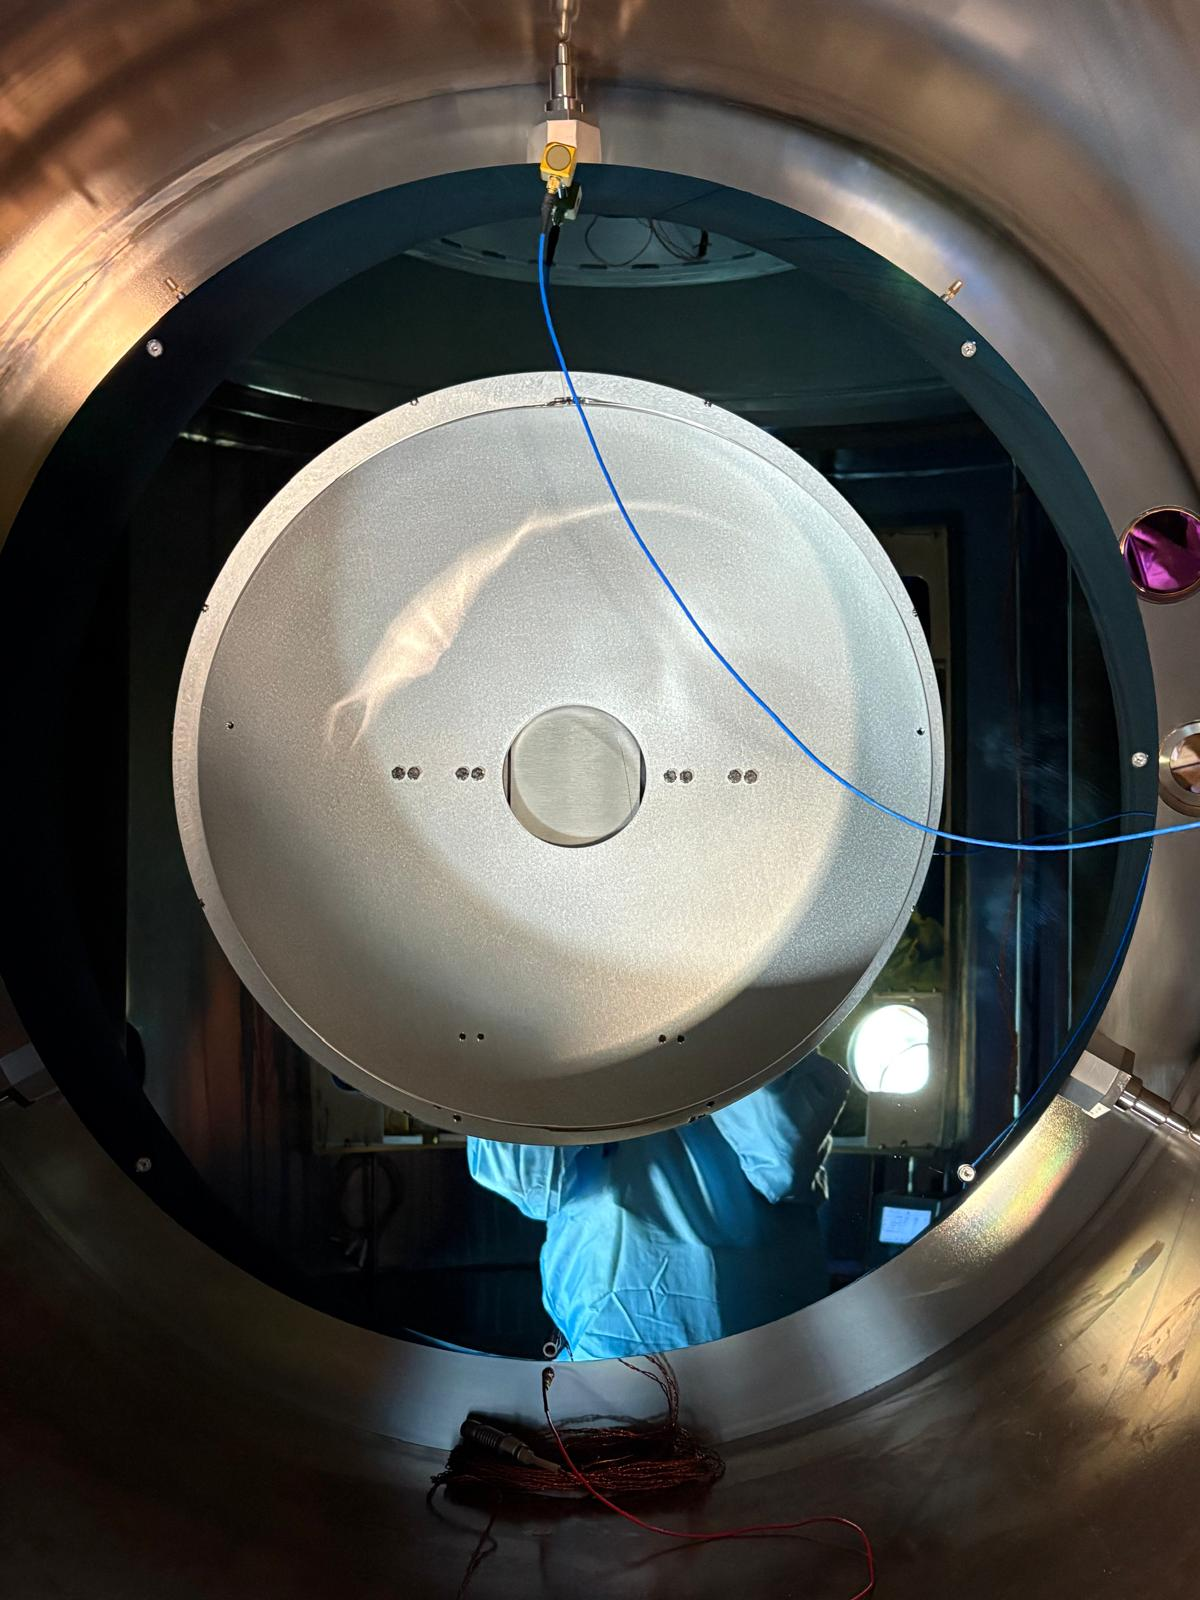
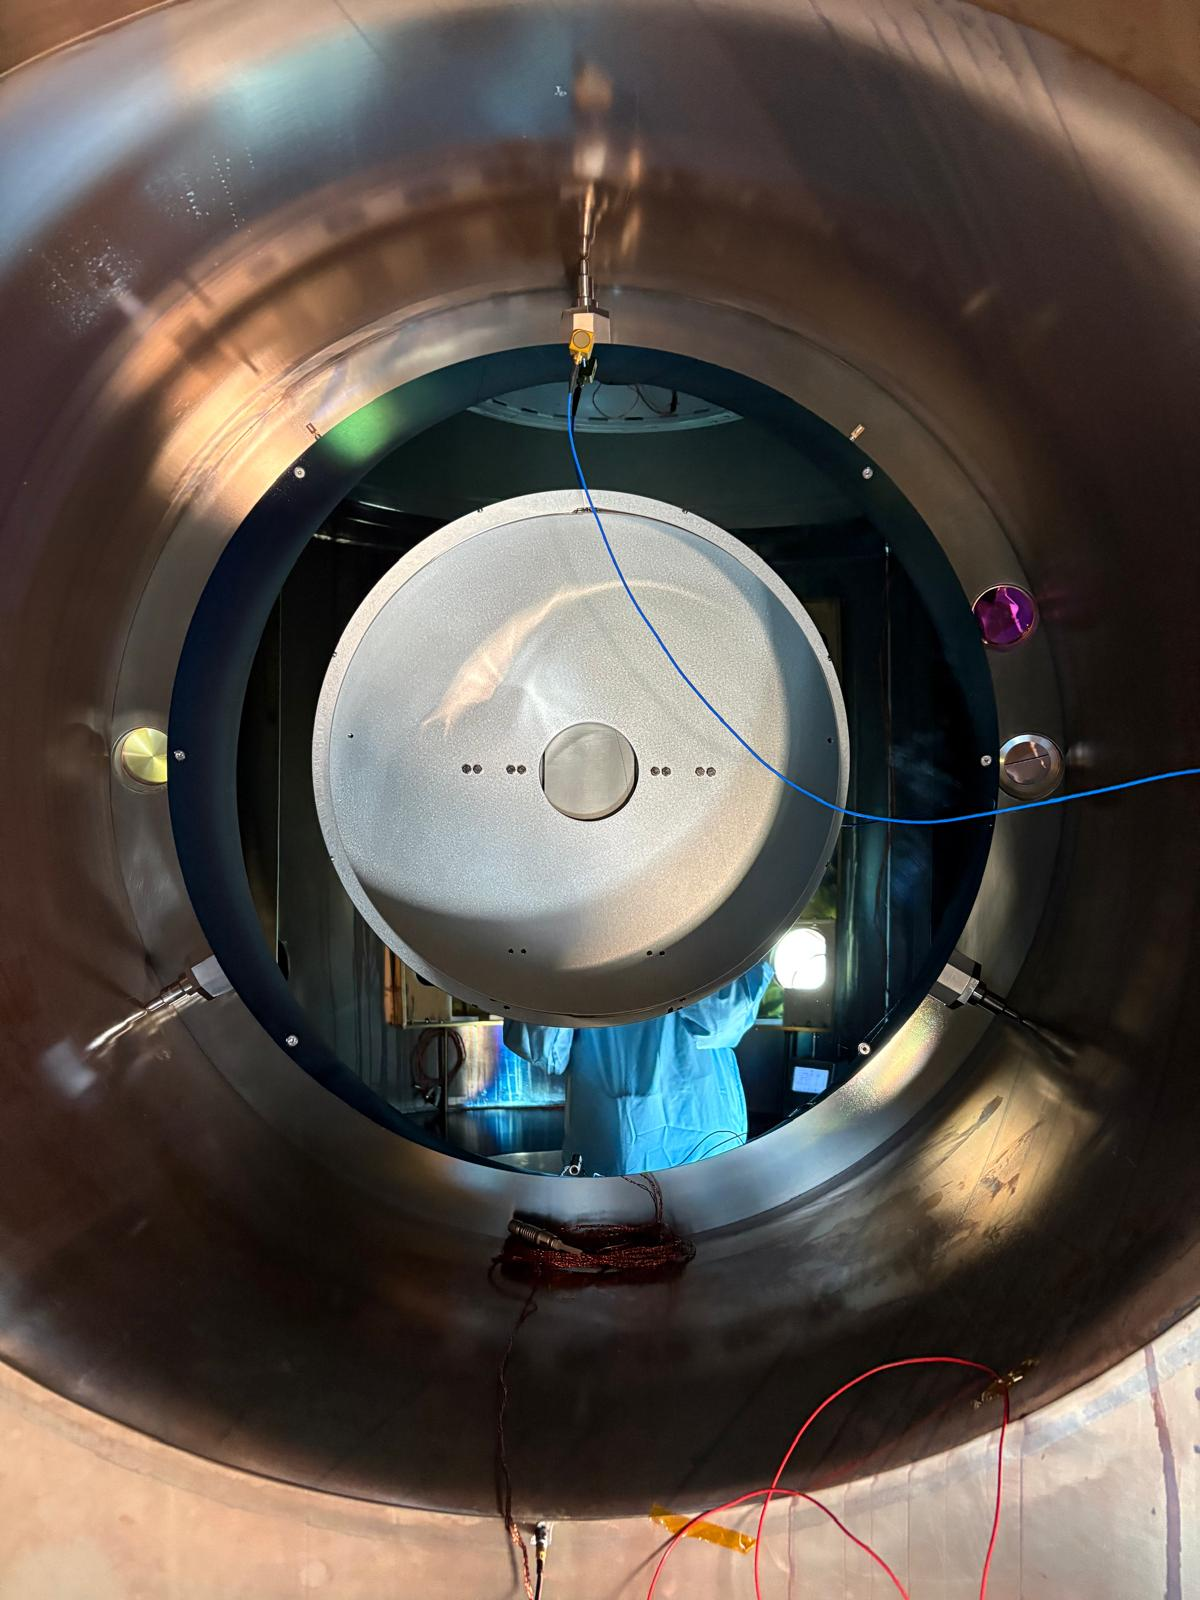
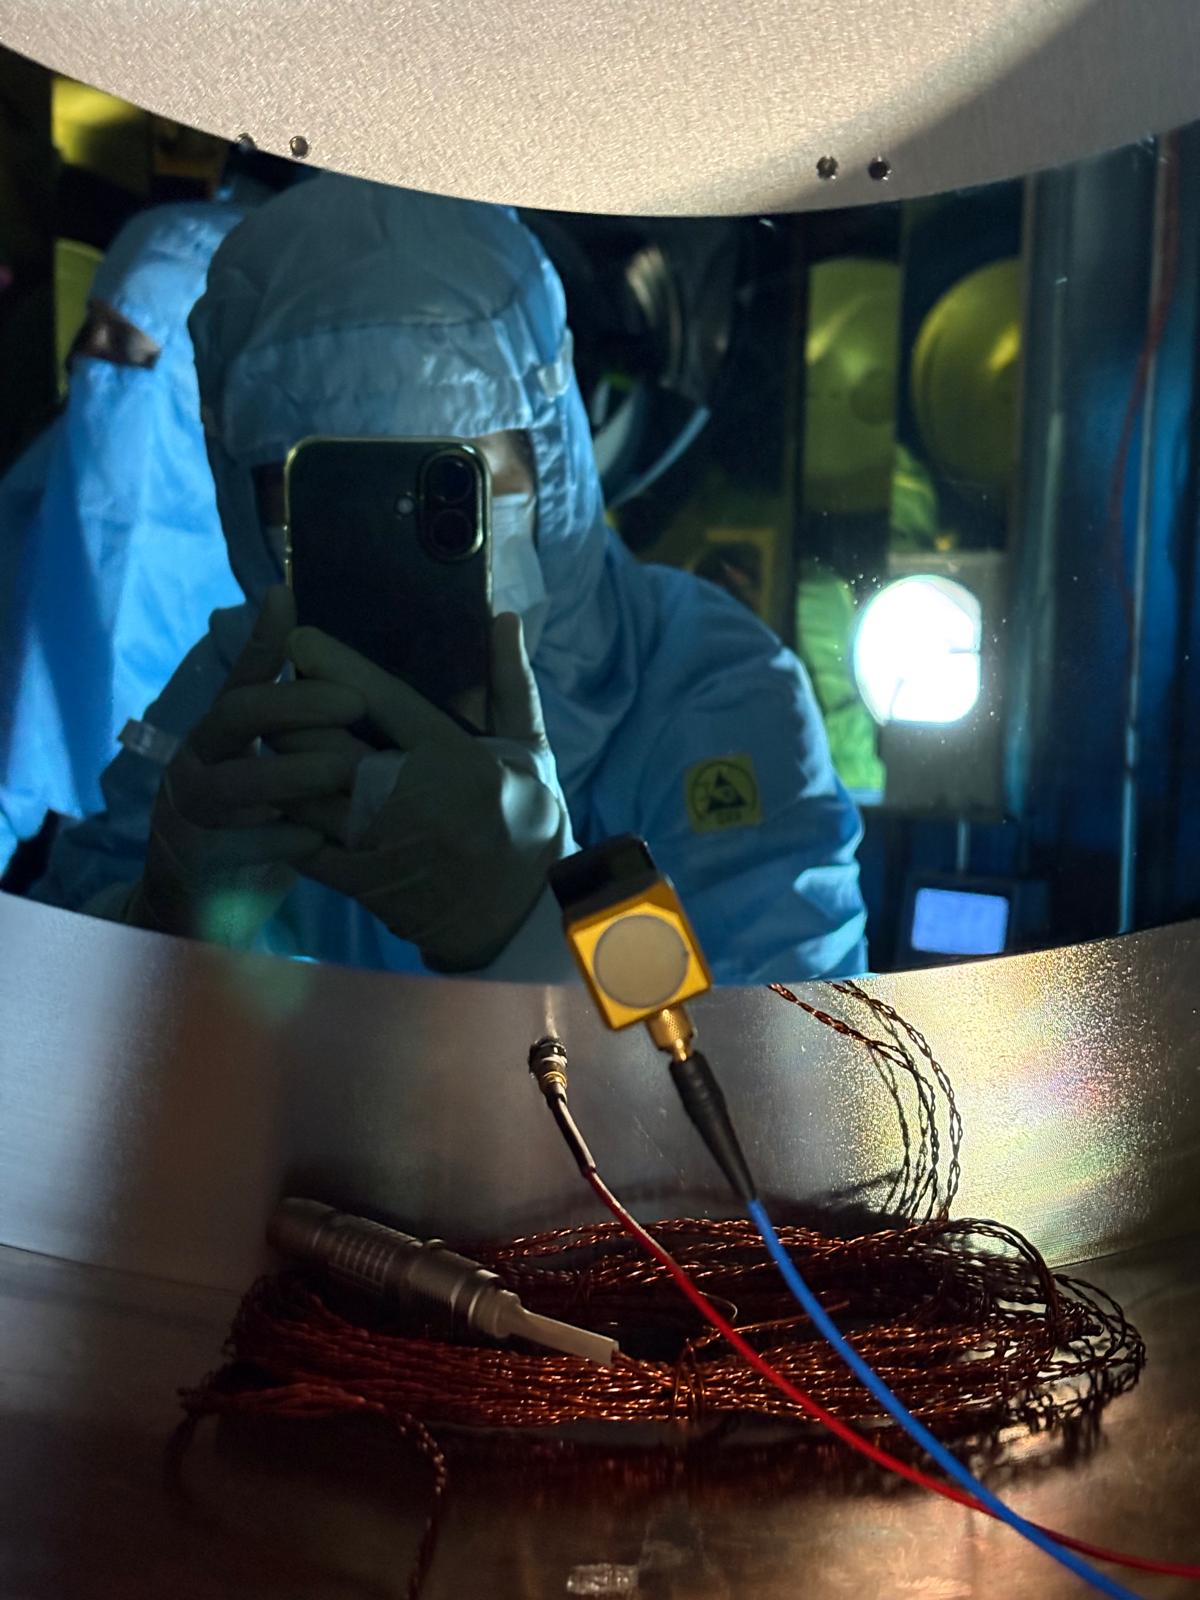
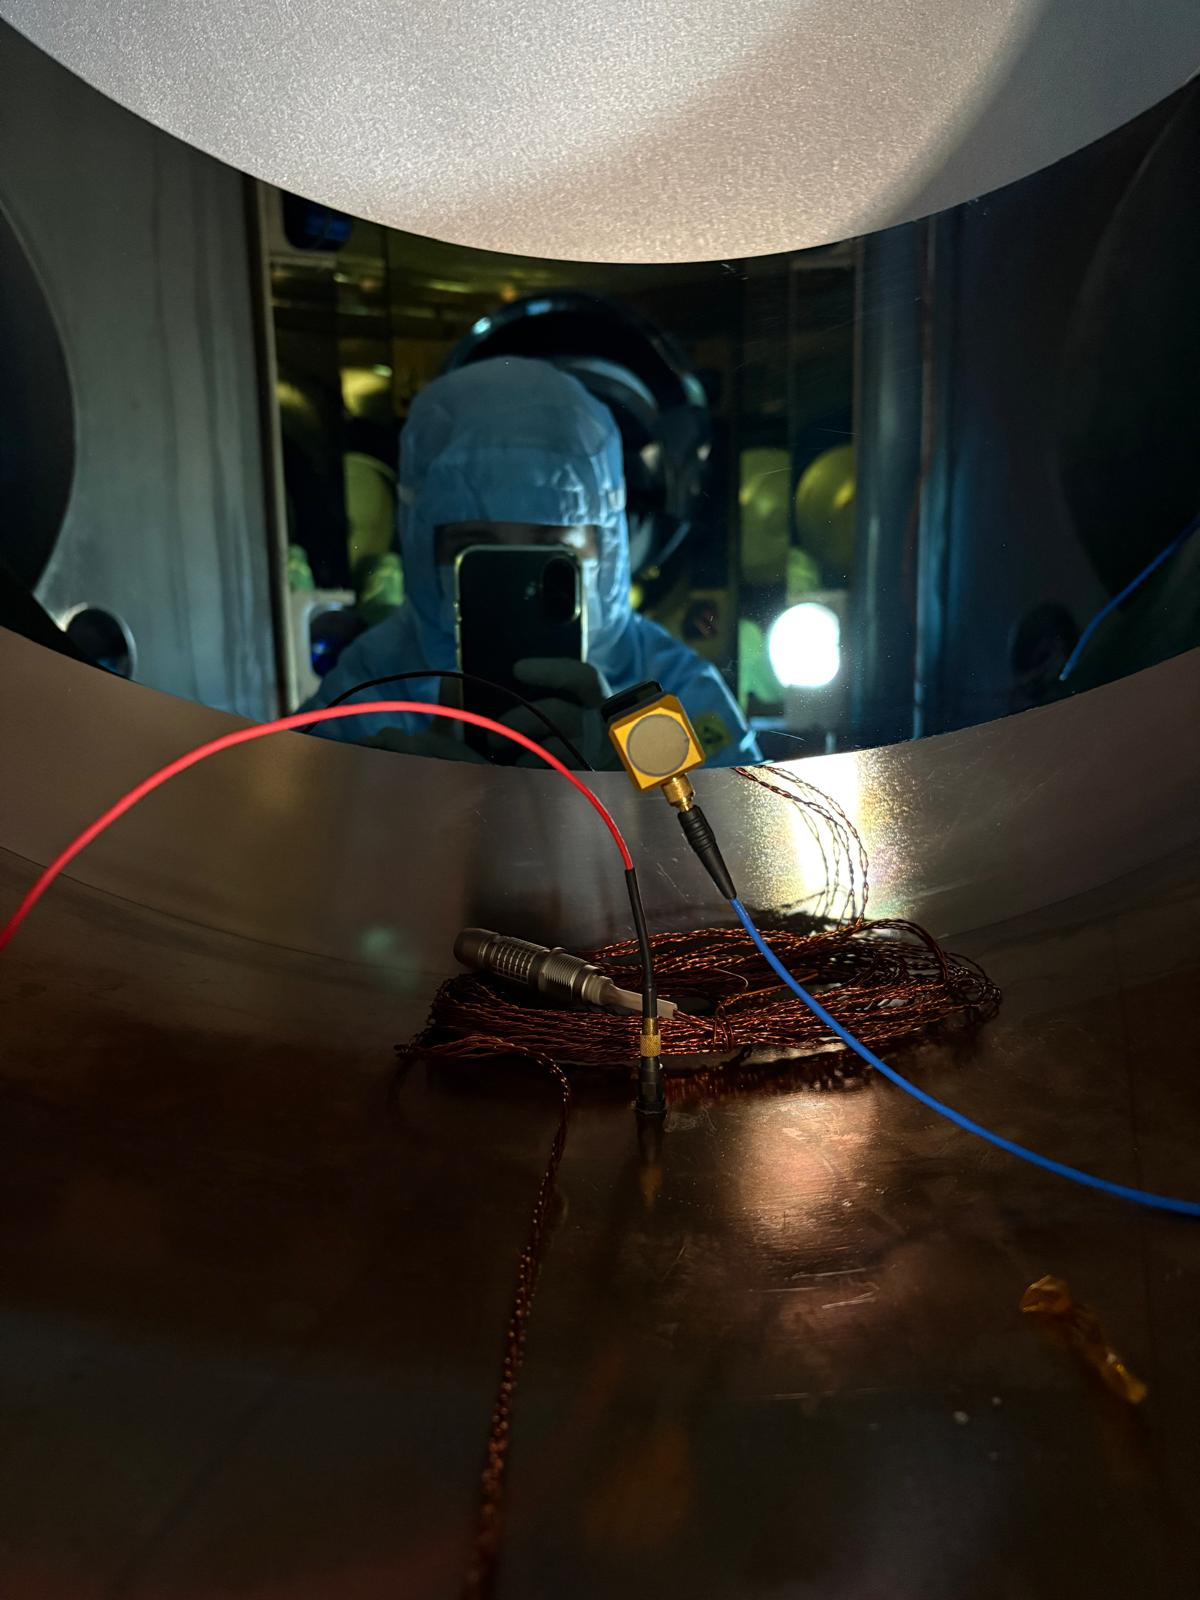
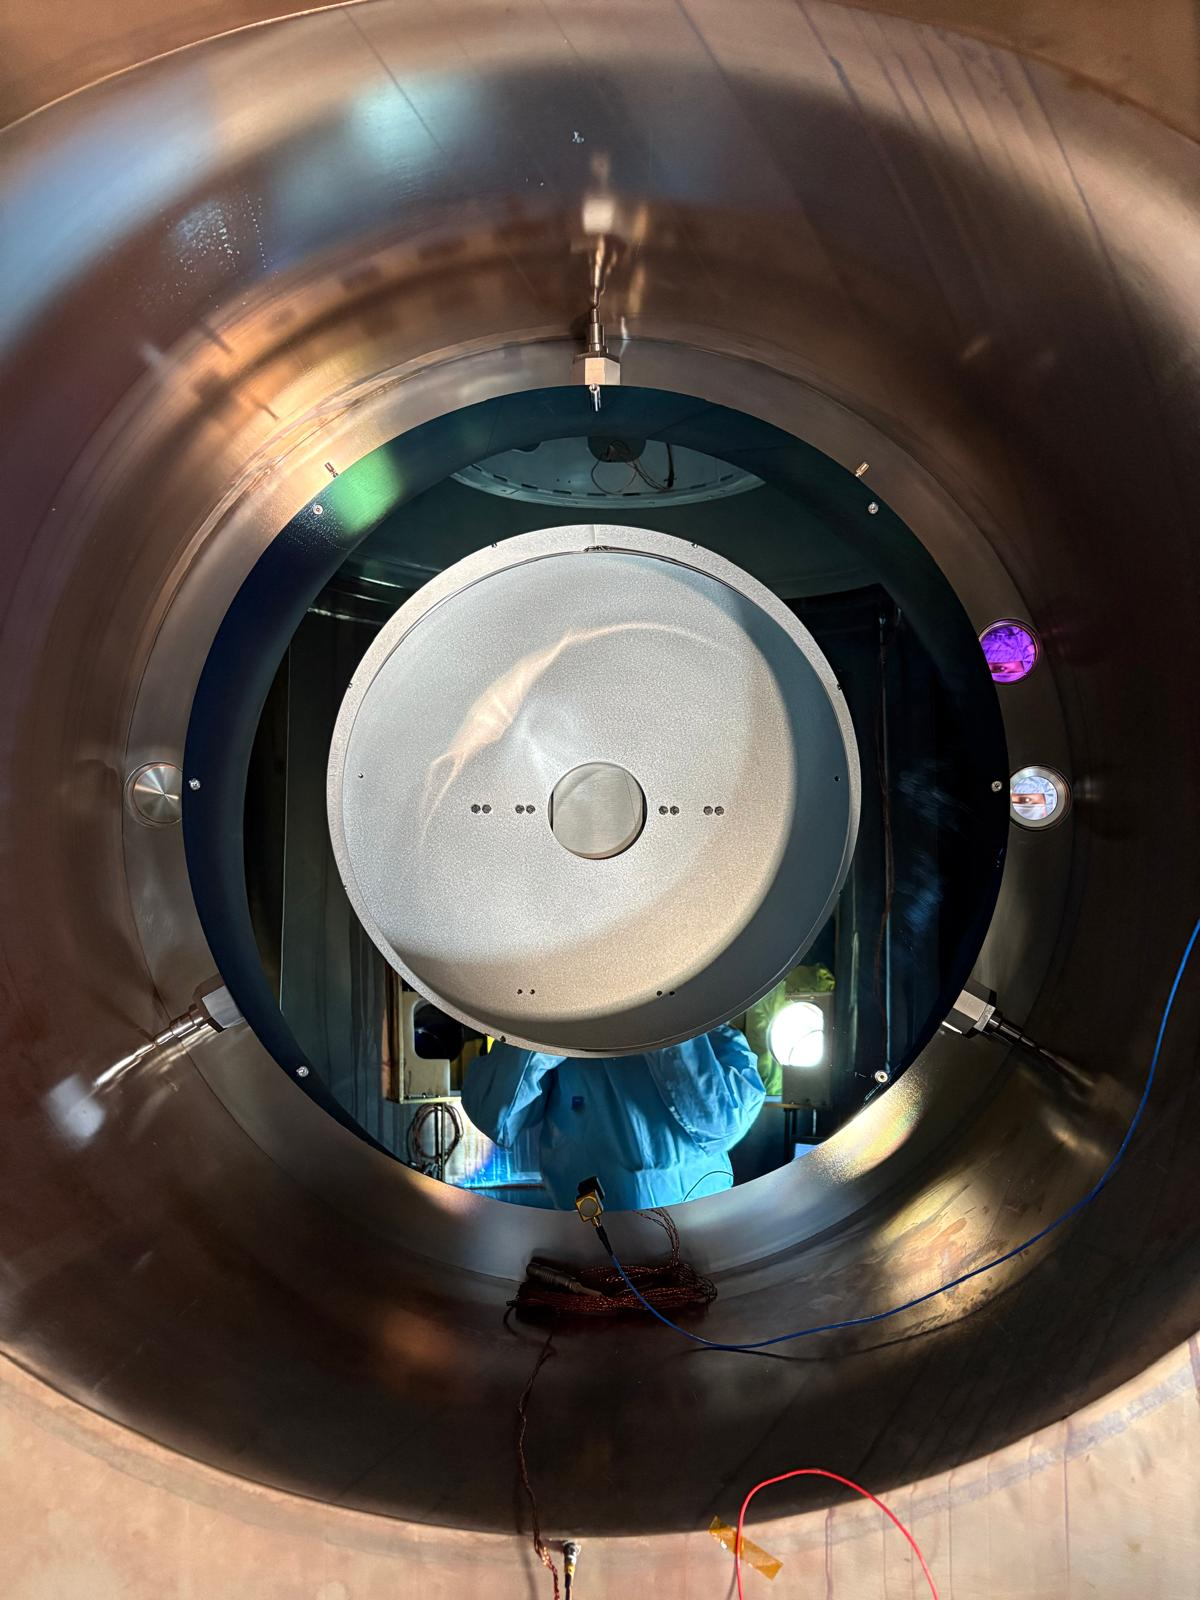
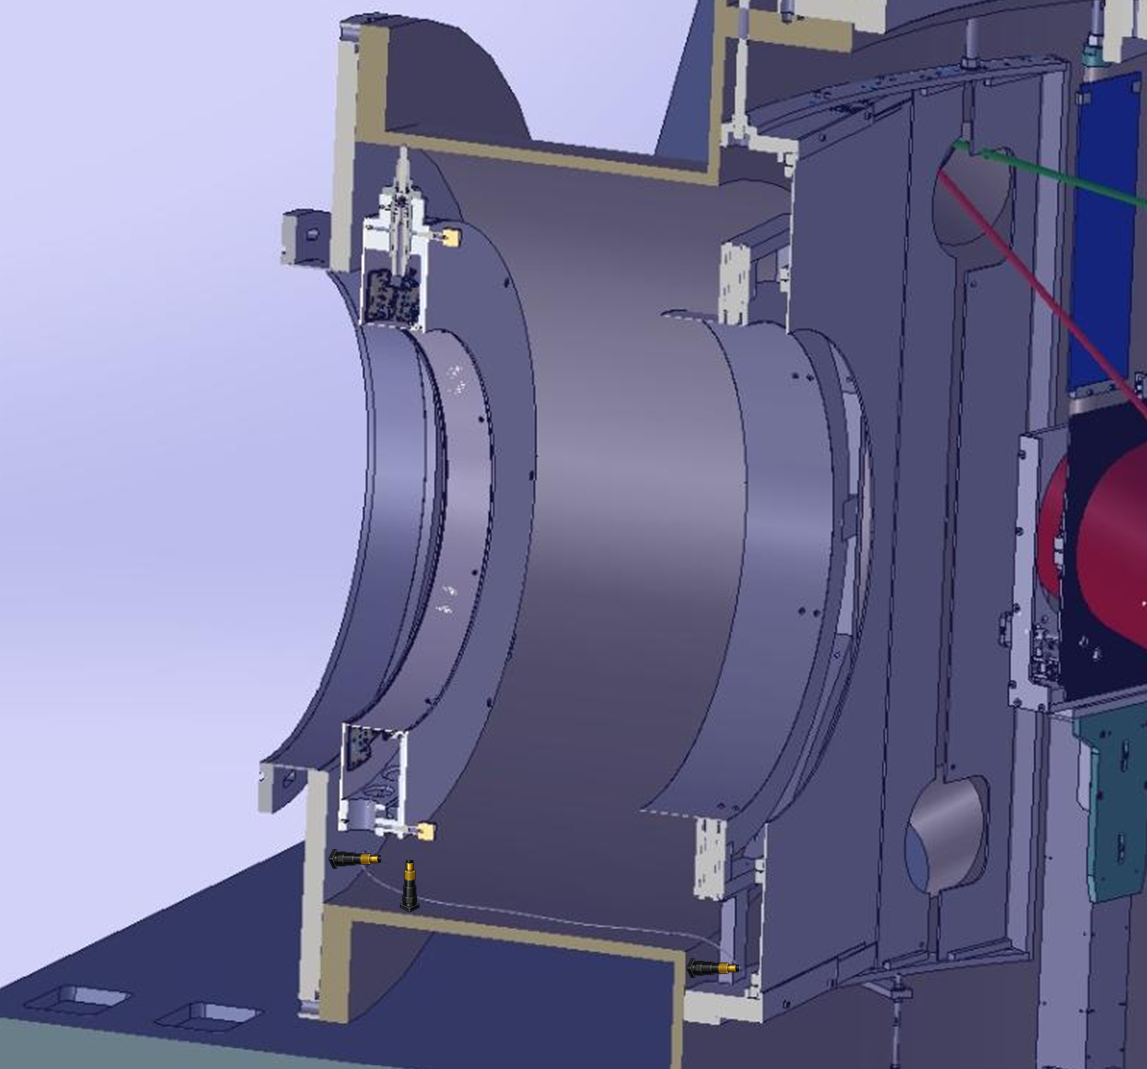
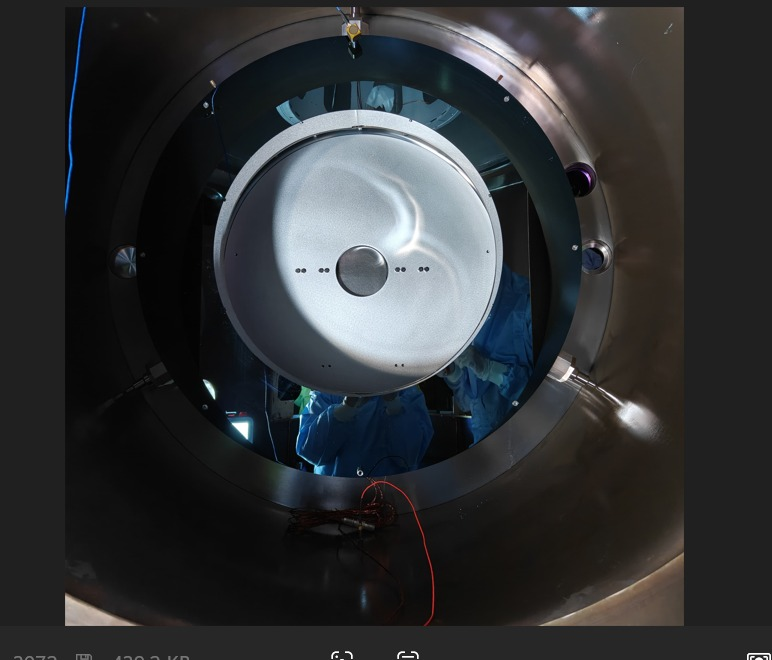
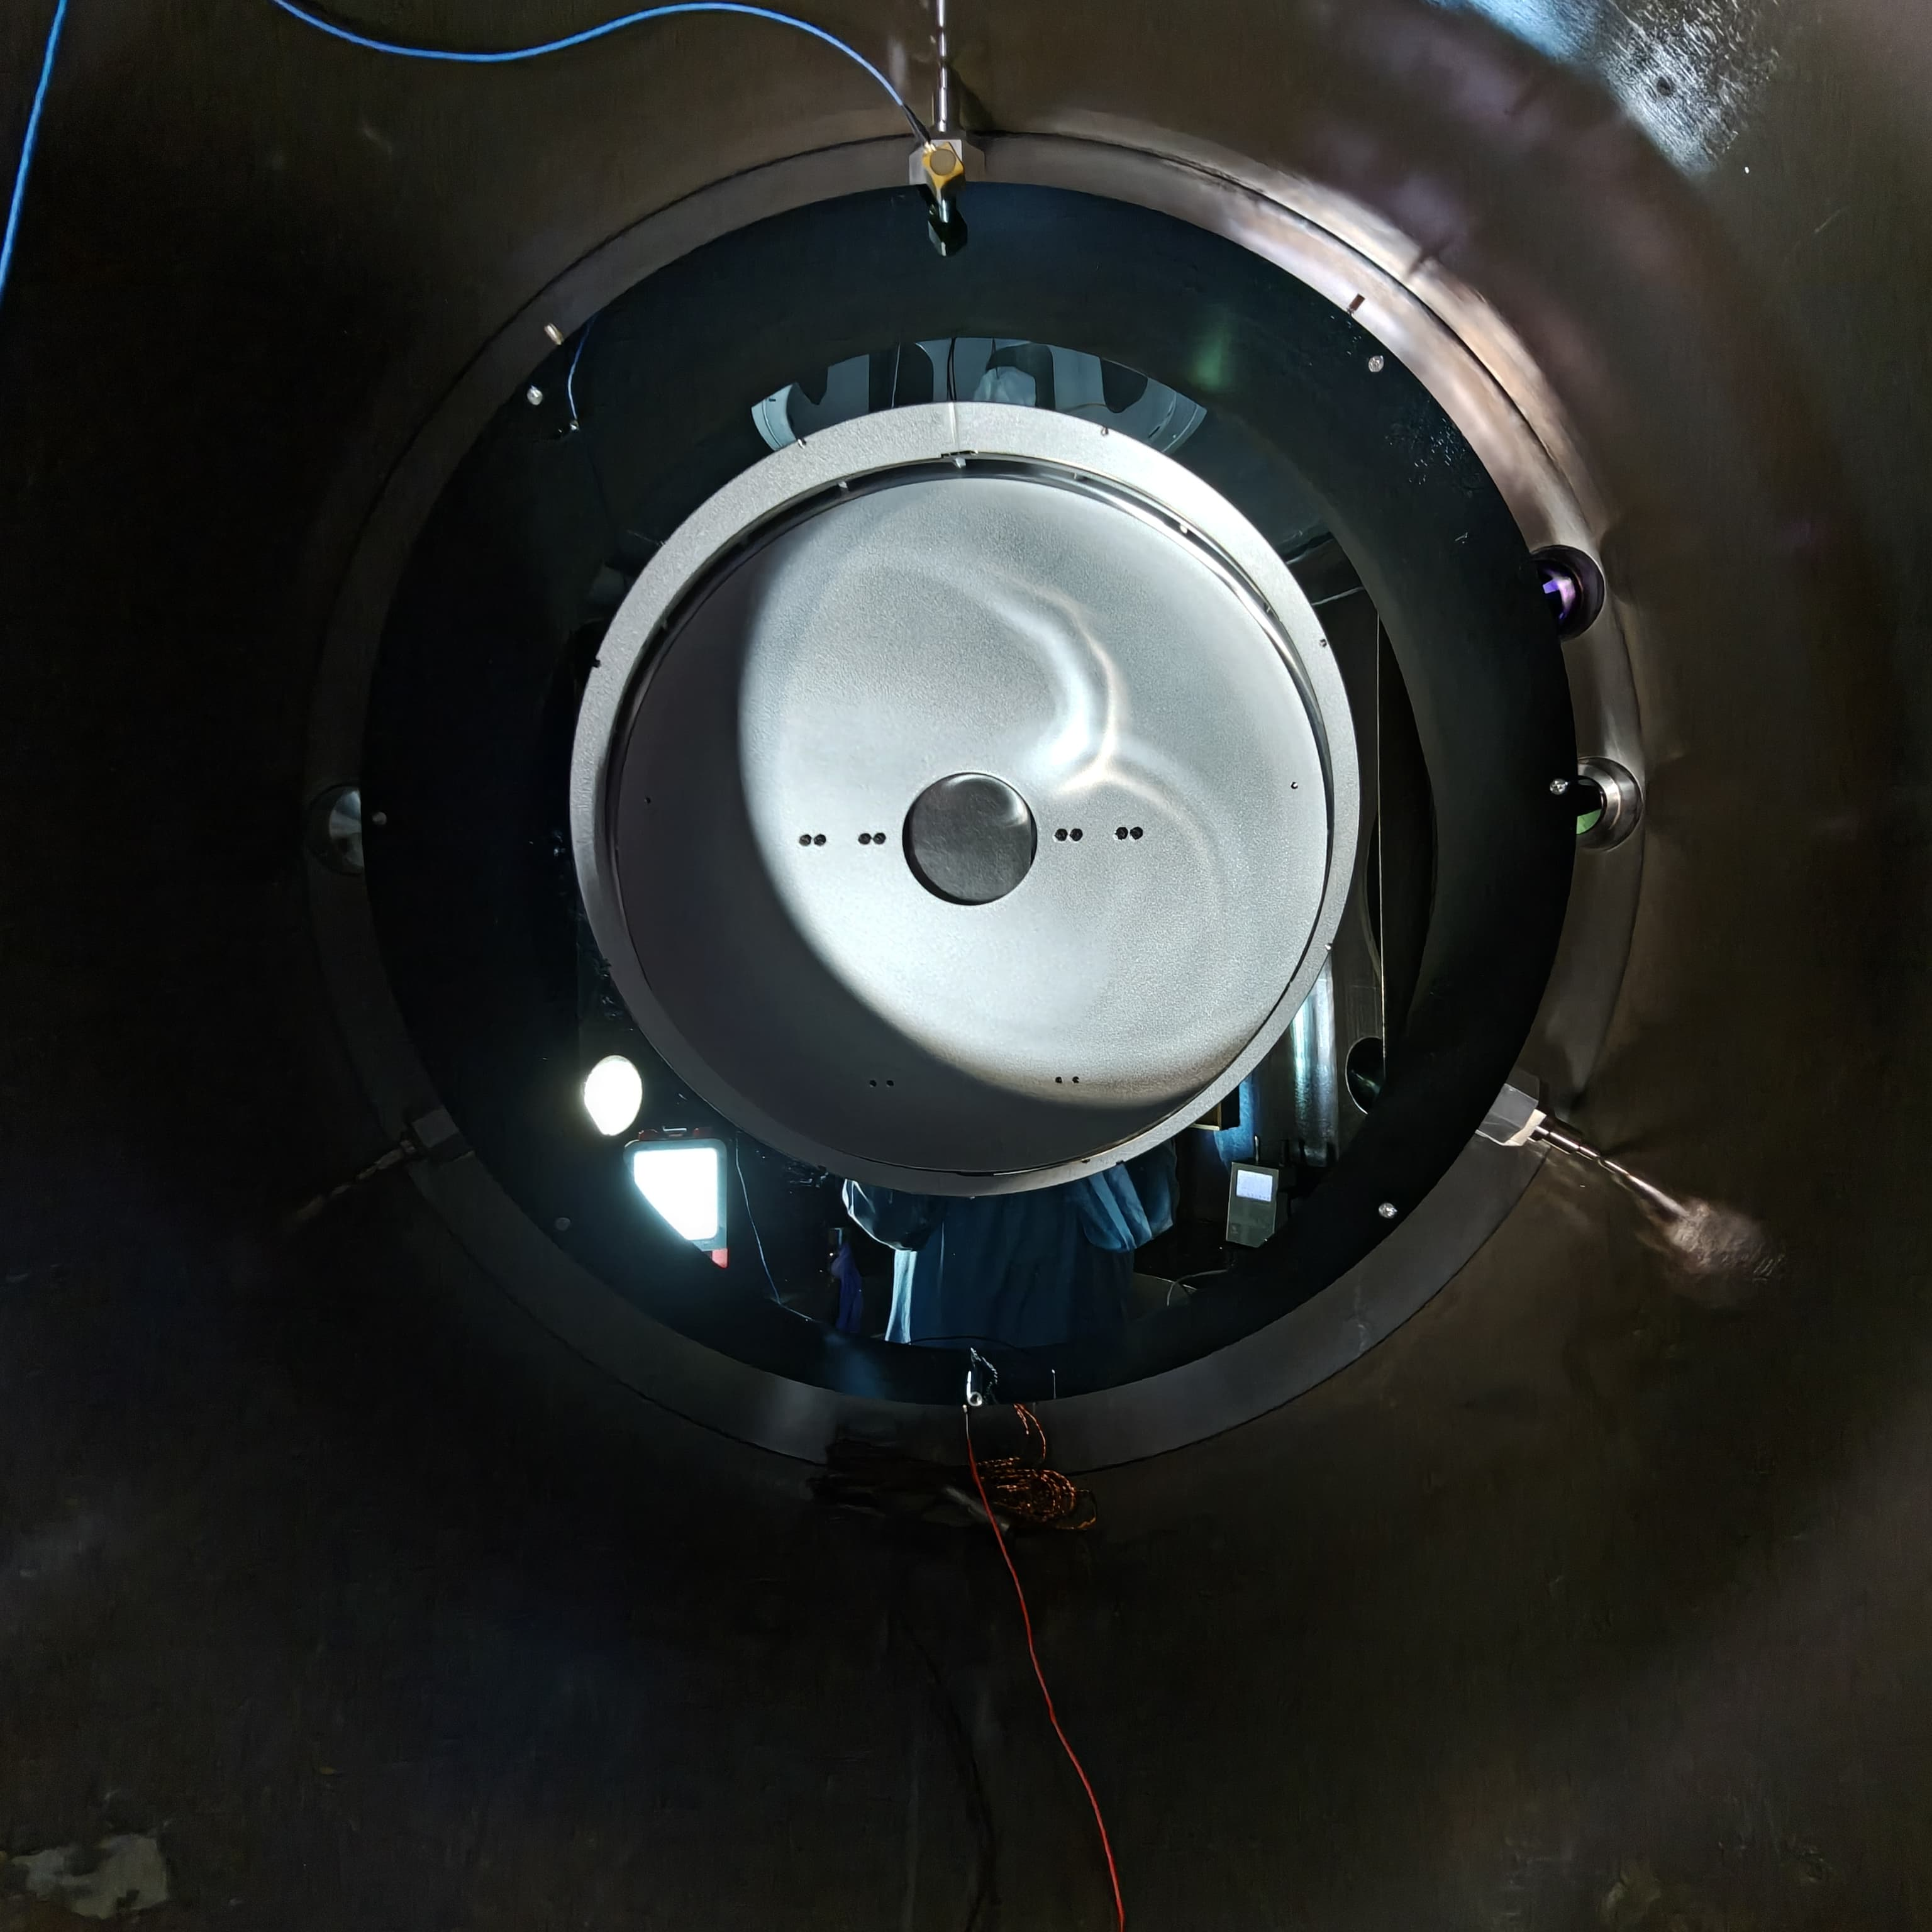
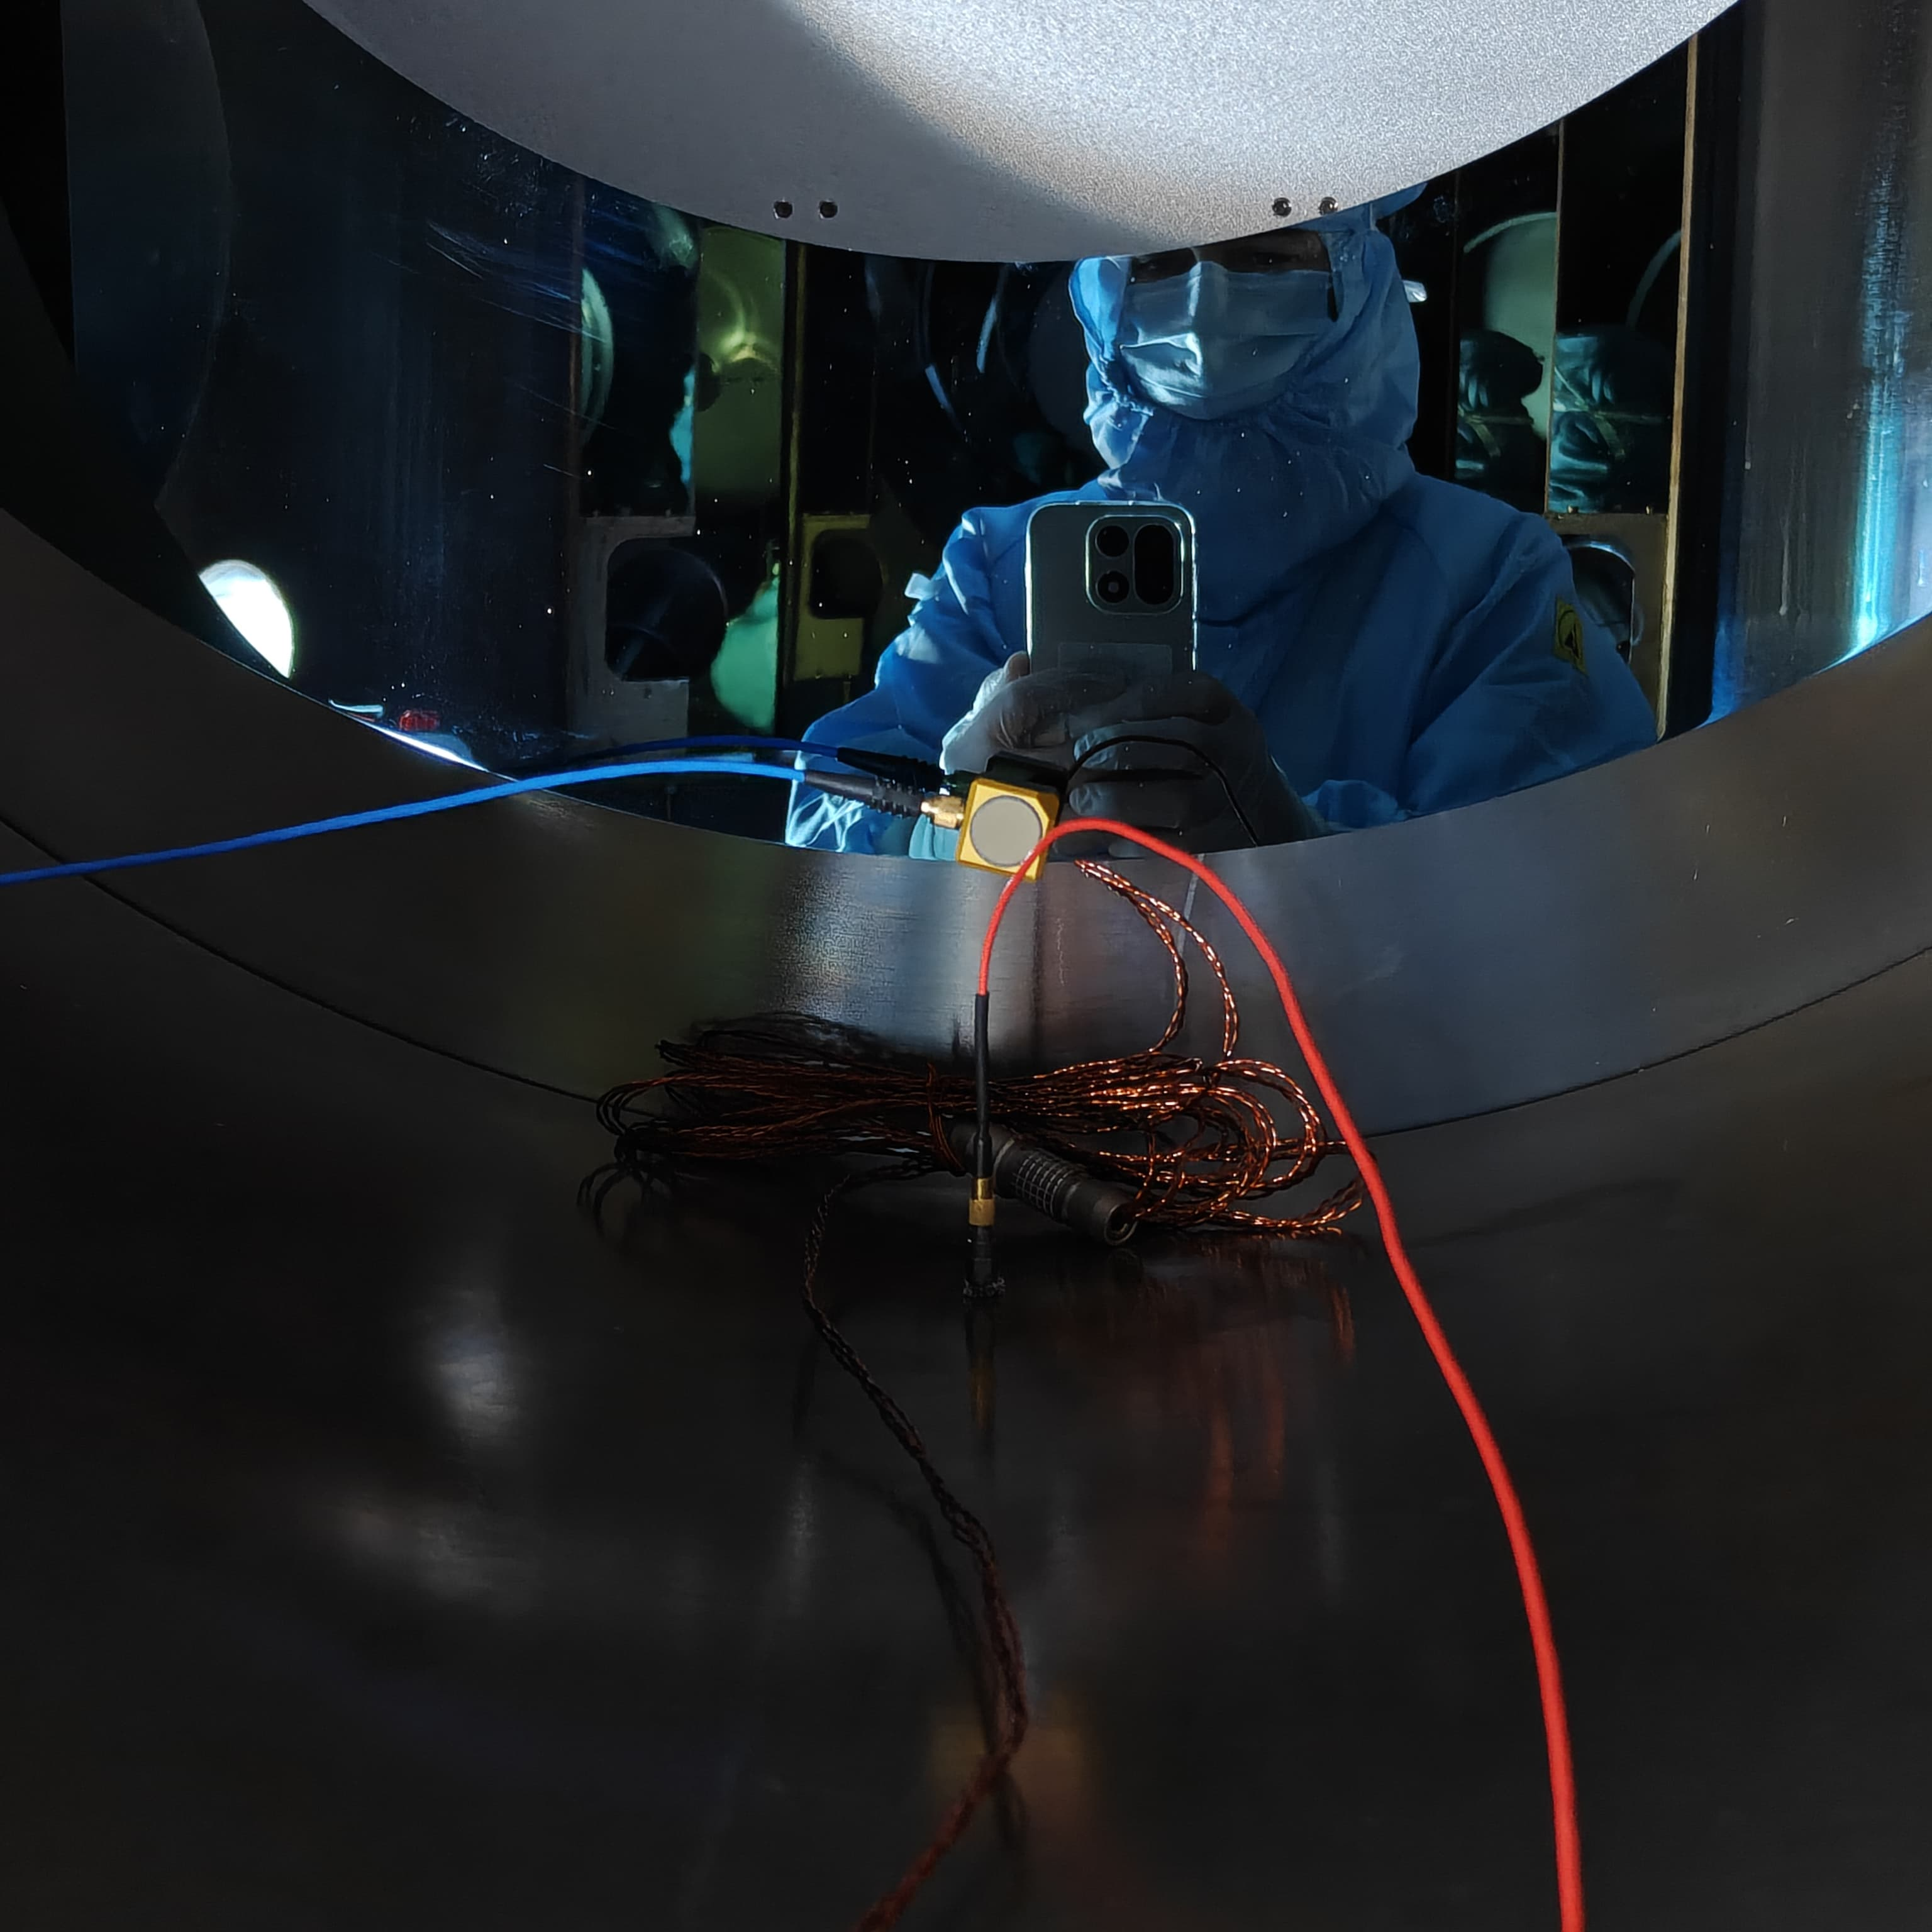
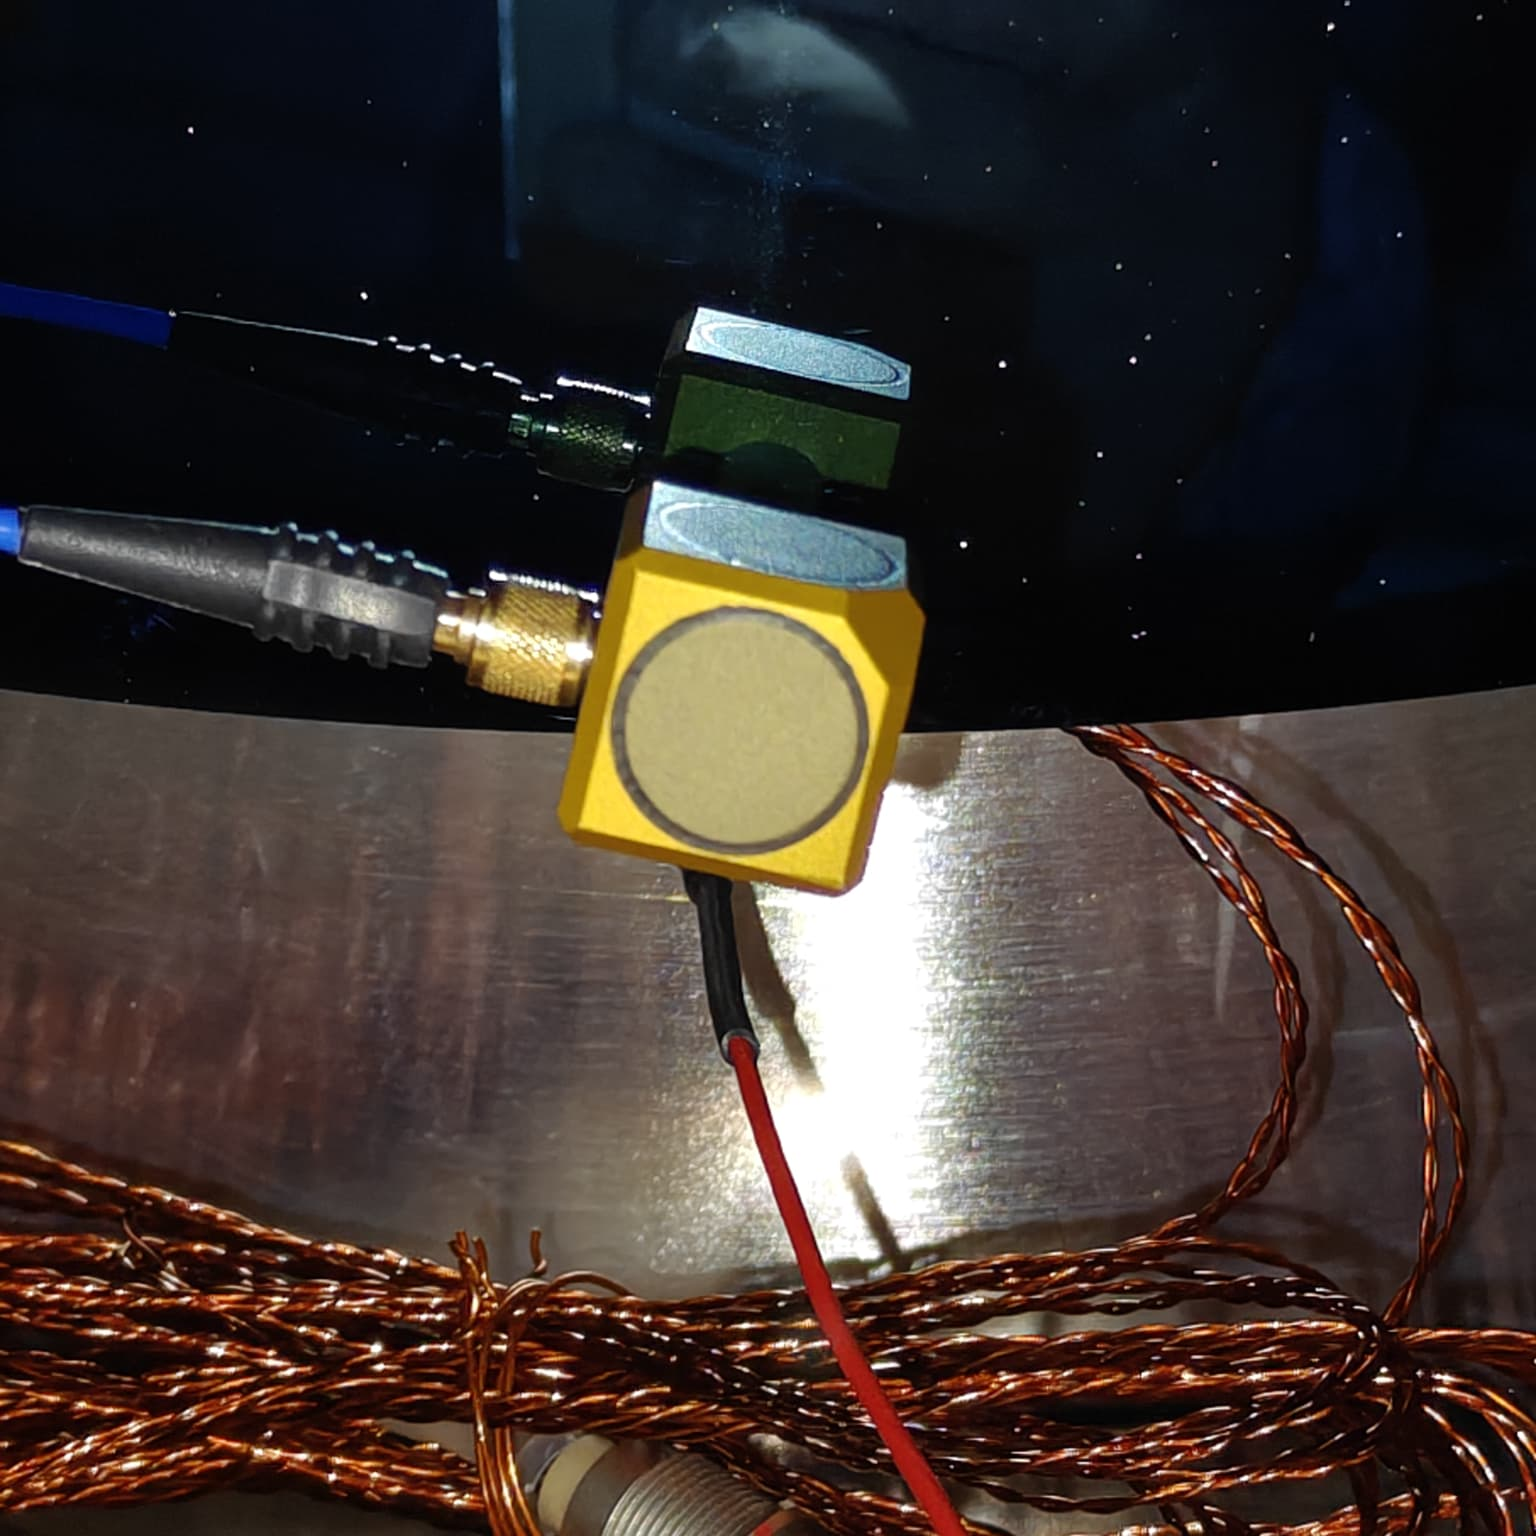
As a test we performed measurement of mechanical modes of the the frame shown in Figure 1. We used the monoaxial accelerometer PCB352C68 on the vacuum chamber (attached with double tape, which Antonio aknowledged, asking for a careful cleaning with Acetone) and the triaxial accelerometer PCB356B18 ("golden cube") attached to the frame in different positions, aslo with double tape. For the data acquisition we used the CoCo80X.

We tested (the full set of measurements is detailed in the attached .txt file):

  • injecting different levels of colored noise 10-1200 Hz to the shaker (0.02,0.03,0.04 V). For reference, inside ENVnoise.cfg:
    ACL_NOISE_CH                noise_white            "V"     5    SAMP_FREQ    1.0
    ACL_FILTER_CH                noise_colored        "V"    5    SAMP_FREQ    noise_white    0.03    "flt3"
    and inside ENVnoise_Filters.cfg:
    ACL_FILTER_SET         "flt3"             1 1 600 20          # -->  sets gain 1 @ f0 Hz (must be the same f0)
    ACL_FILTER_BUTTERWORTH "flt3" "bandpass"  4 3 600 590
  • use of the small or the big shaker
  • two configurations for the monoaxial acc: vertical or horizontal (see pictures)
  • two positions of the cube acc. on the frame: (1) inner ring, (2) outer ring close to holding point

For each configuration we measured the TF of the monoaxial acc versus each axis (X,Y,Z) of the gold cube acc, and compared.

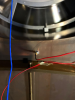
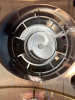
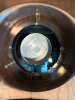
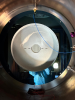
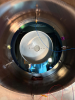
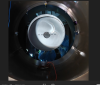
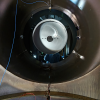
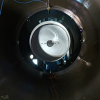
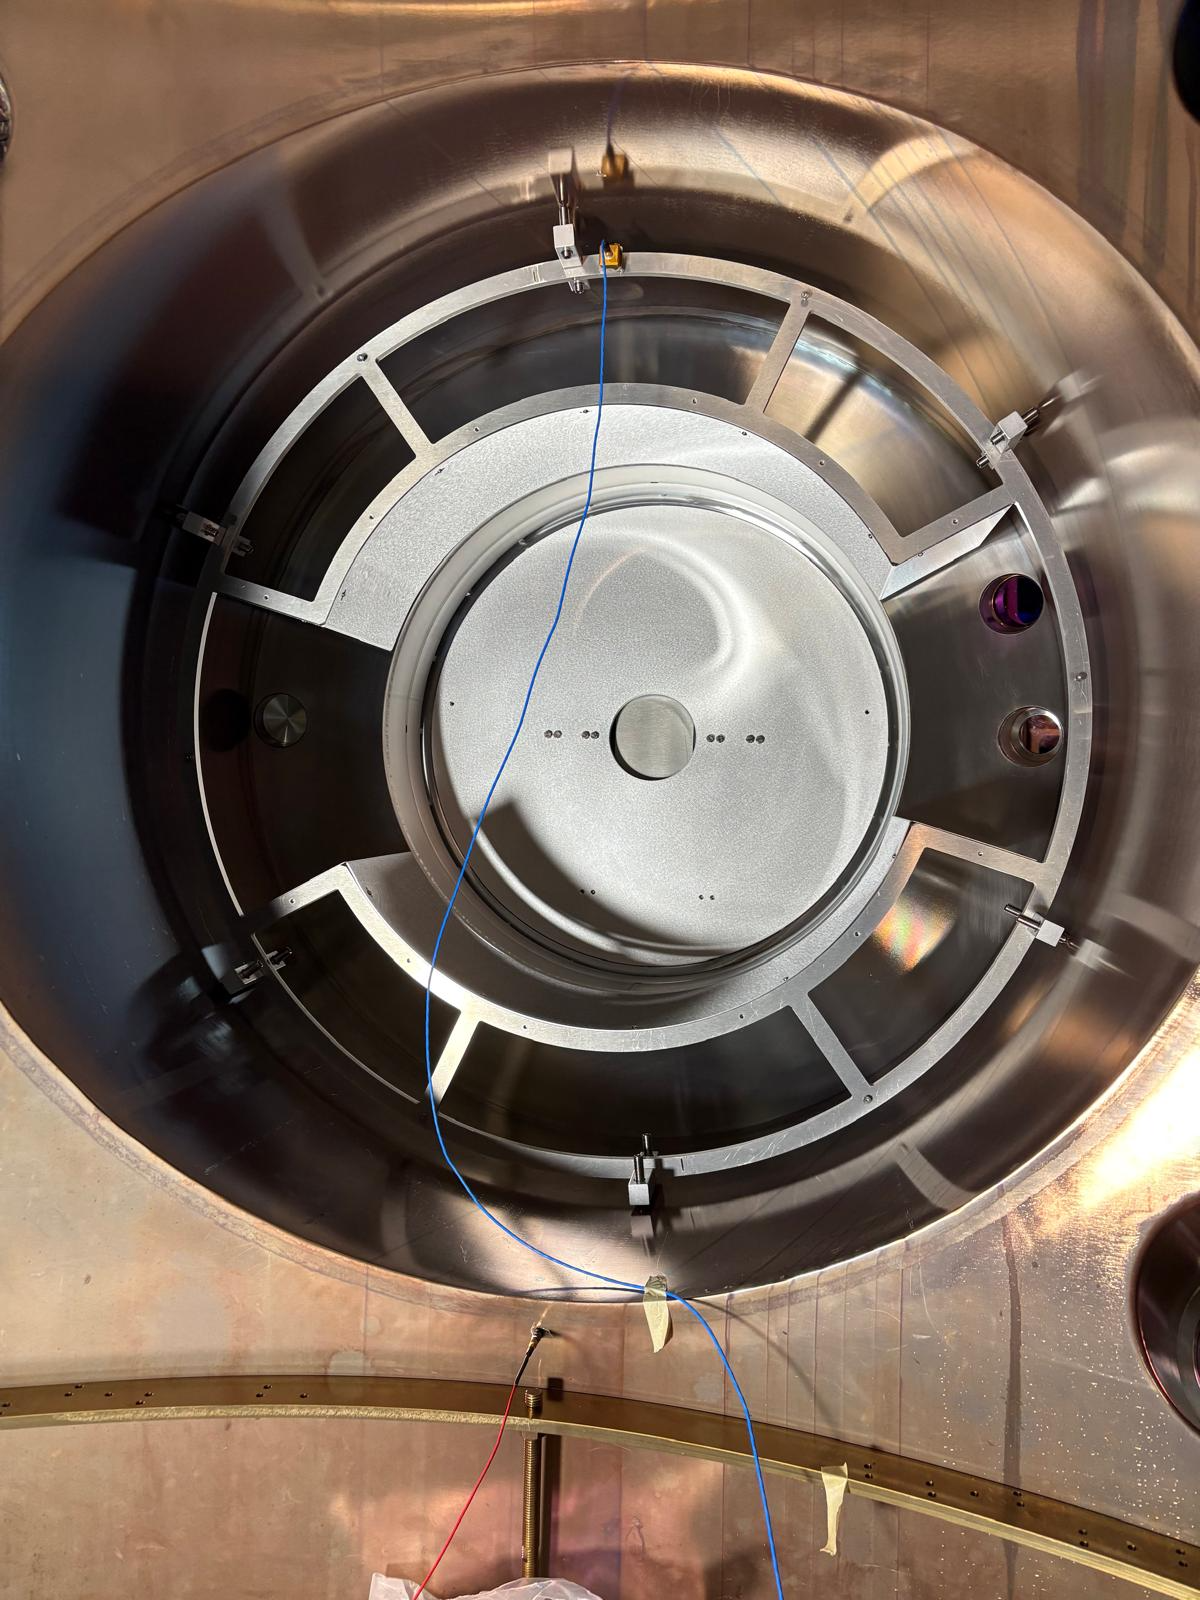
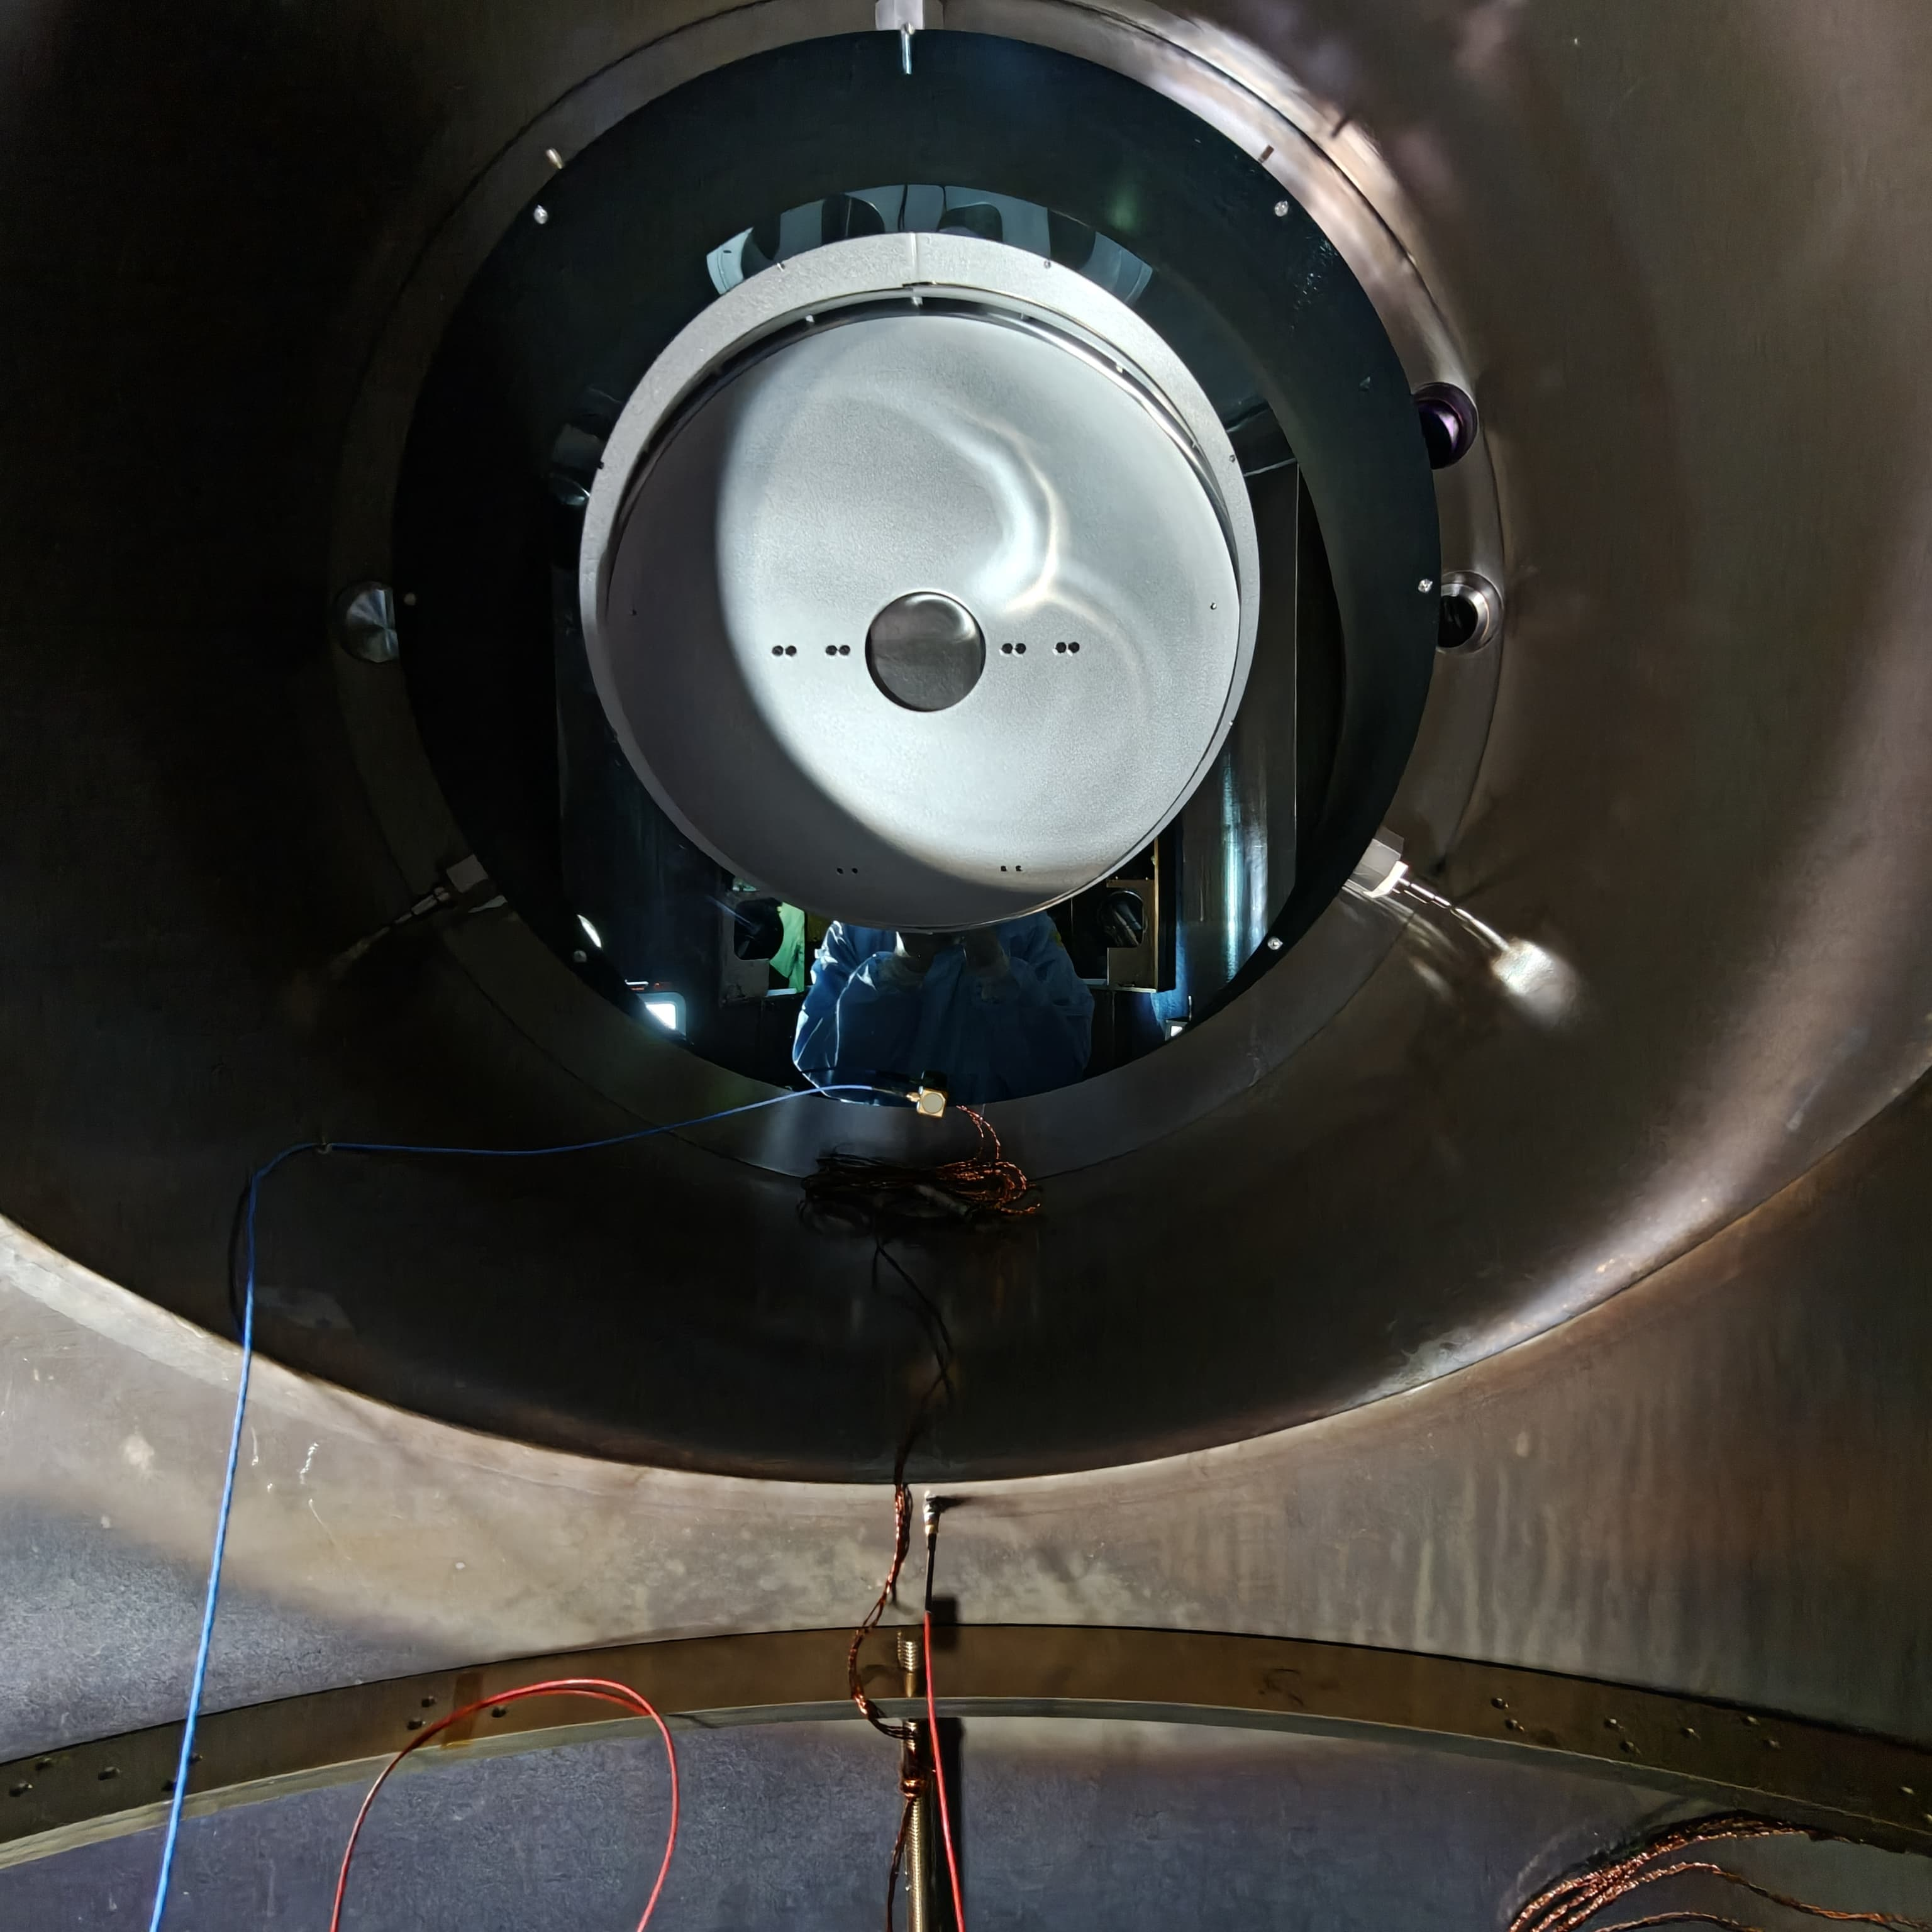
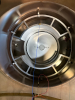
Figures 1-3 are pictures of the frame with accelerometers in different positions.

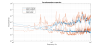
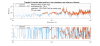
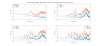
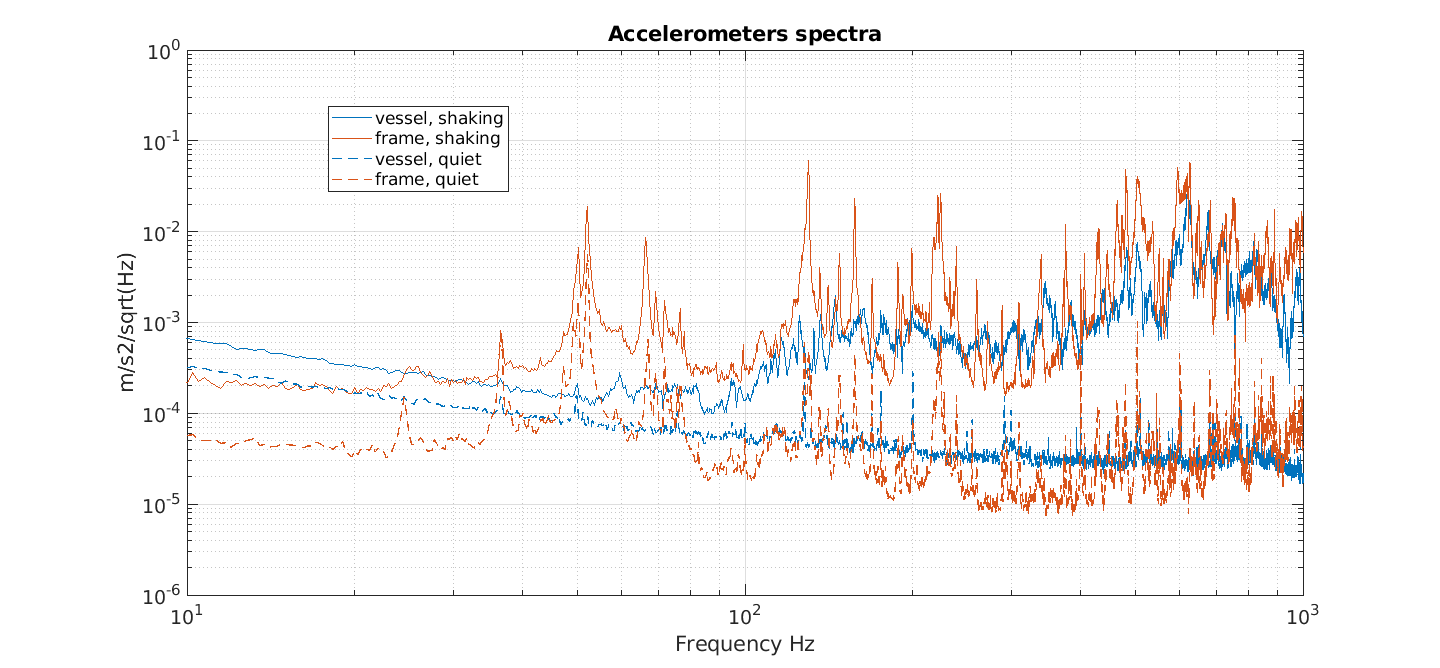
Figure 4 compares spectra during quiet and during shaking. The shakers were able to excite above the quiet noise in the whole expected range.
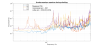
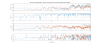
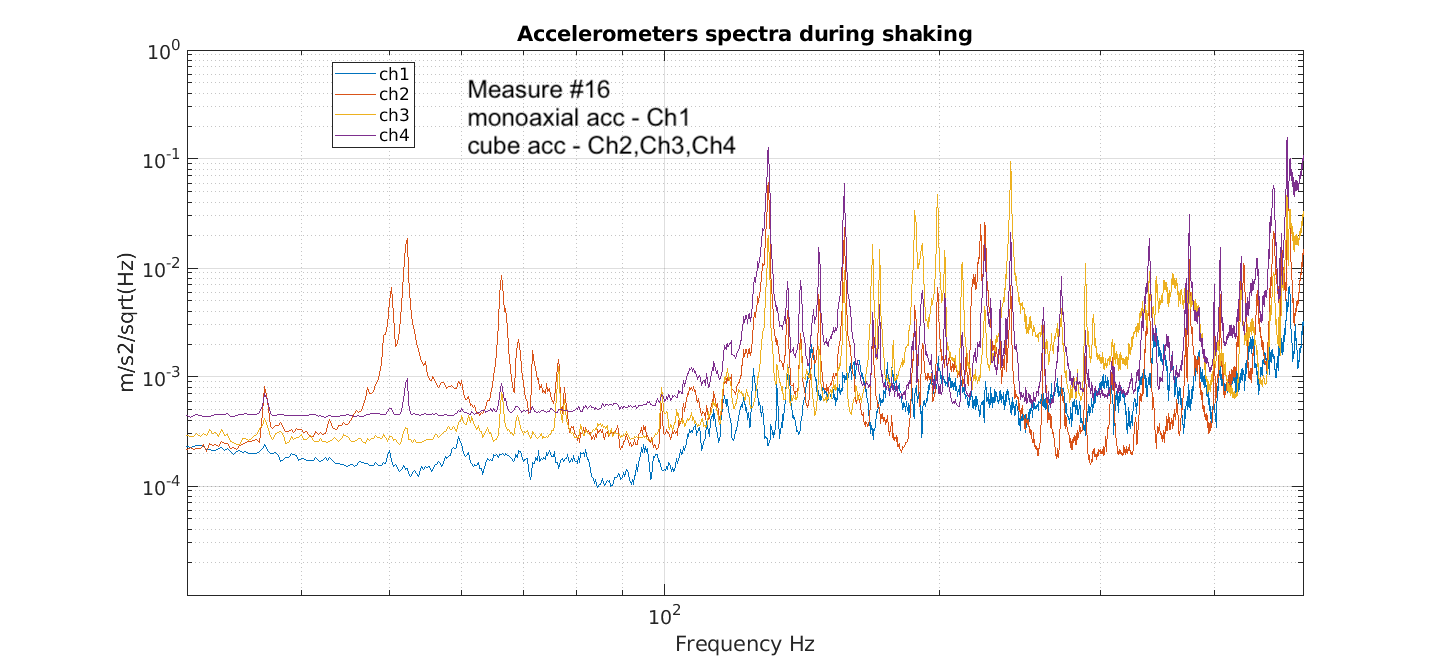
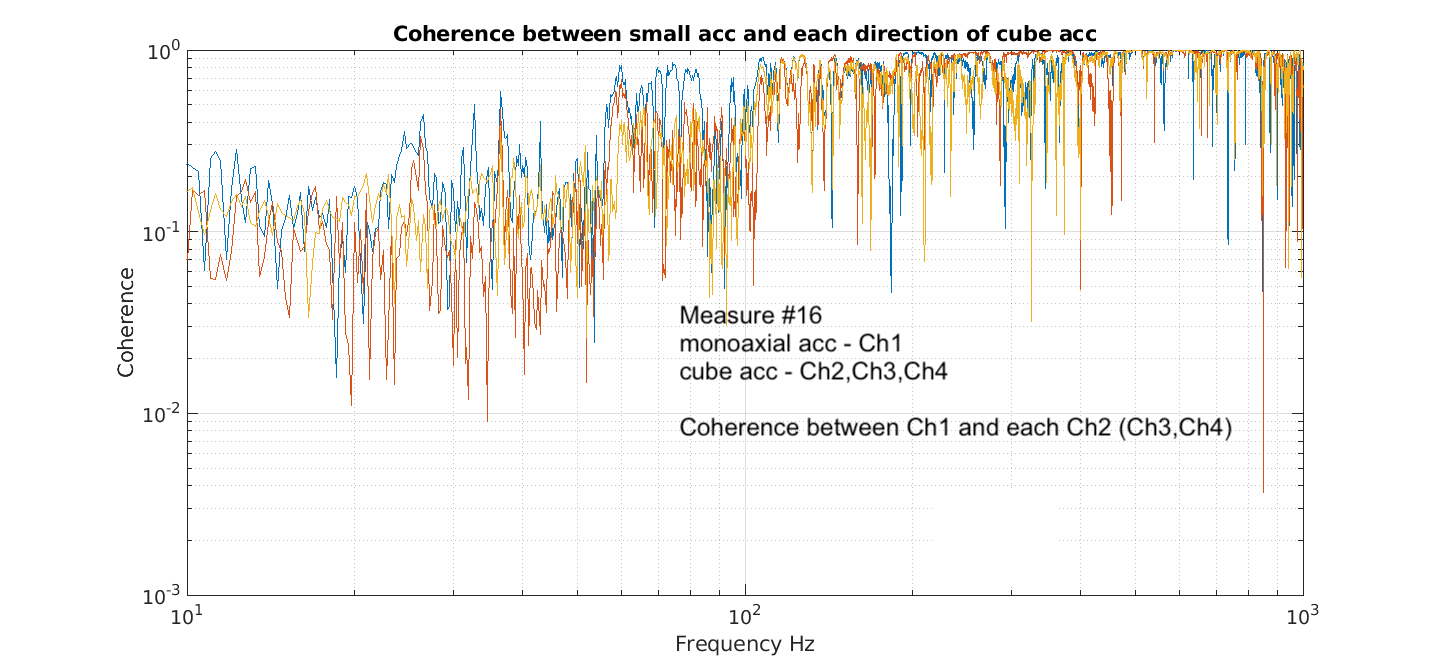
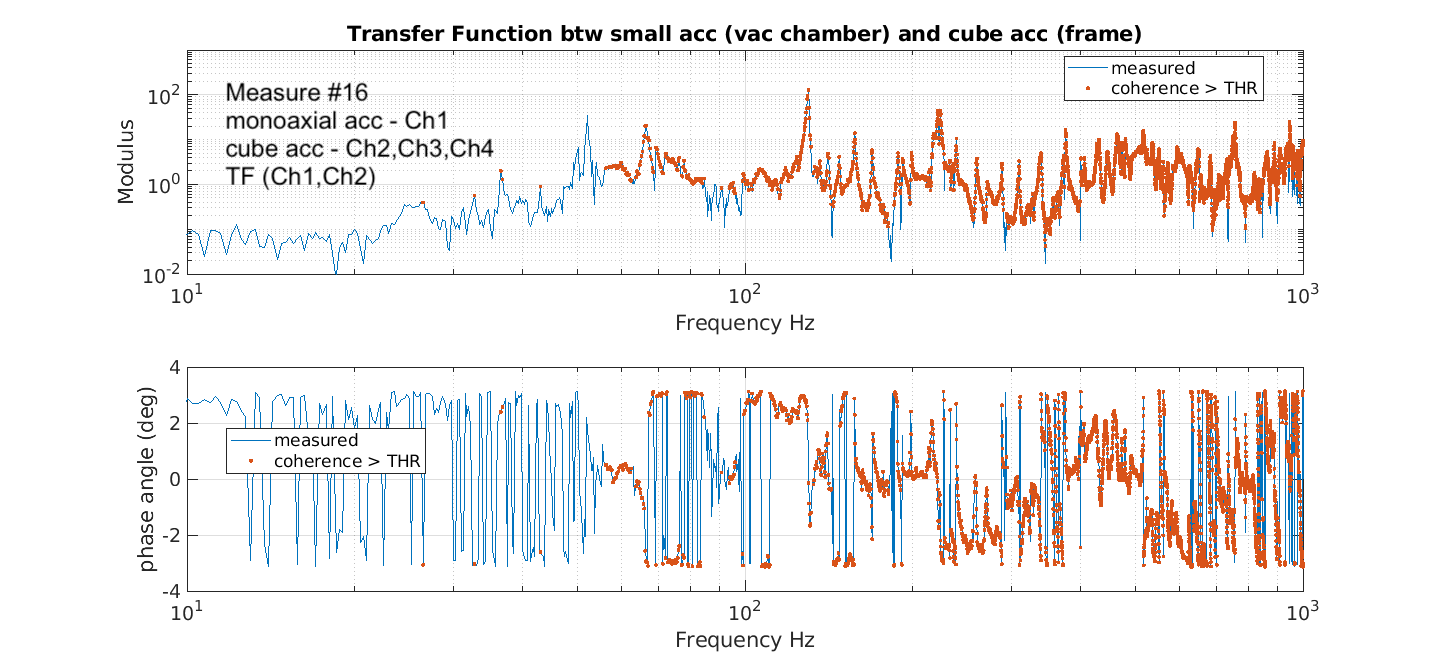
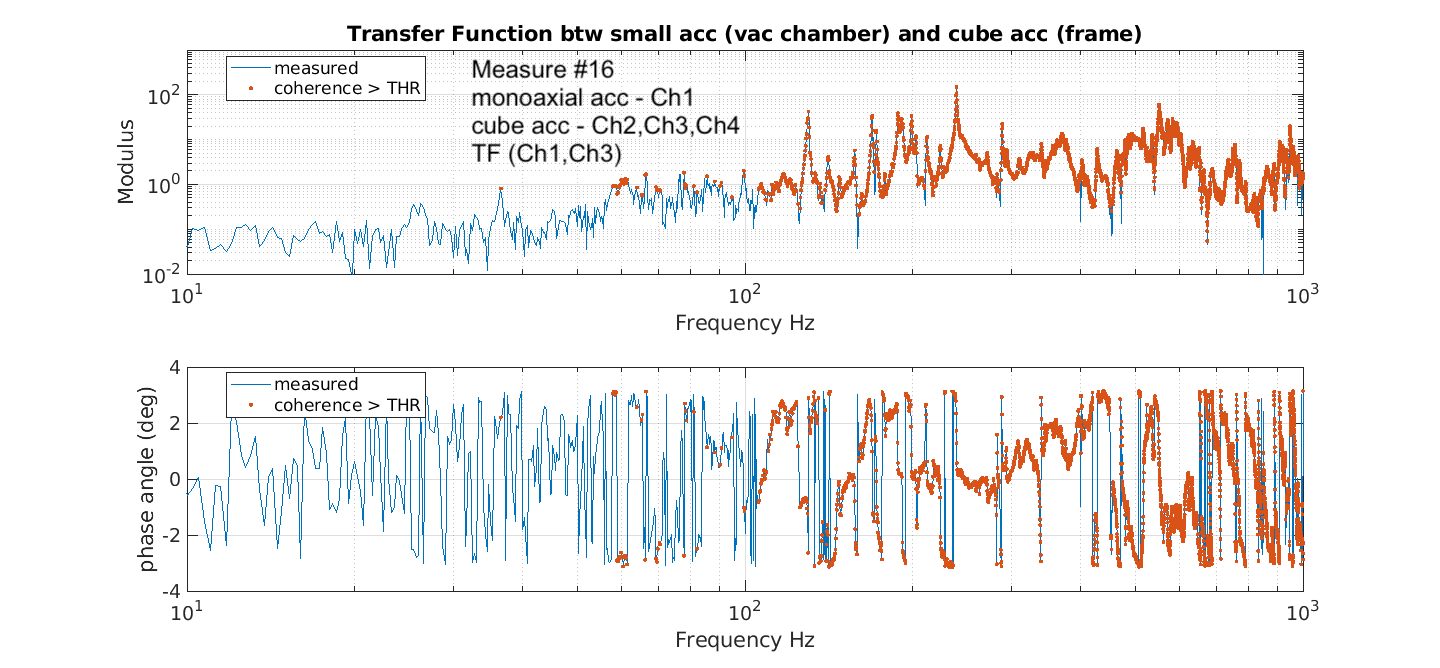
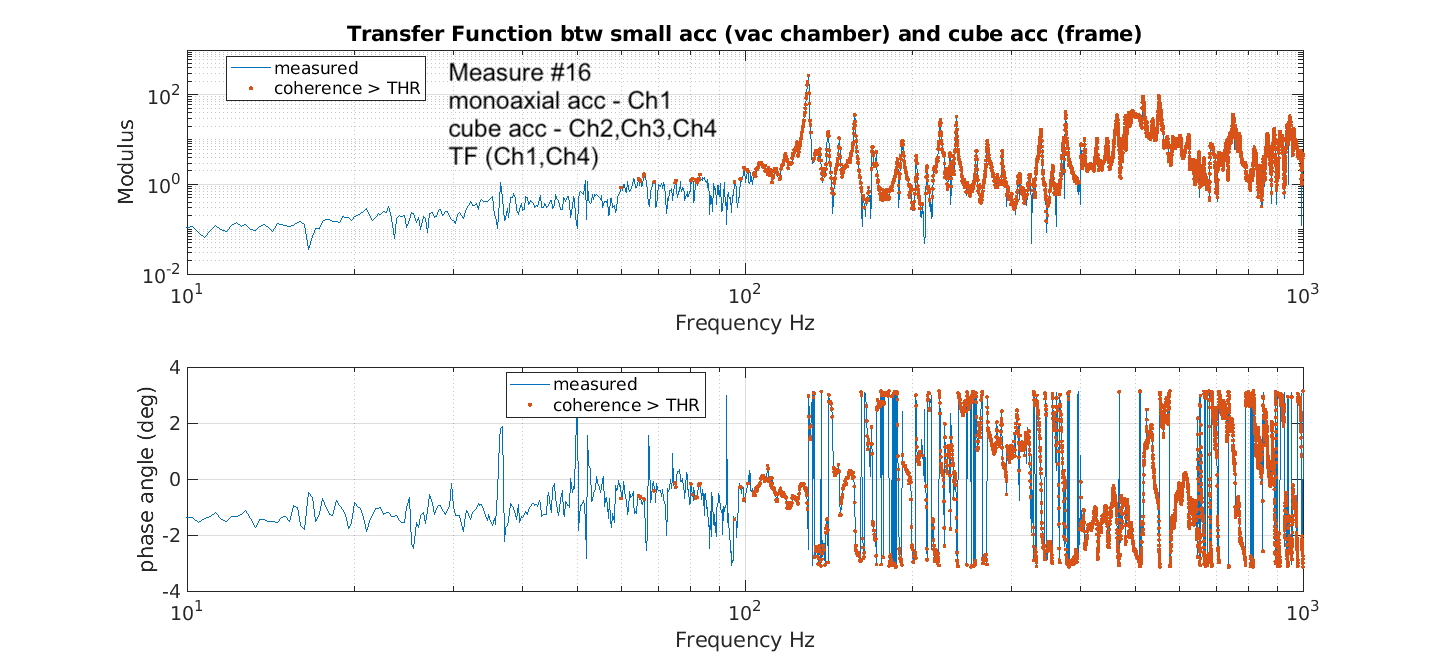
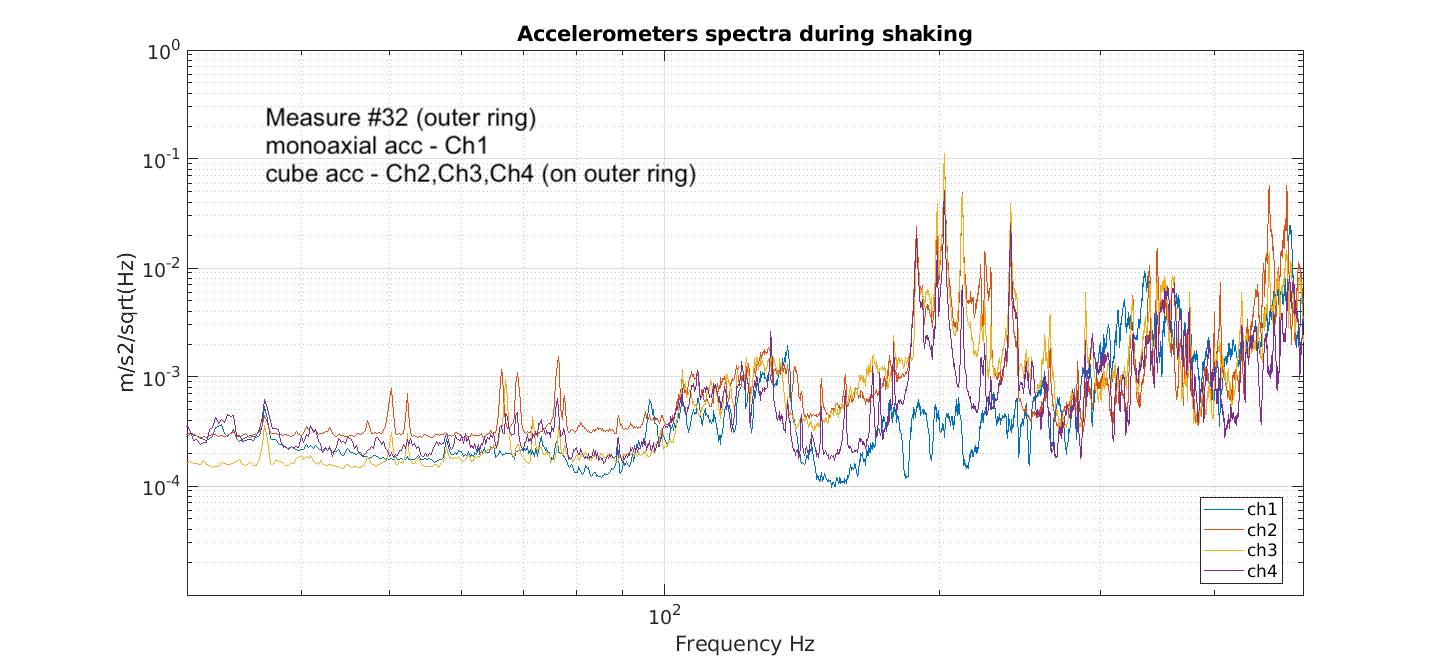
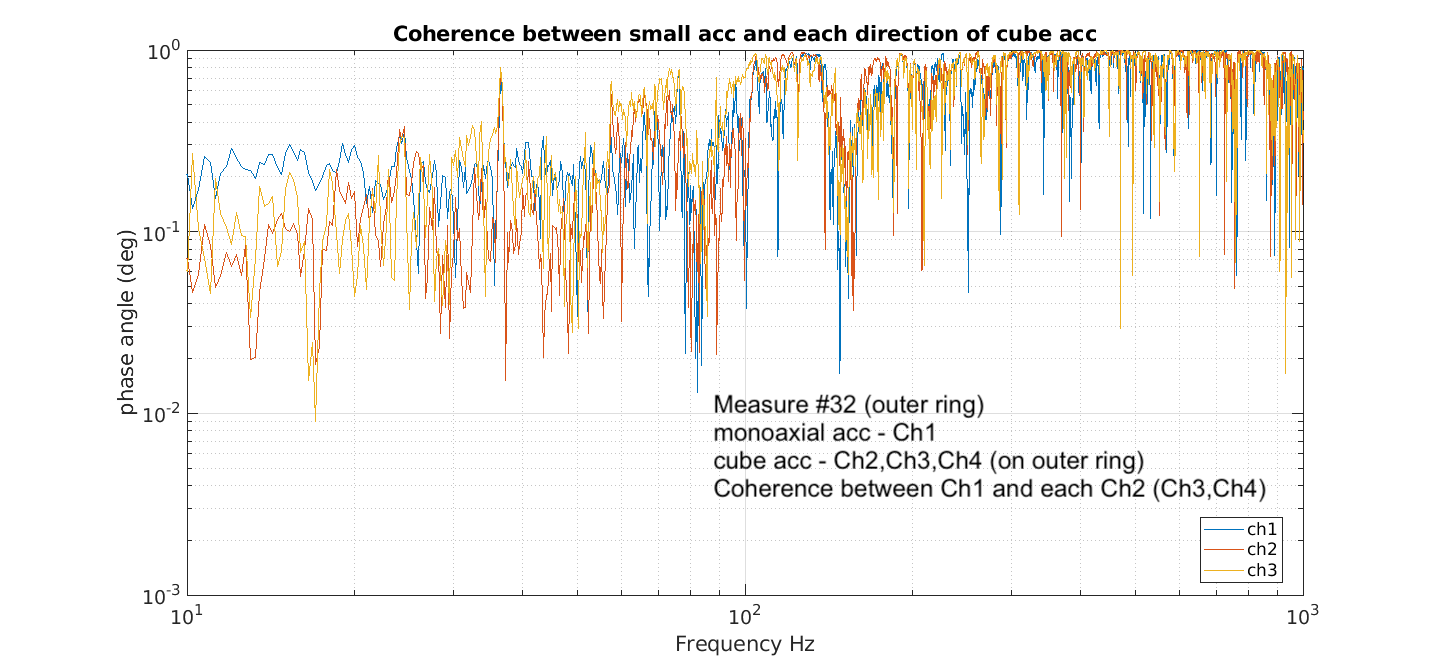
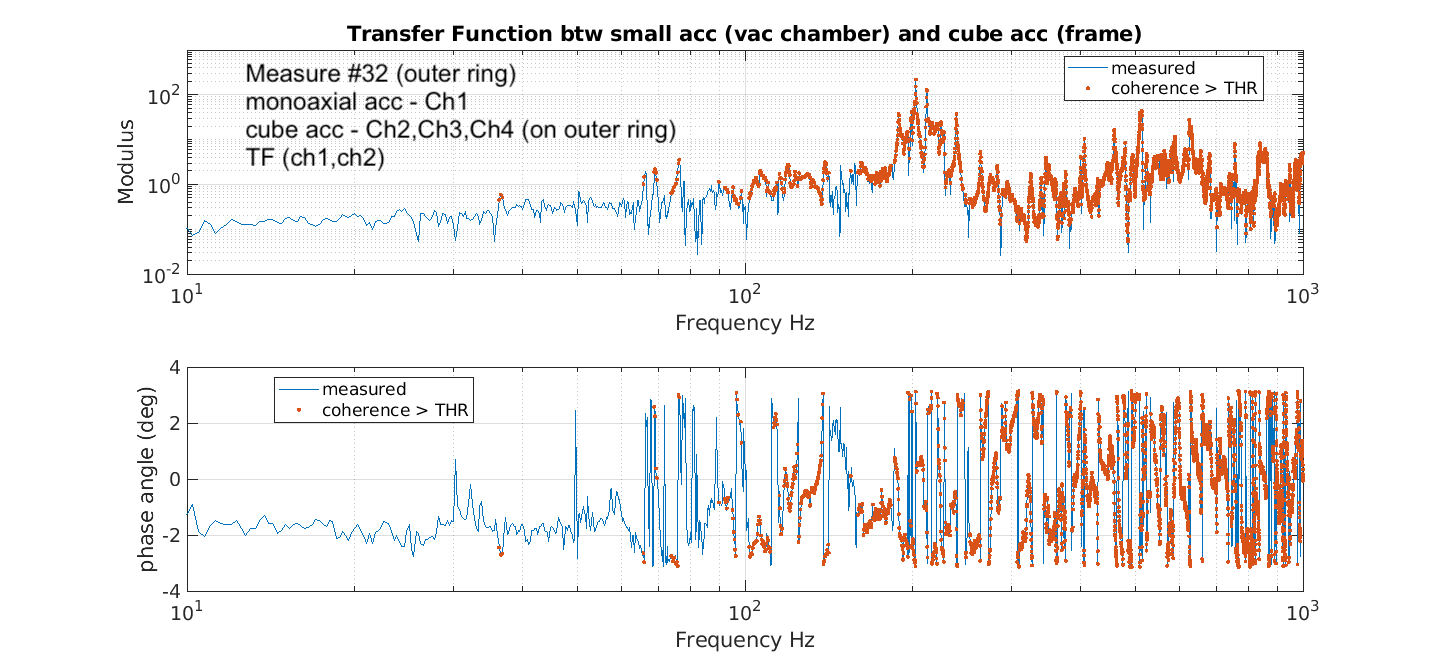
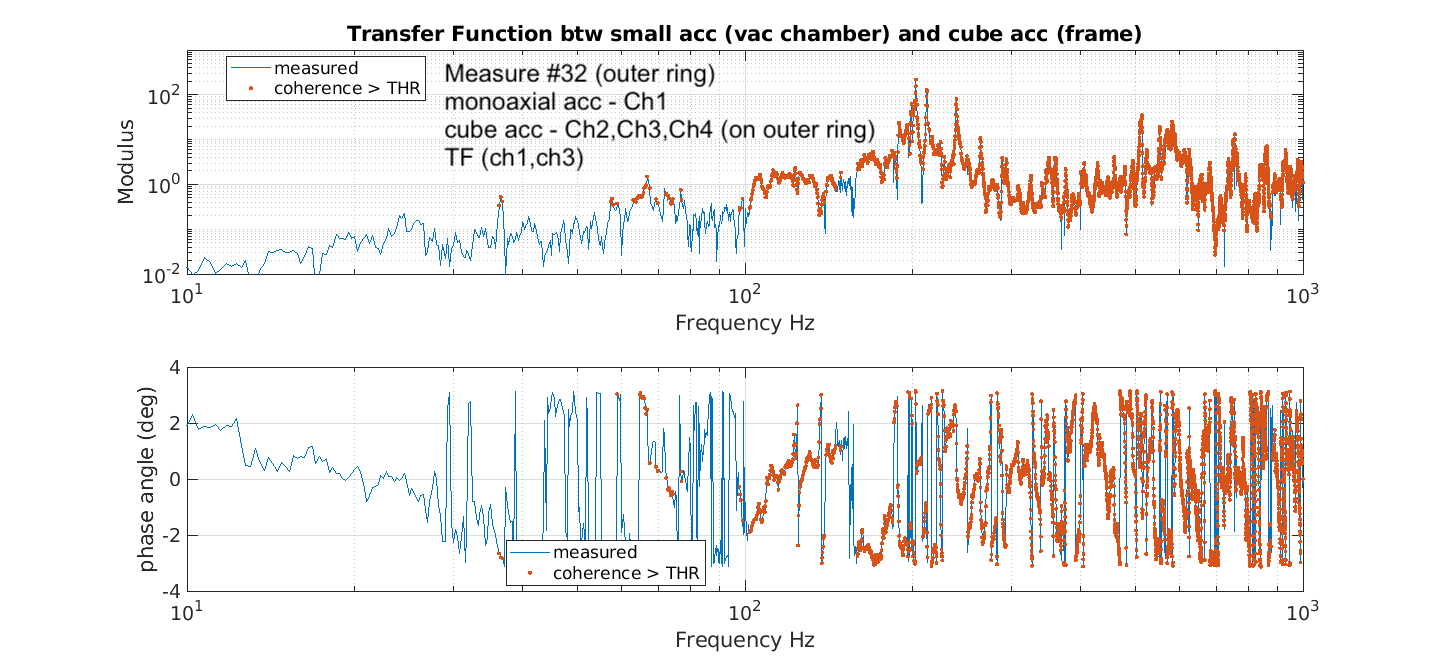
Figures 5-9  refer to the setup with monoaxial acc. horizontally placed on the vessel and the cube acc on the inner ring of the frame. They show: spectra, coherence, TF between monoaxial acc and each of the three direction of the cube acc.
Figures 10-end is the same set, but when the cube acc. was positioned on the outer ring of the frame, near to the frame's holding point.

Measurements were satisfactory, the setup works. 
A number of peaks were excited especially in the range 50Hz to a few hundred Hz. Good coherence is measured in this range.
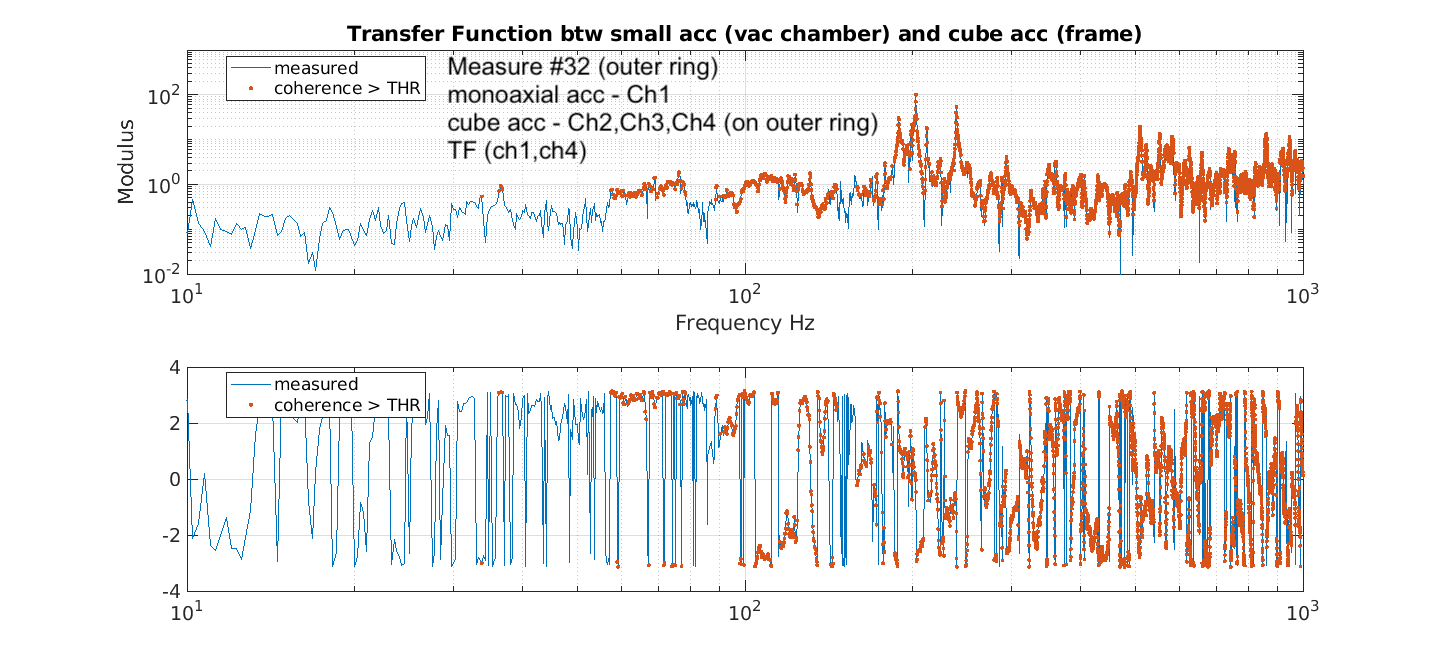
TFs look satisfactory: we observe phase rotation in correspondence of the main excited modes. The red points in the TF plots correspond to coherence > 0.4.

Moving the cube accelerometer from the inner to the outer ring of the frame, some peaks are no longer excited (for example the 130Hz peak is no more observed). As expected, this position is more rigid and low frequencies modes are not easily detectable from here.

Additional observations:
Tests indicate a slightly better preference for using the small shaker, with level 0.03V. The placing of the accelerometer on the vacuum chamber, horizontal or vertical, does not make significant difference in the measured TF. 
Images attached to this report
Non-image files attached to this report
Comments to this report:
Tringali, Carmona, Delgado, Spinicelli, Ballester, Fiori, Mir - 23:30 Tuesday 16 June 2026 (69243) Print this report

*** Mechanical Transfer Function Measurement of the NI Instrumented Baffle ***

Today, mechanical transfer function measurements of the NI instrumented baffle were performed. The instrumentation, data acquisition system and excitation setup are described in the previous logbook entry [elog 69222]. The instrumented baffle was excited using the (big) shaker installed on the tower base.
The single reference monoaxial accelerometer was sequentially moved among three different locations within the NI tower, shown in Figure 1 (first pdf file):

  • R1: horizontal mounting position below the instrumented baffle;
  • R2: vertical mounting position located close to the instrumented baffle;
  • R3: horizontal mounting position on the vacuum vessel.

Figure 1 shows the three reference locations together with close-up views of the sensor installation. 

The triaxial accelerometer was mounted directly on the instrumented baffle and moved between two different locations during the measurement campaign. The upper and lower accelerometer positions are shown in Figure 2 (second pdf file).
The sensor was attached using a custom adapter manufactured by the IFAE group. Due to the threaded mounting, the final orientation of the sensing axes was determined by the thread engagement and could not be precisely aligned with the nominal vertical-horizontal reference frame.

The resulting sensor orientations were:

  • Top position: x-axis aligned with the cable direction, z-axis aligned with the adapter axis.
  • Bottom position: x-axis aligned with the cable direction, y-axis aligned with the adapter axis.

Figure 3,4,5: Measurement configurations with the accelerometer mounted in the upper position of the instrumented baffle. The three figures show the corresponding locations of the reference accelerometer: R1,R2,R3, respectively.

Figure 6, 7, 8 : Measurement configurations with the accelerometer mounted in the lower position of the instrumented baffle. The three figures show the corresponding locations of the reference accelerometer: R1, R2, R3, respectively

The measurements were performed before the installation of the flange baffle, in order to access the instrumented baffle structure directly.

The analysis of the acquired data will follow.

Images attached to this comment
Non-image files attached to this comment
Spinicelli, Carmona, Delgado, Tringali, Ballester, Fiori, Mir - 8:58 Friday 19 June 2026 (69255) Print this report

*** Mechanical Transfer Function Measurement of the WI Instrumented Baffle *** 

Today, mechanical transfer function measurements of the WI instrumented baffle were carried out following the same procedure adopted for the WI instrumented baffle. The measurement configurations are shown in Figure 1.
As in the NI measurement campaign, the triaxial accelerometer was mounted on the instrumented baffle through a custom adapter. The final orientation of the sensor exhibited a slight misalignment with respect to the nominal vertical and horizontal directions. The resulting sensor orientations for the WI measurements were:

  • Top position: x-axis aligned with the cable direction, y-axis aligned with the adapter axis.
  • Bottom position: x-axis aligned with the cable direction, z-axis approximately aligned with the adapter axis.

Figure 2,3,4: measurement configurations with the accelerometer mounted in the upper position of the instrumented baffle and the reference accelerometer positions. 

Figure 5,6,7: measurement configurations with the accelerometer mounted in the lower position of the instrumented baffle and the reference accelerometer positions. 

The analysis of the acquired data will follow.

The list of the acquisitions, together with the corresponding file names, is attached.

Images attached to this comment
Non-image files attached to this comment
Tringali, Fiori, Spinicelli - 19:26 Monday 20 July 2026 (69383) Print this report

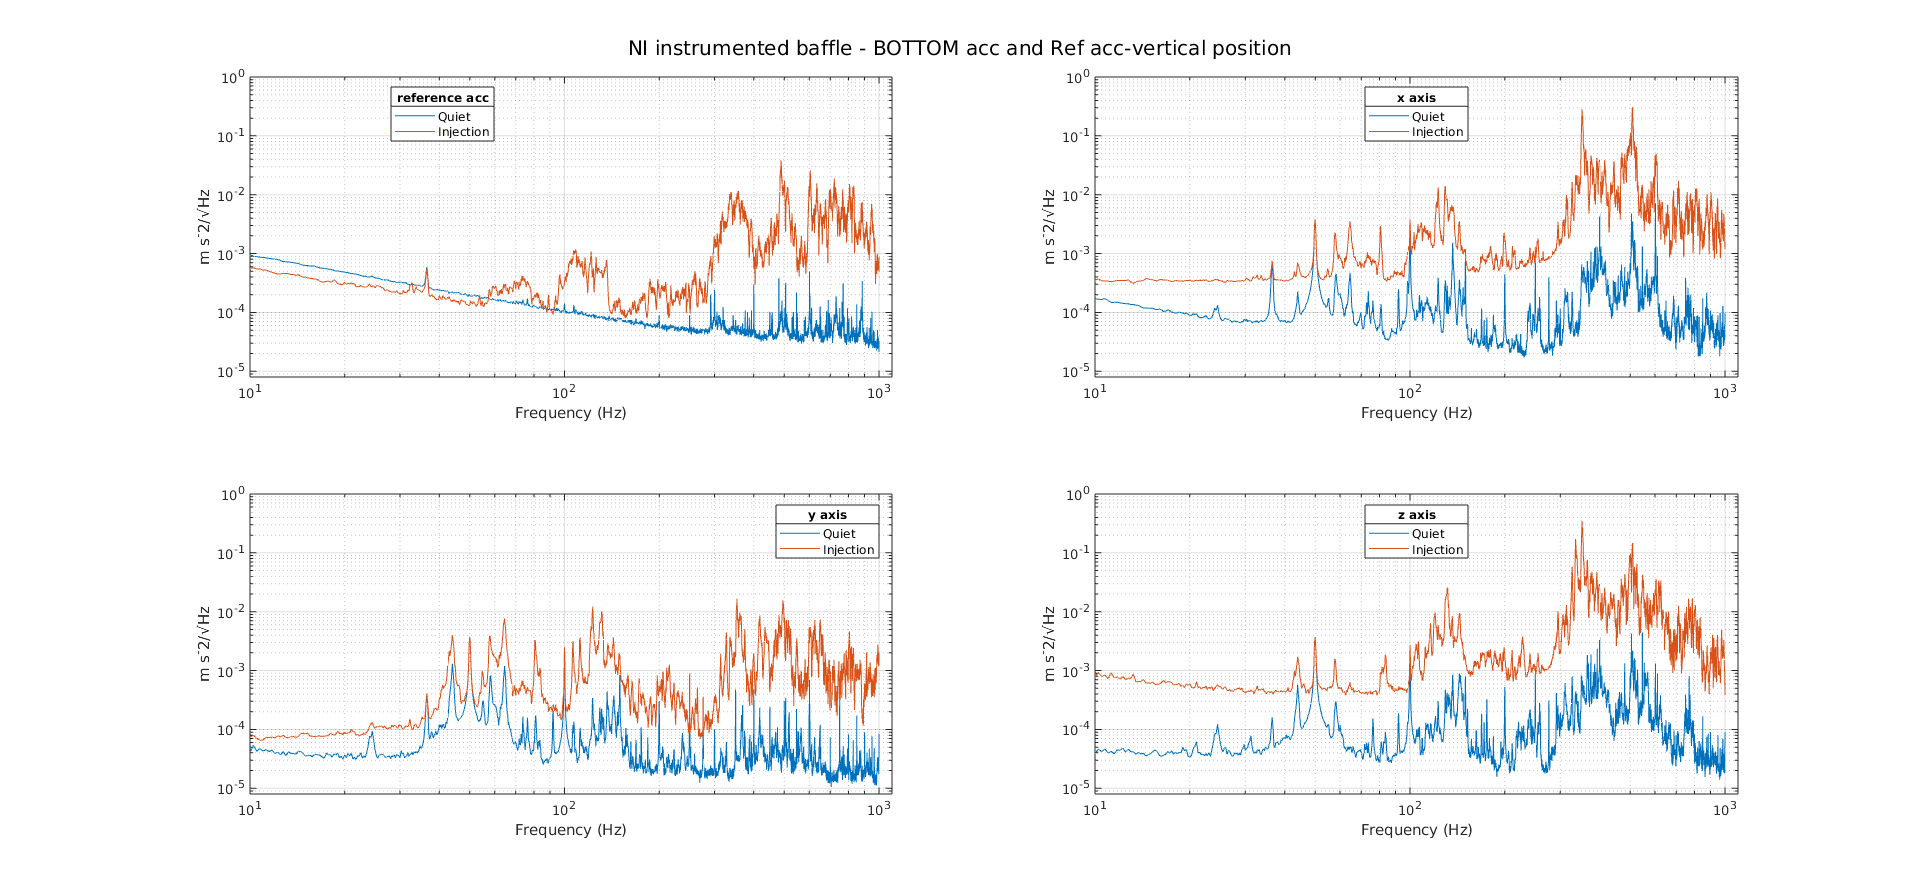
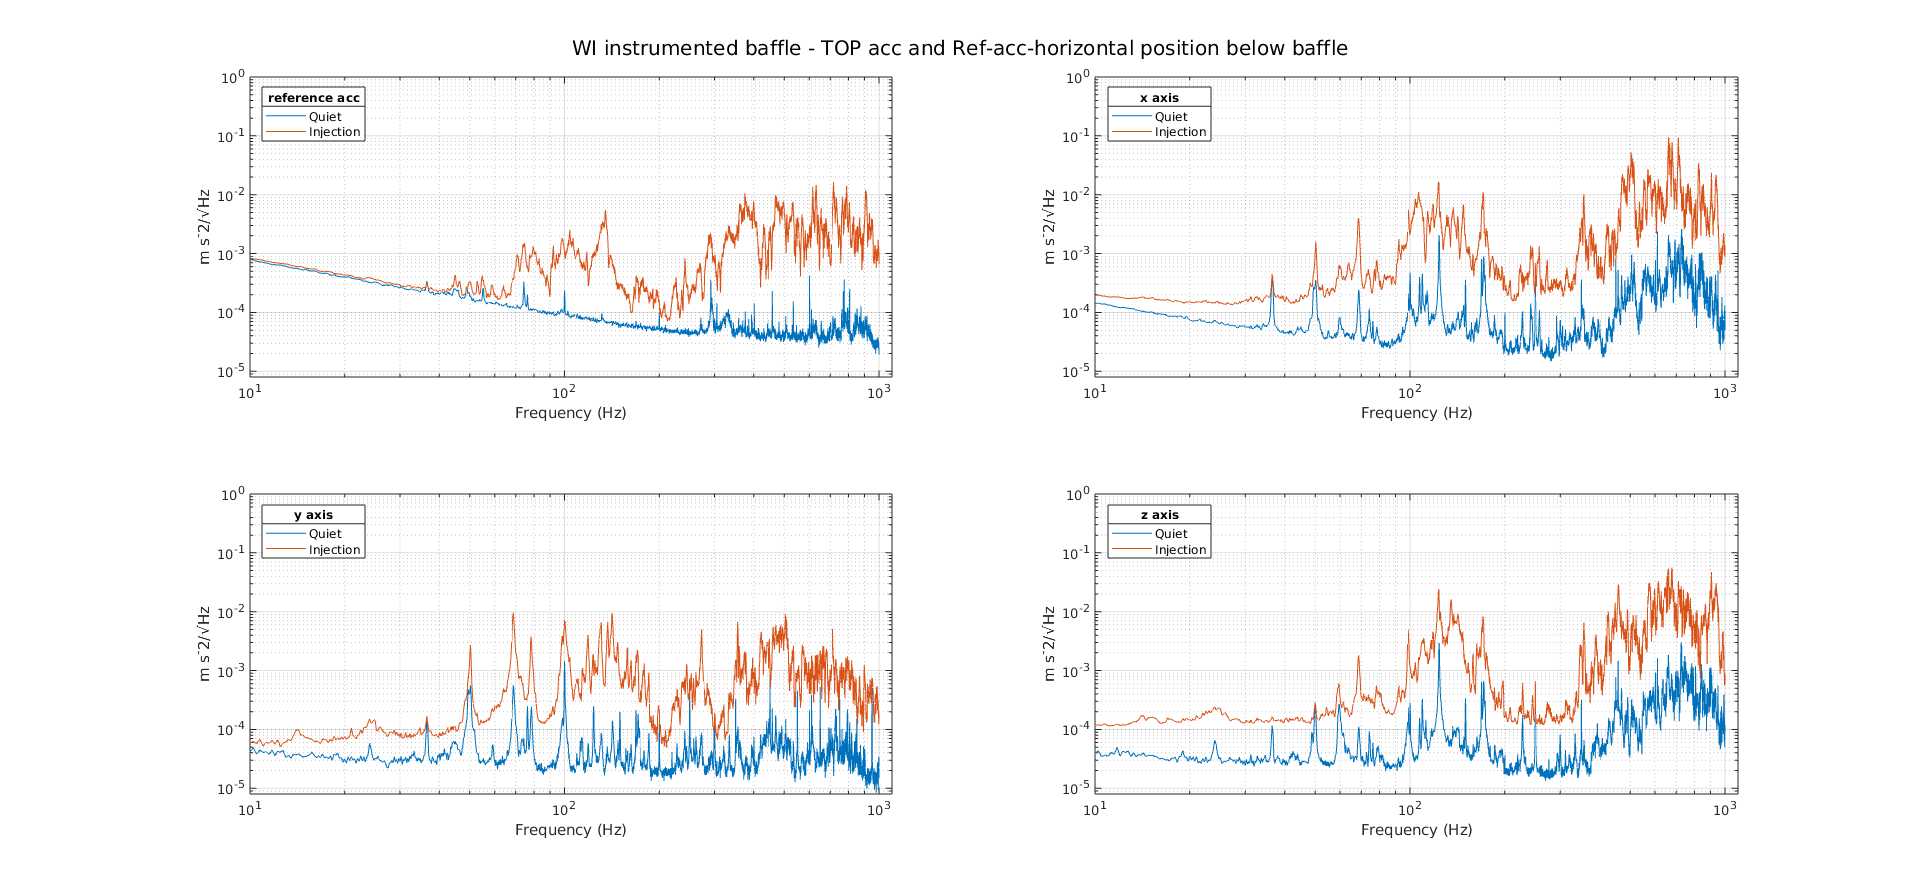
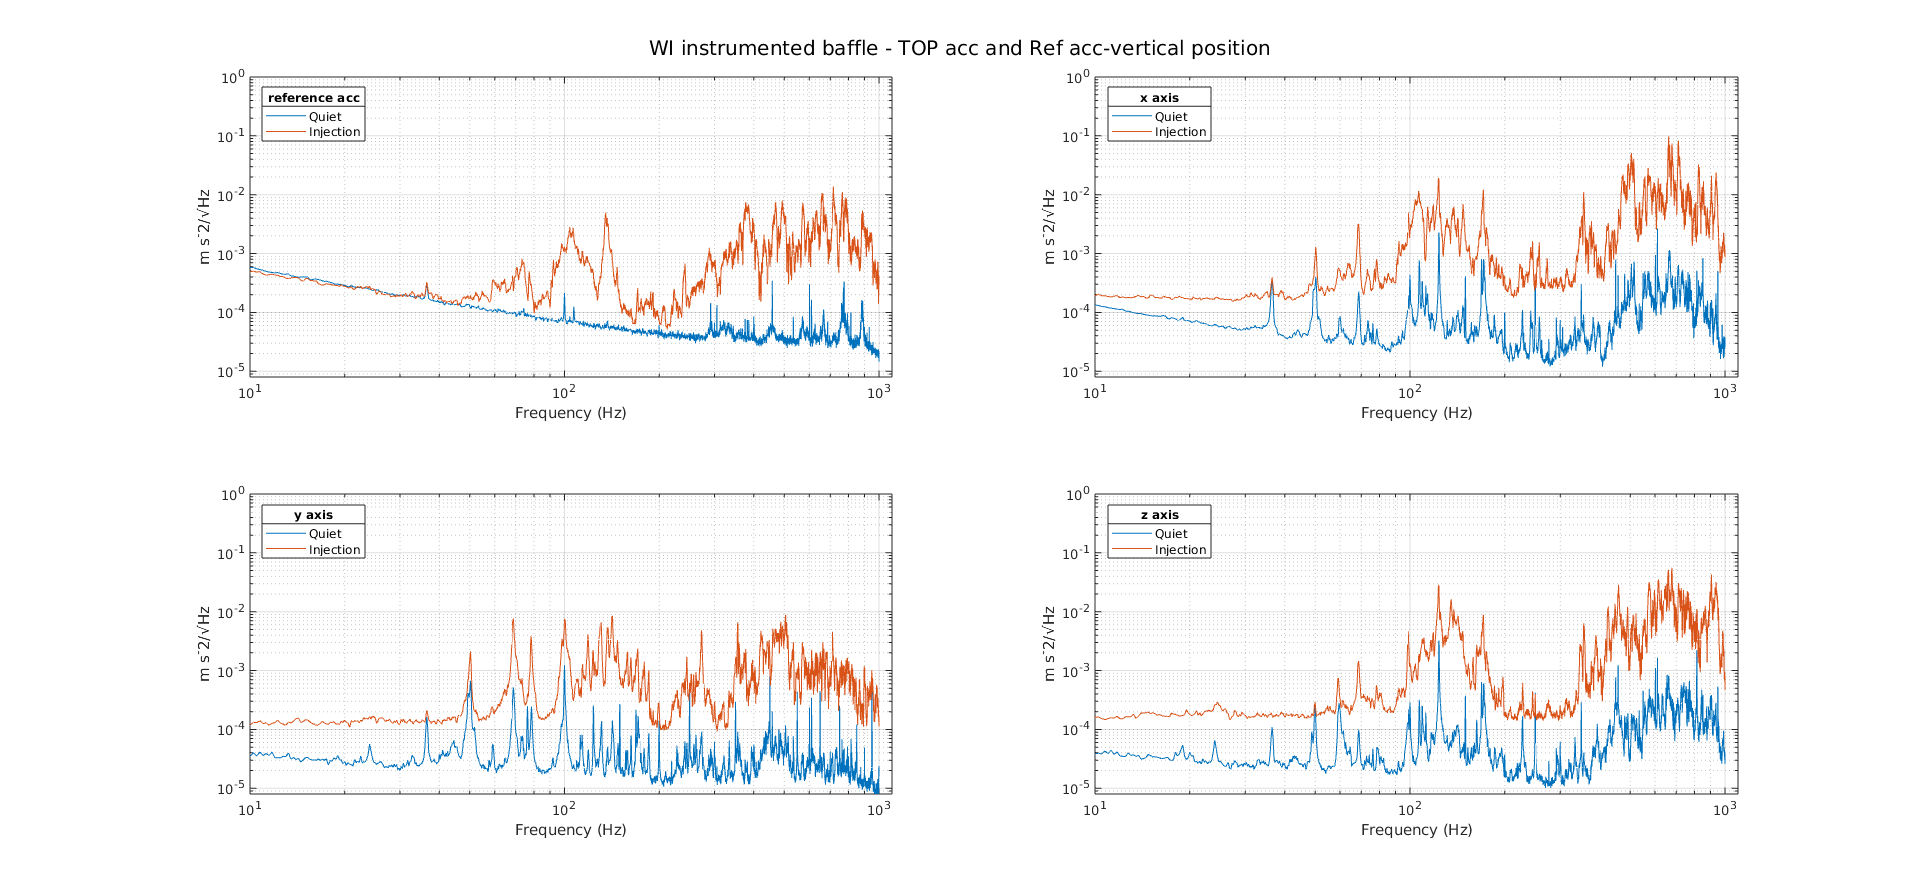
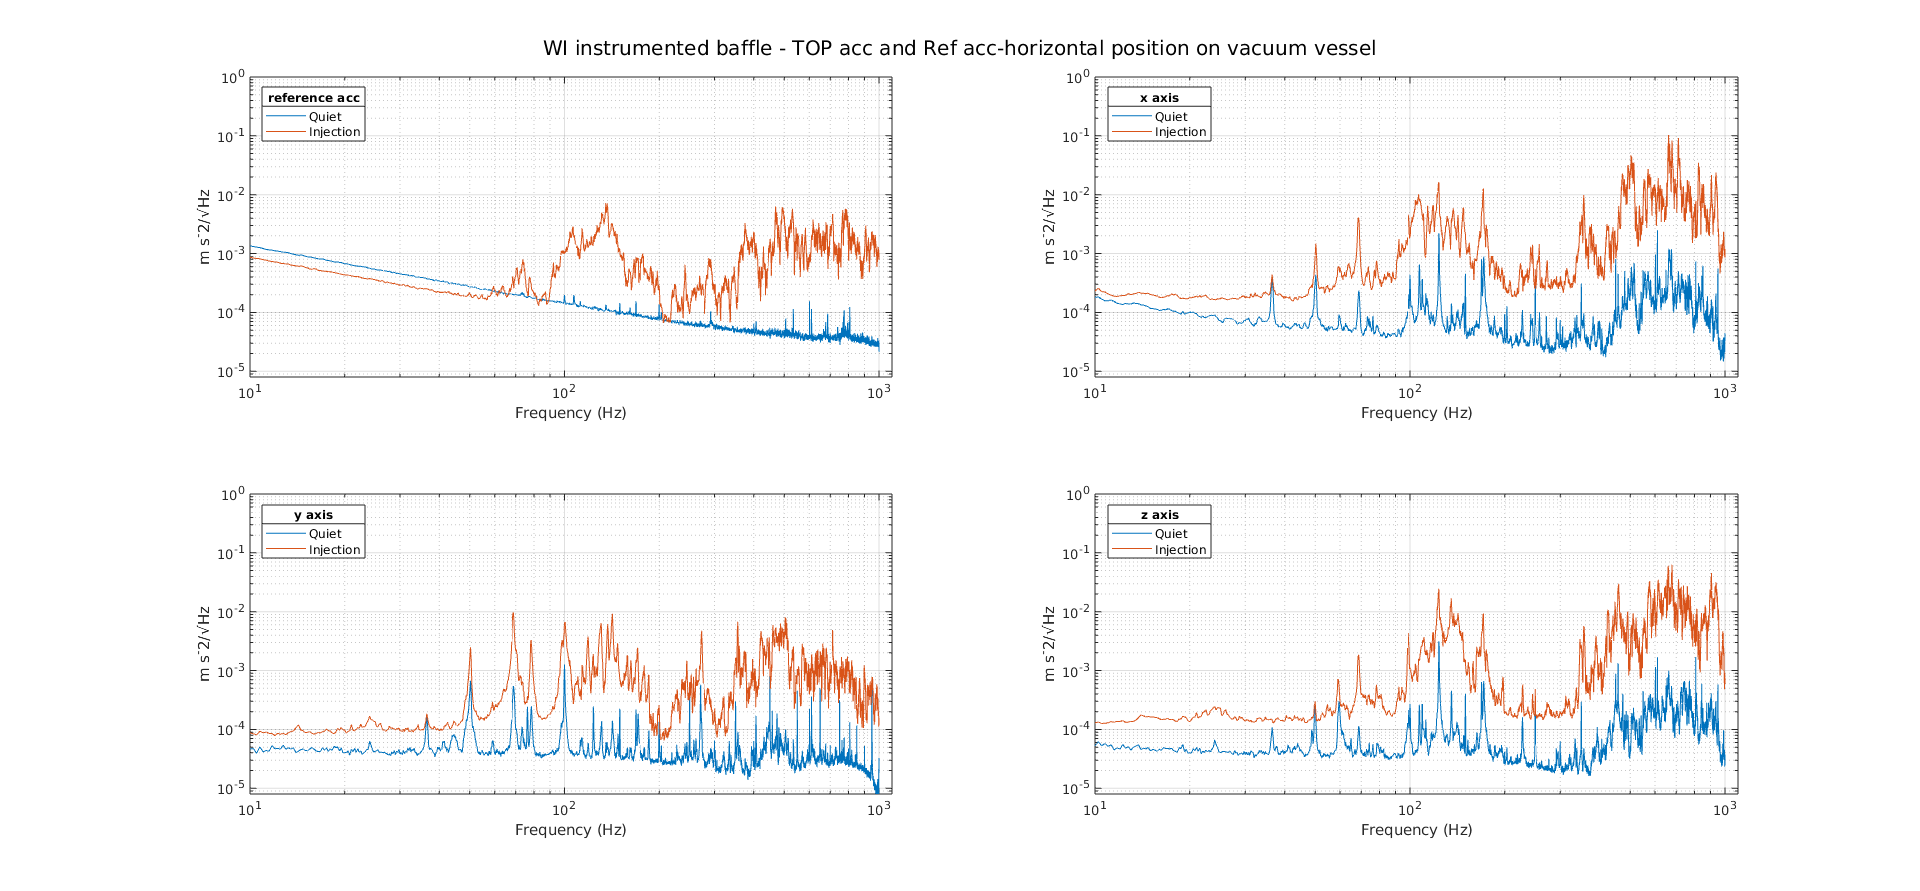
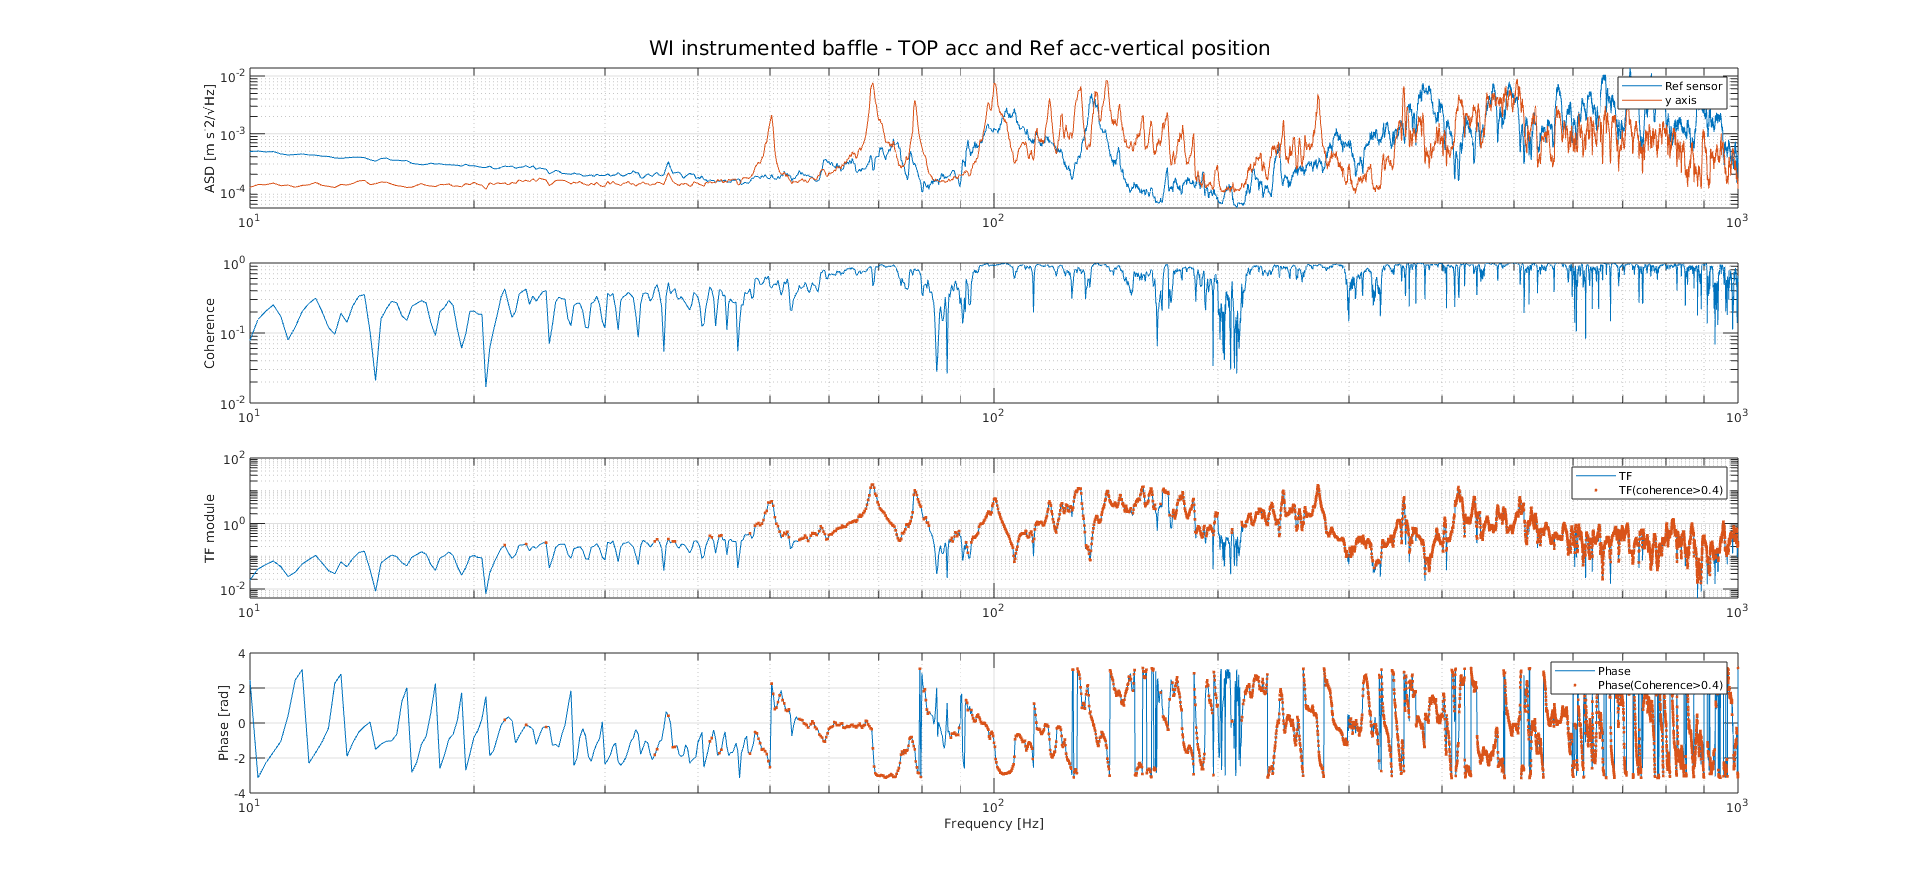
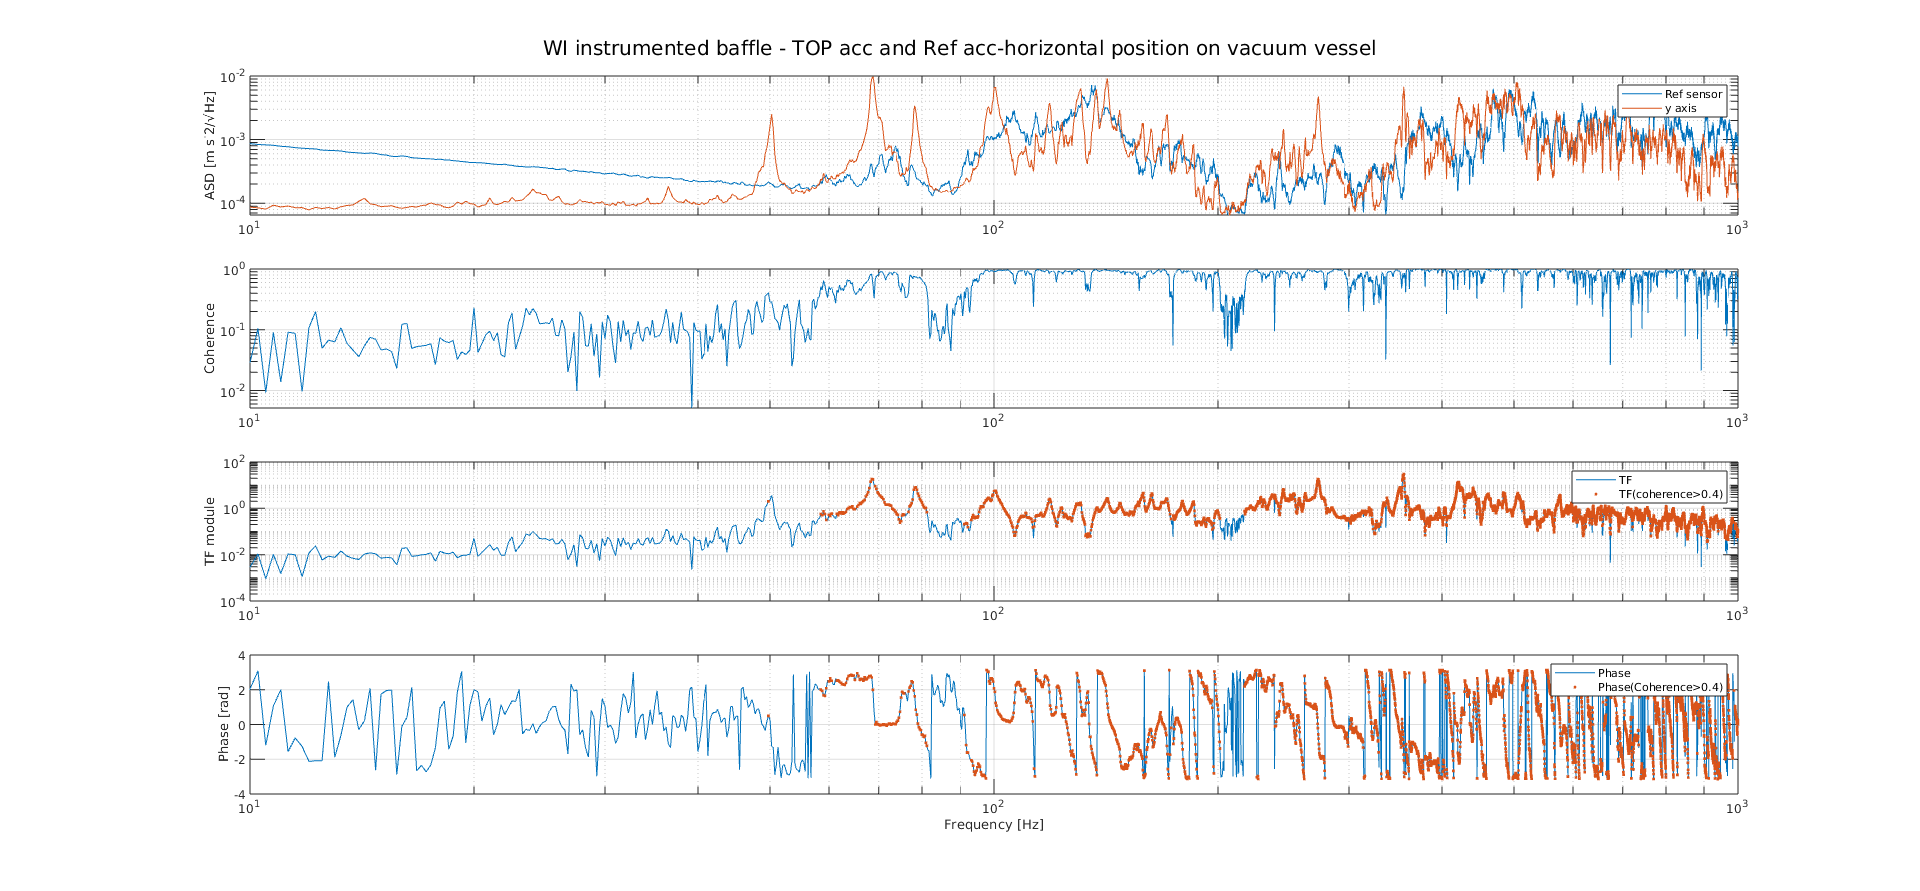
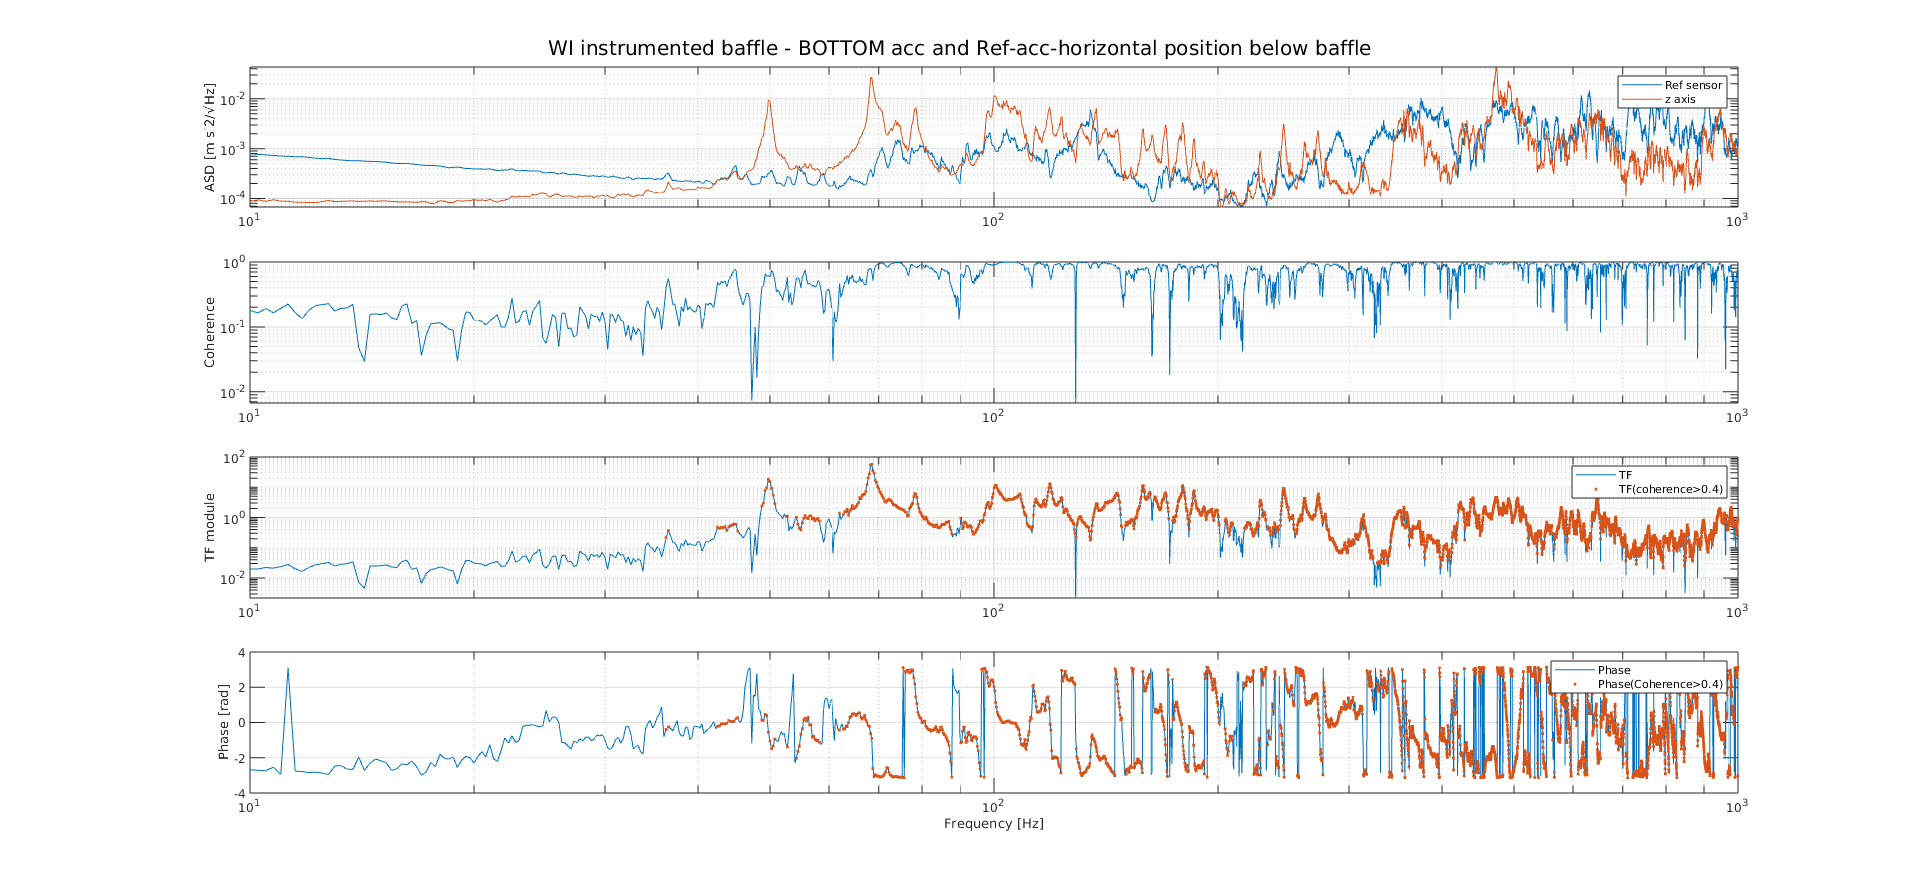
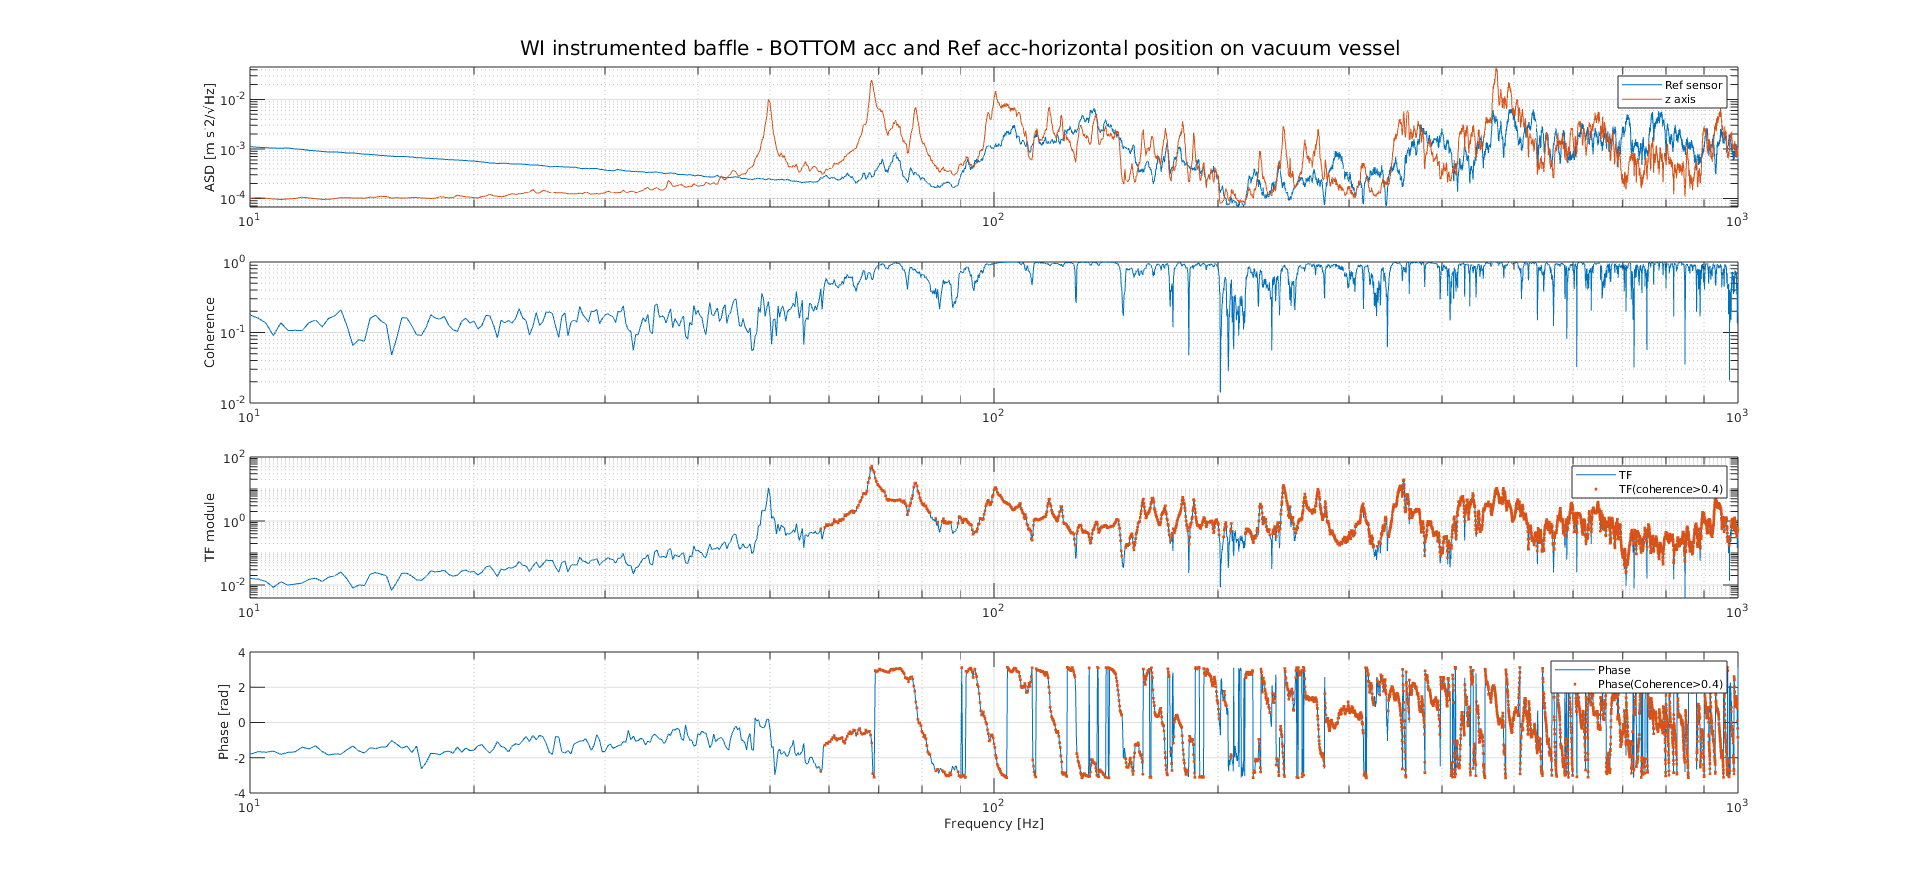
In this entry, we report the results of the mechanical transfer function measurements performed on the NI and WI instrumented baffles.

As a reminder, the measurement setup consisted of a triaxial accelerometer installed on the baffle in two different positions, referred to as TOP and BOTTOM, using a custom adapter.
A monoaxial reference accelerometer was sequentially installed in three locations: R1, horizontal position below the baffle; R2, vertical position close to the baffle; and R3, horizontal position on the vacuum vessel.

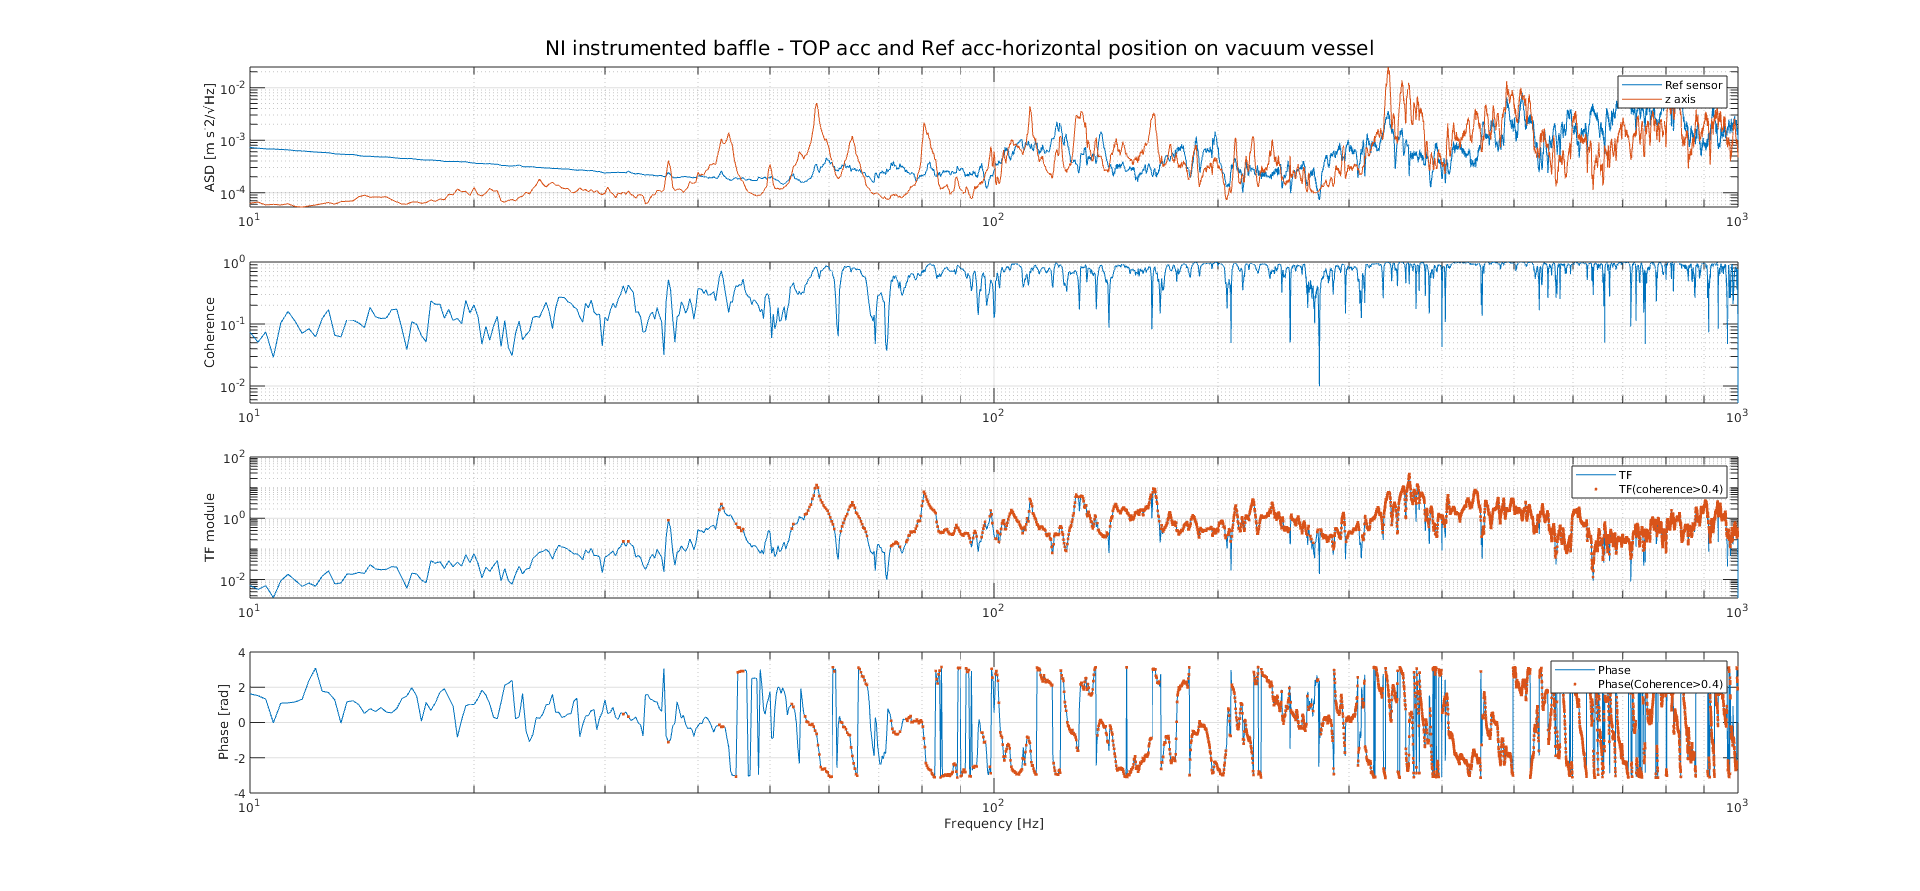
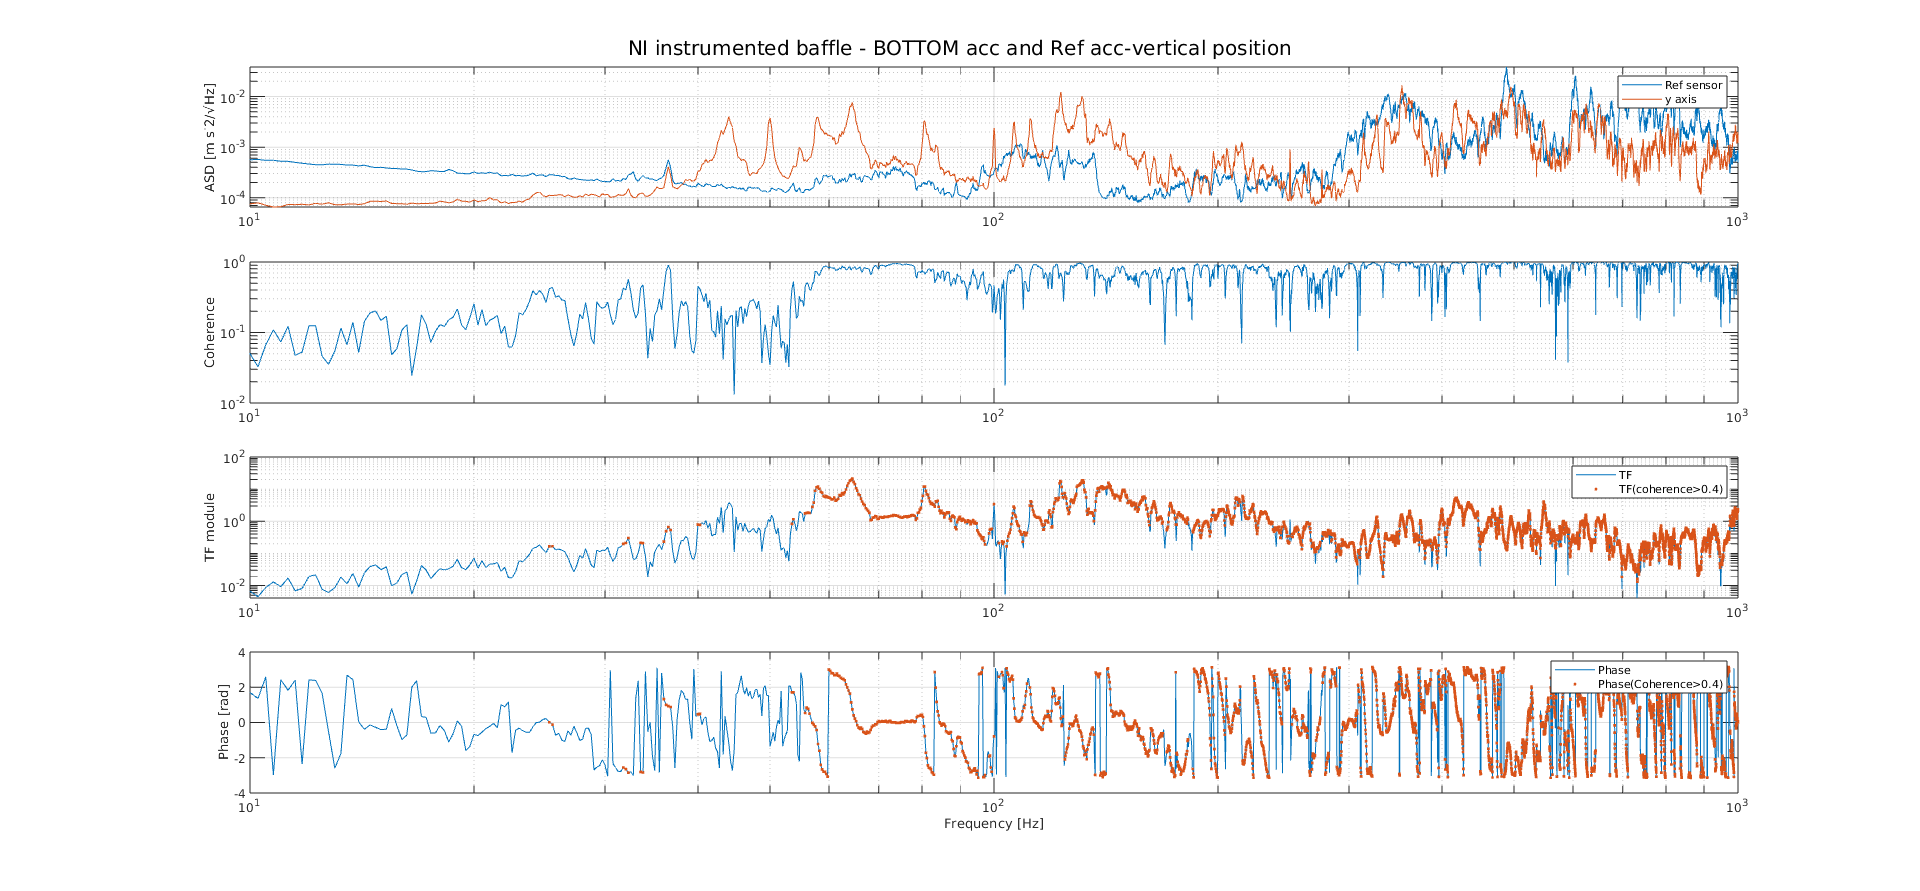
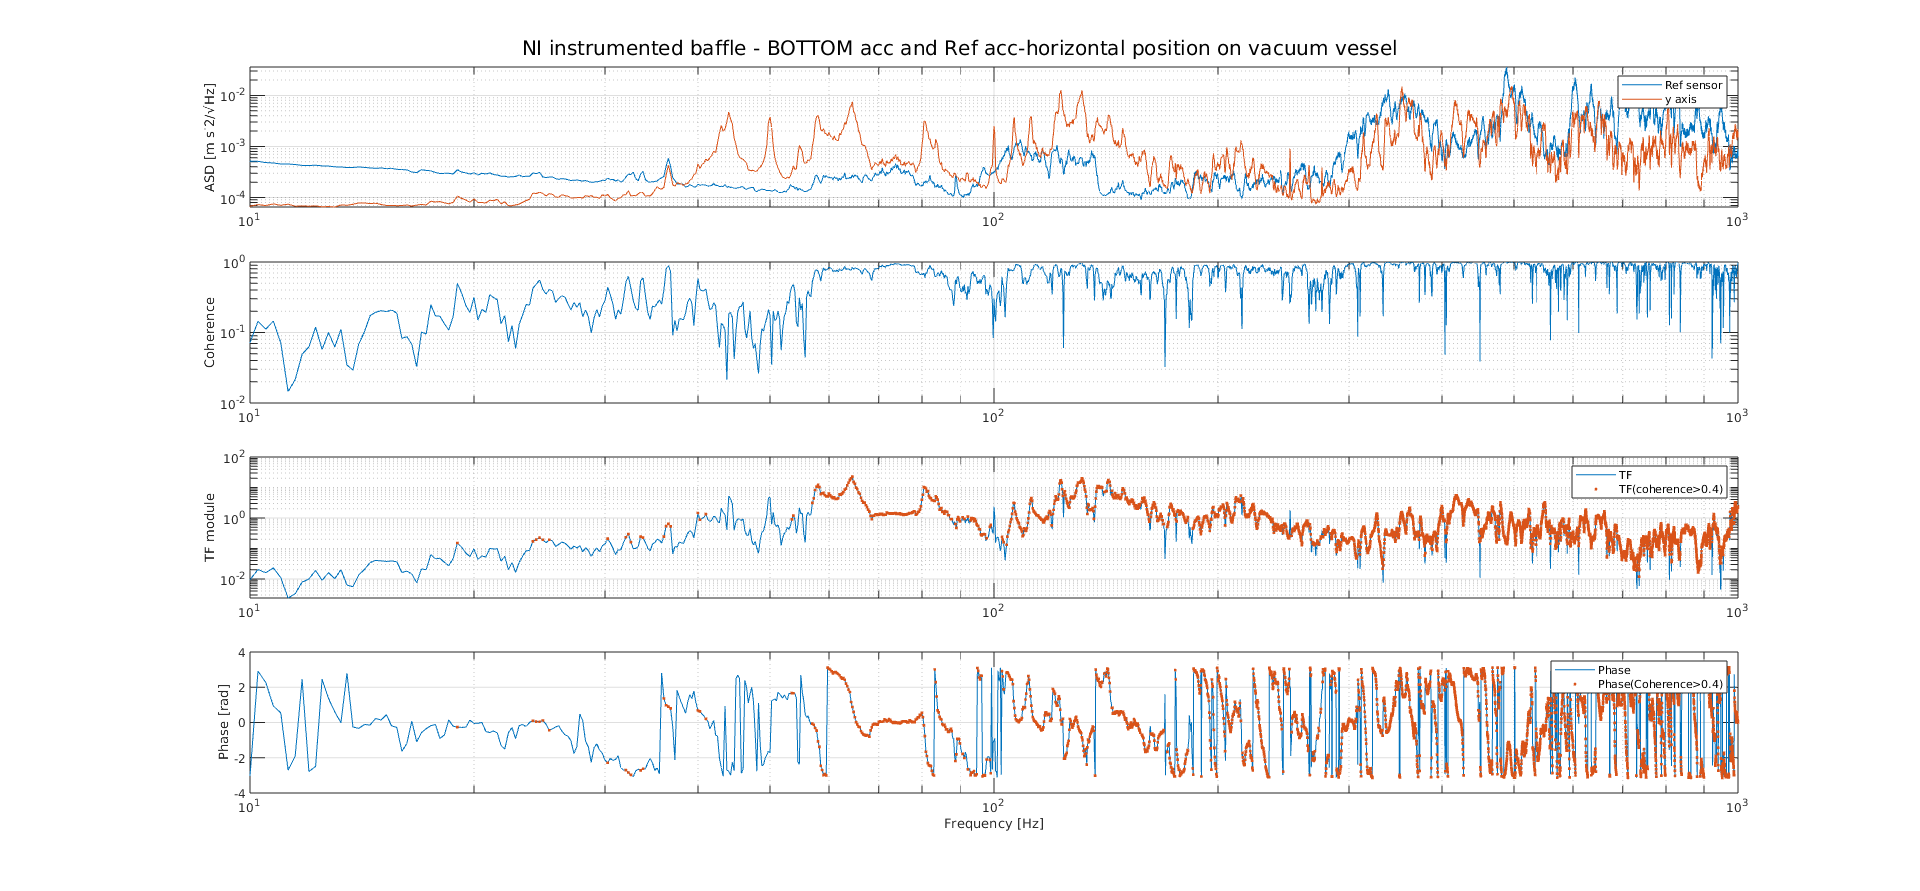
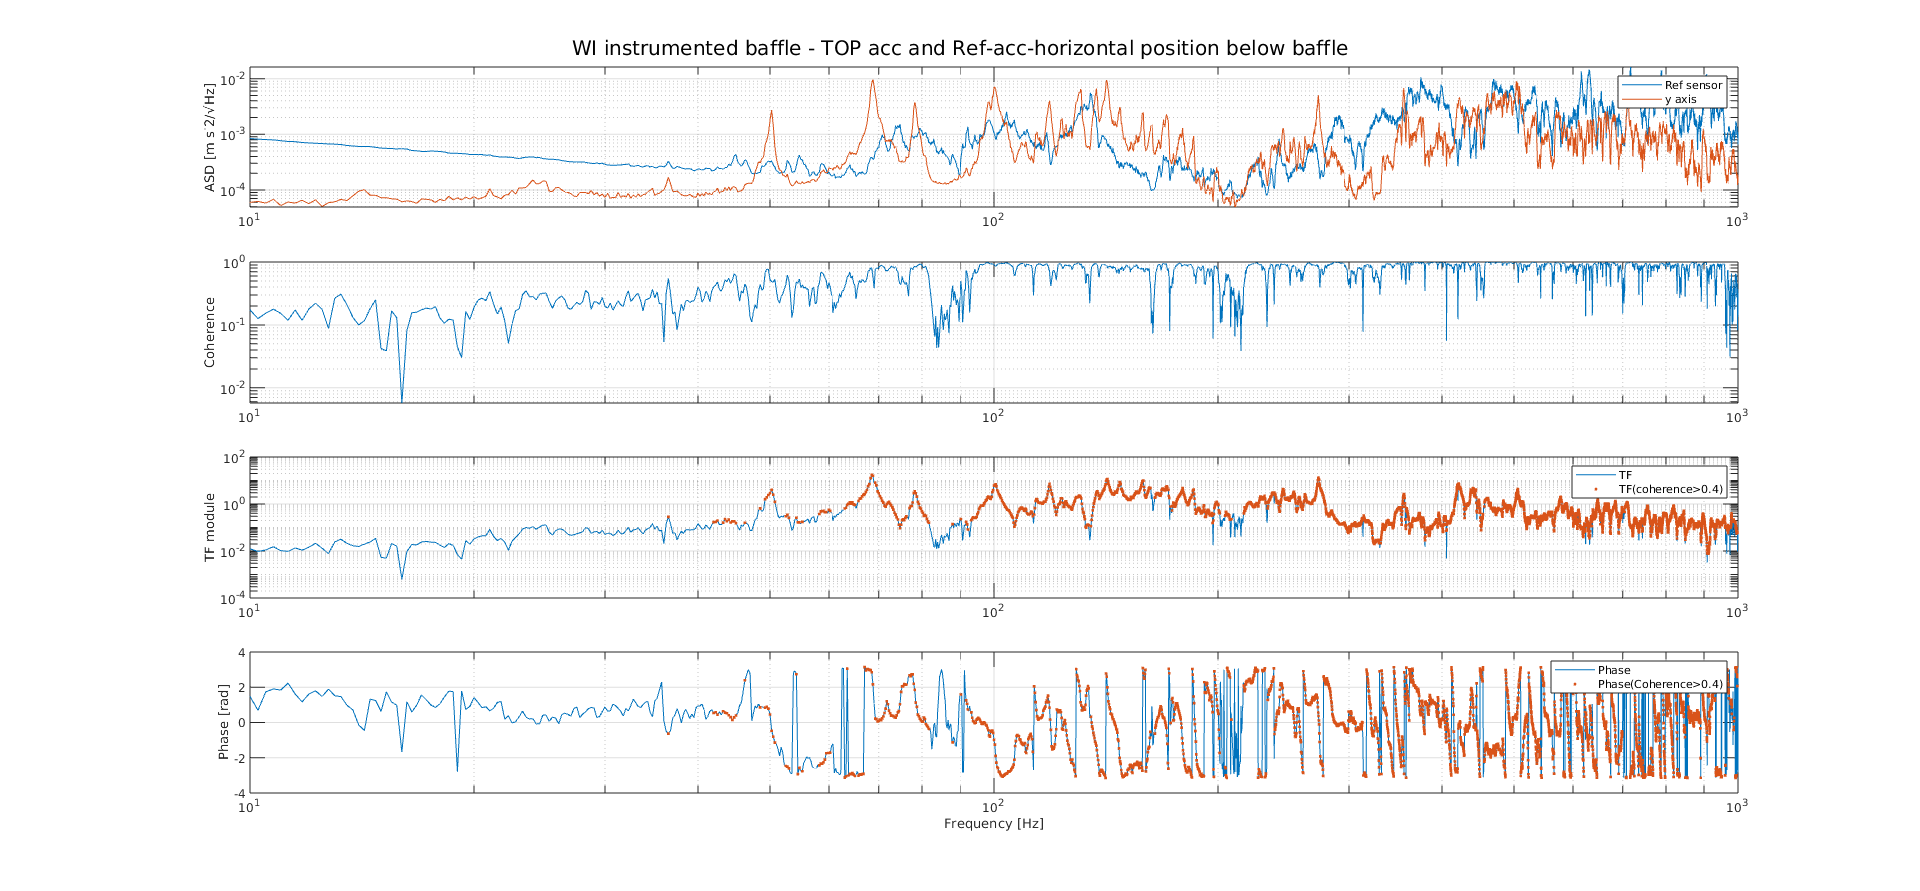
Due to the threaded mounting of the triaxial accelerometer, the final sensor orientation was slightly different between the TOP and BOTTOM installations and was therefore not perfectly aligned with the nominal vertical-horizontal reference frame. The only direction that can be directly compared between all measurements is the sensor axis aligned with the adapter, which is approximately perpendicular to the baffle surface:

  • NI instrumented baffle
    •  top acc position--> z-axis
    • bottom acc position--> y-axis
  • WI instrumented baffle
    • top acc position--> y-axis
    • bottom acc position-->z-axis 

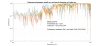
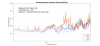
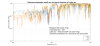
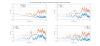
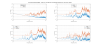
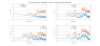
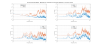
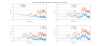
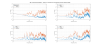
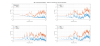
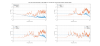
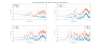
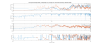
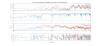
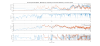
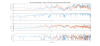
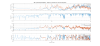
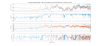
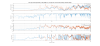
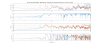
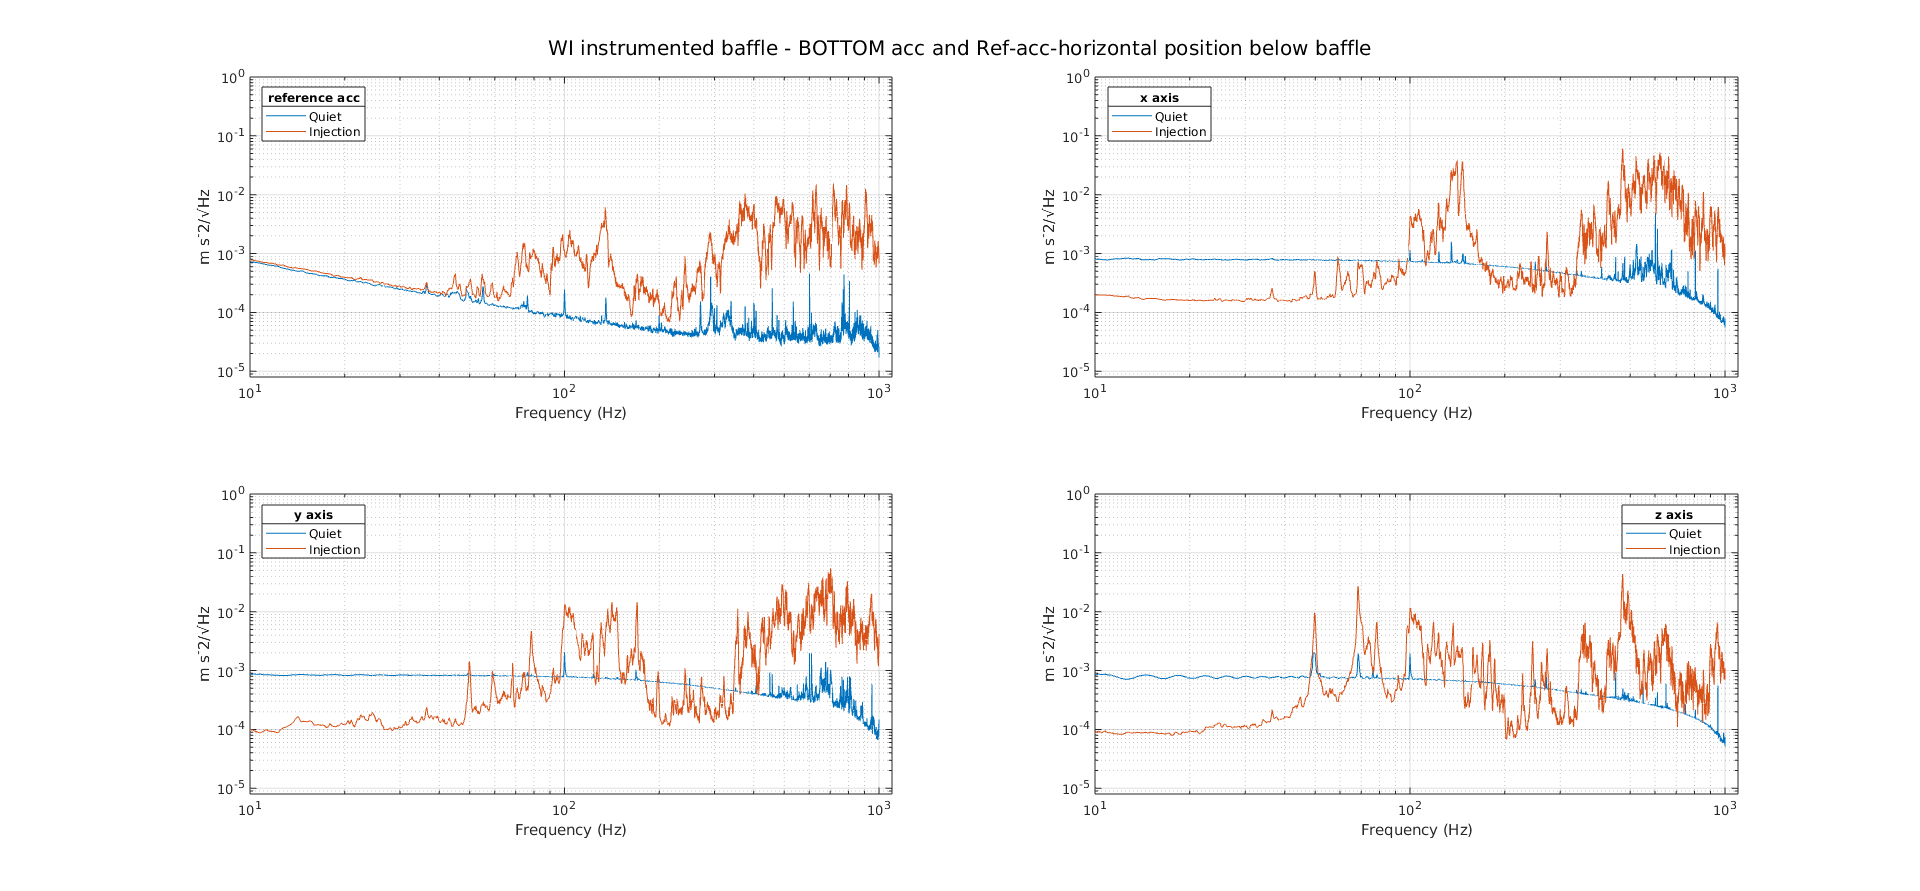
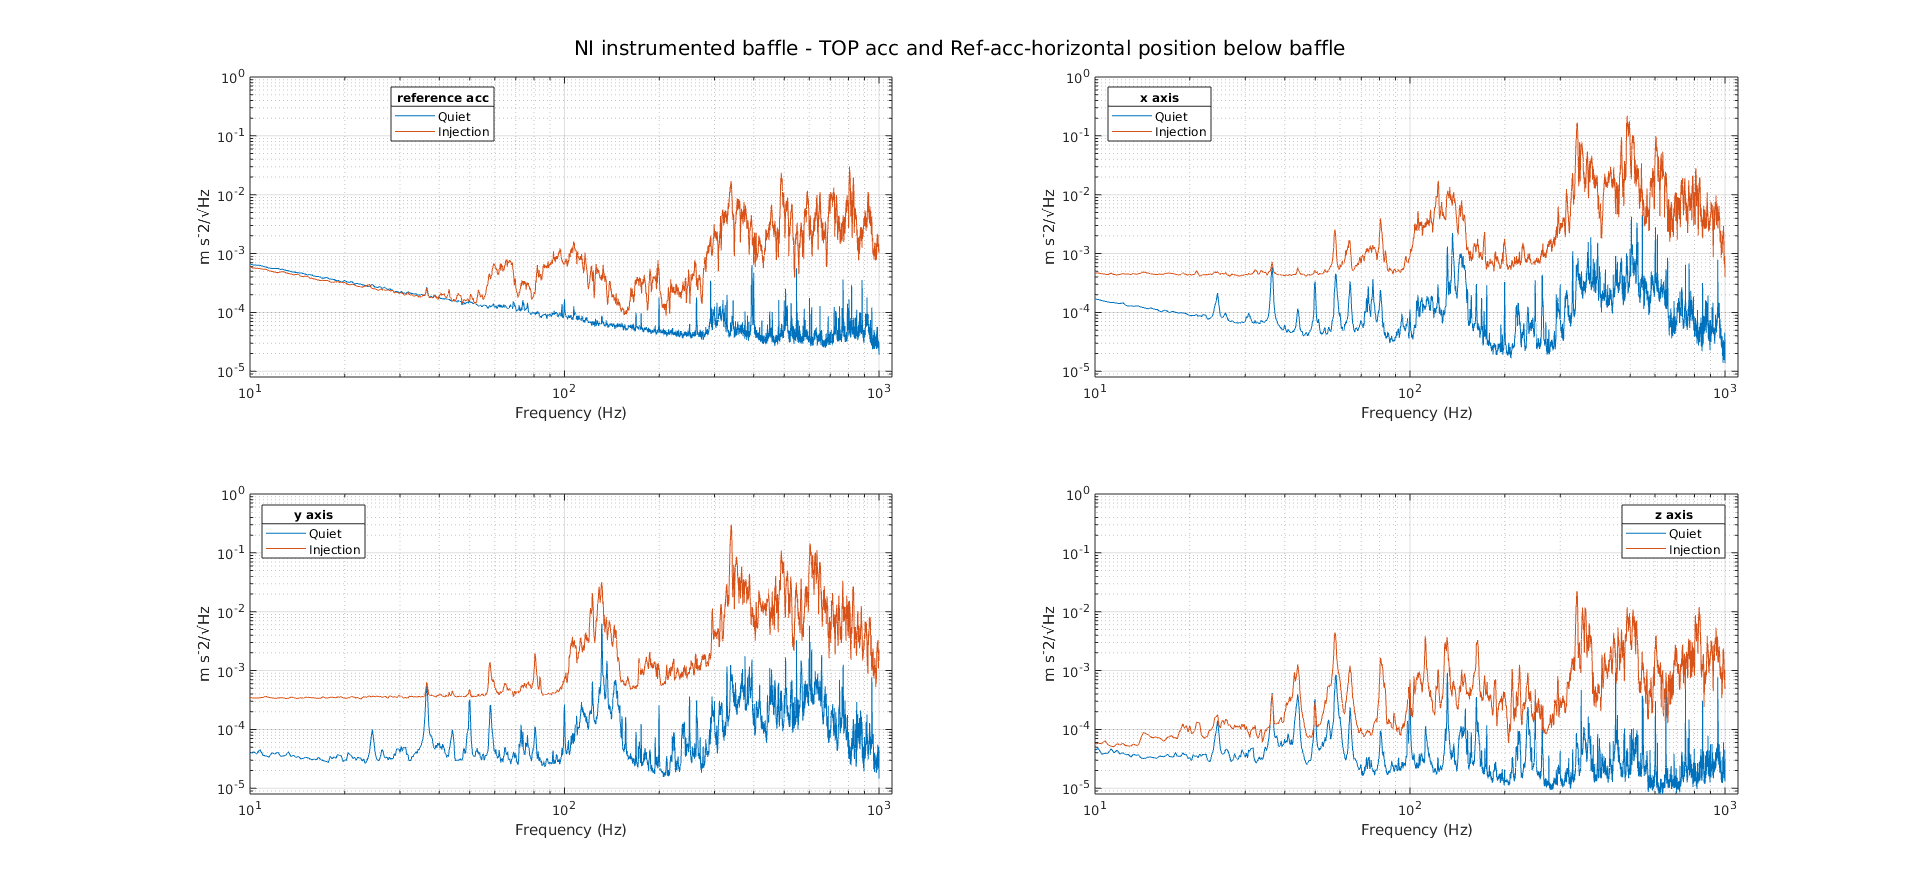
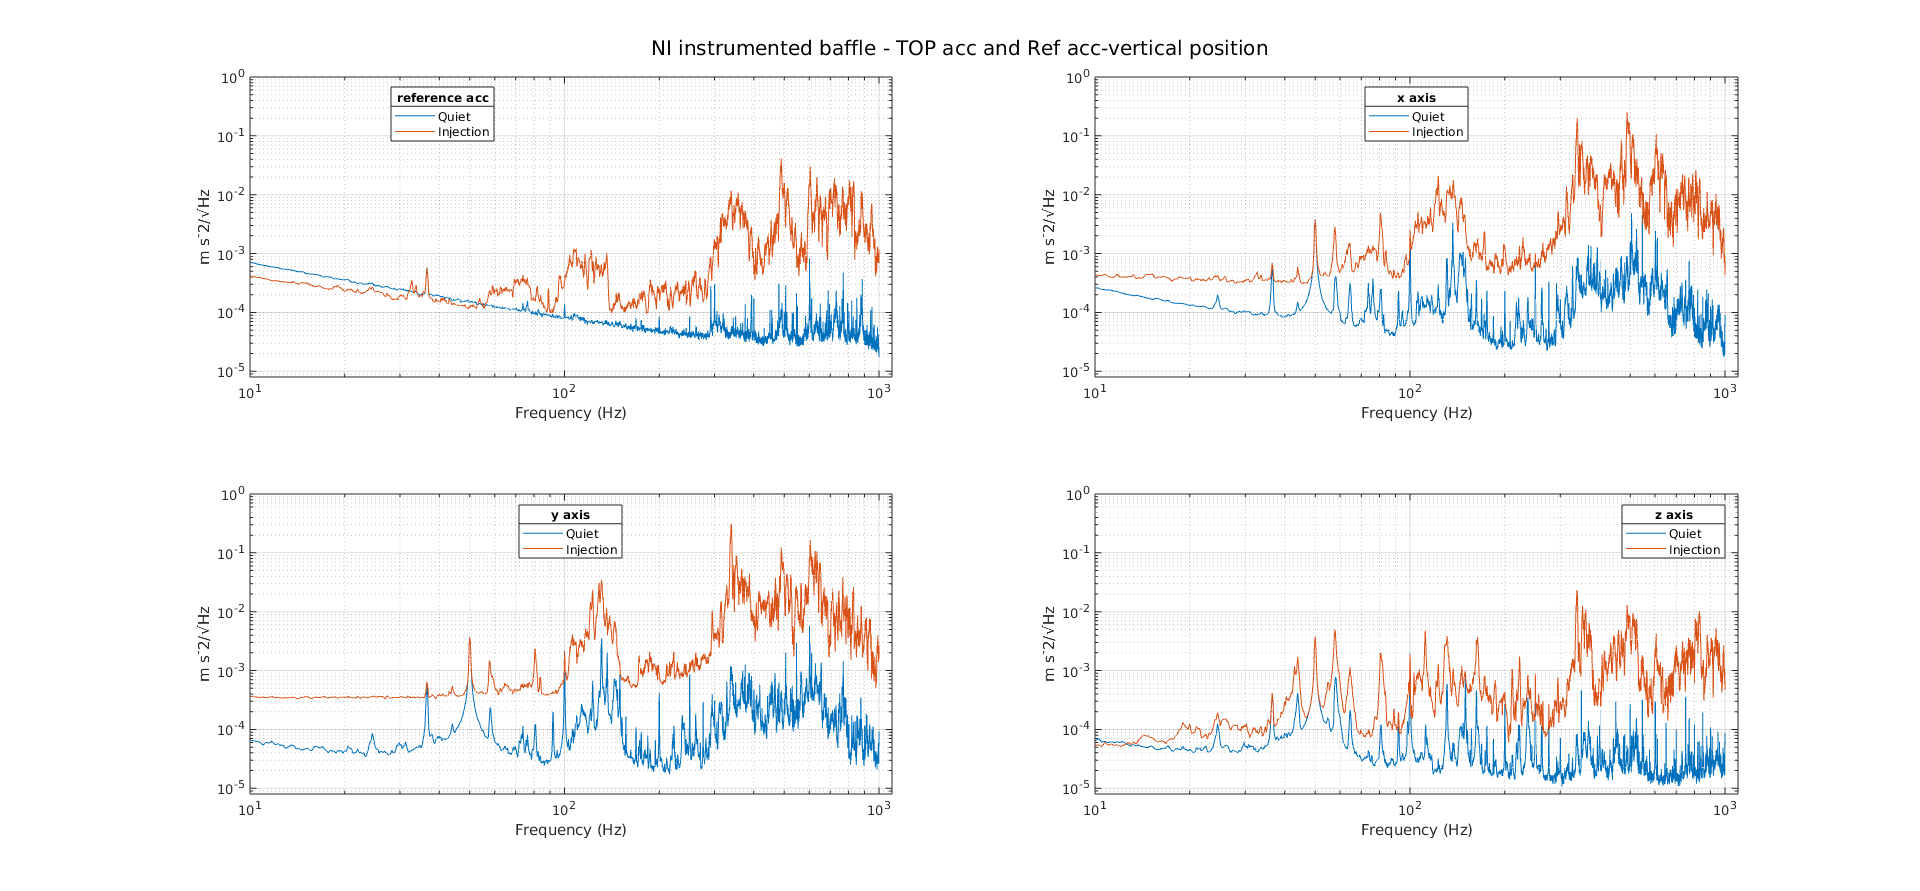
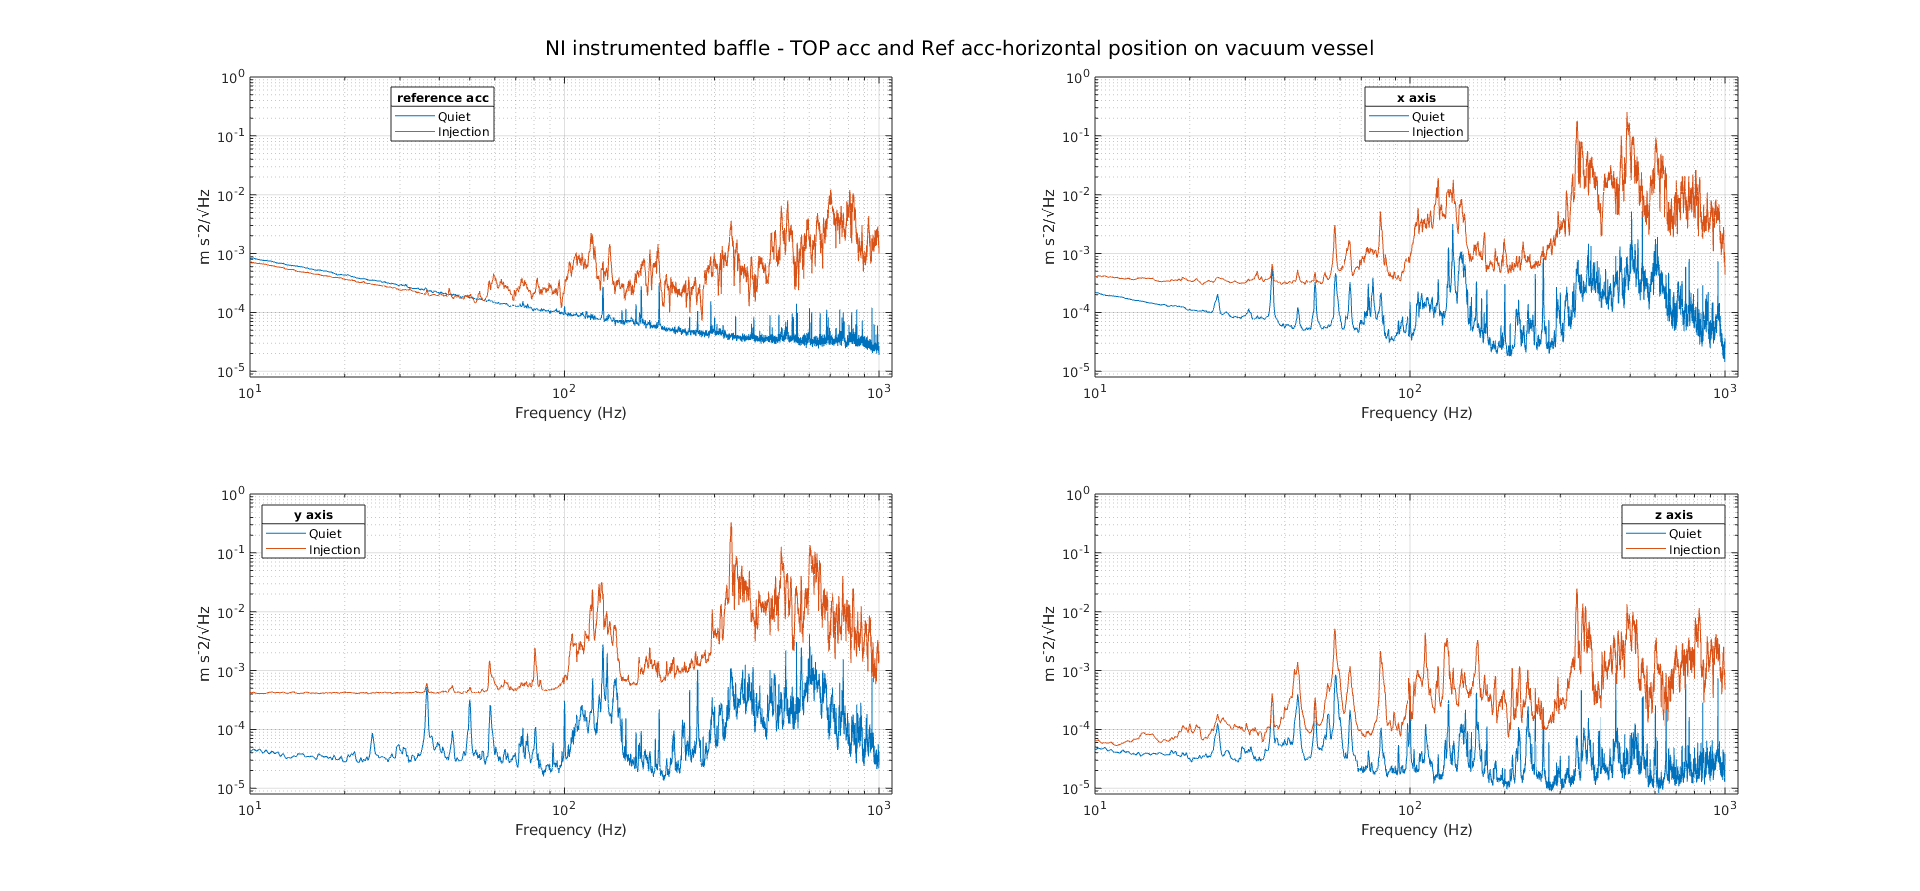
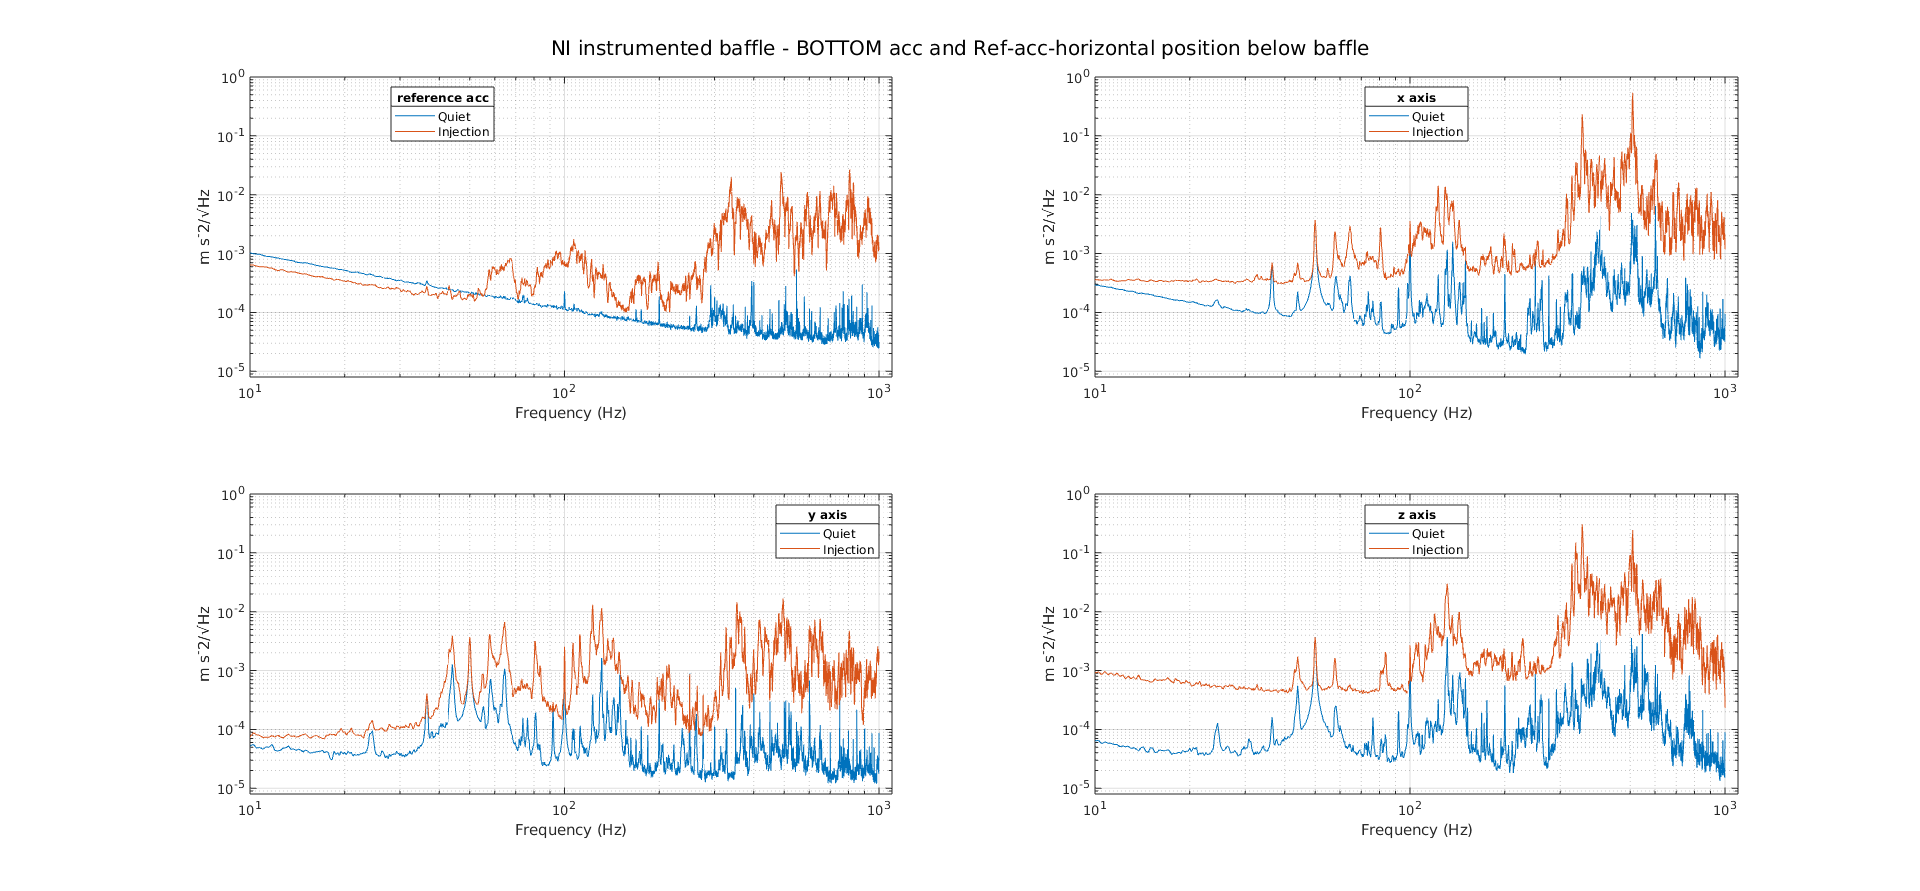
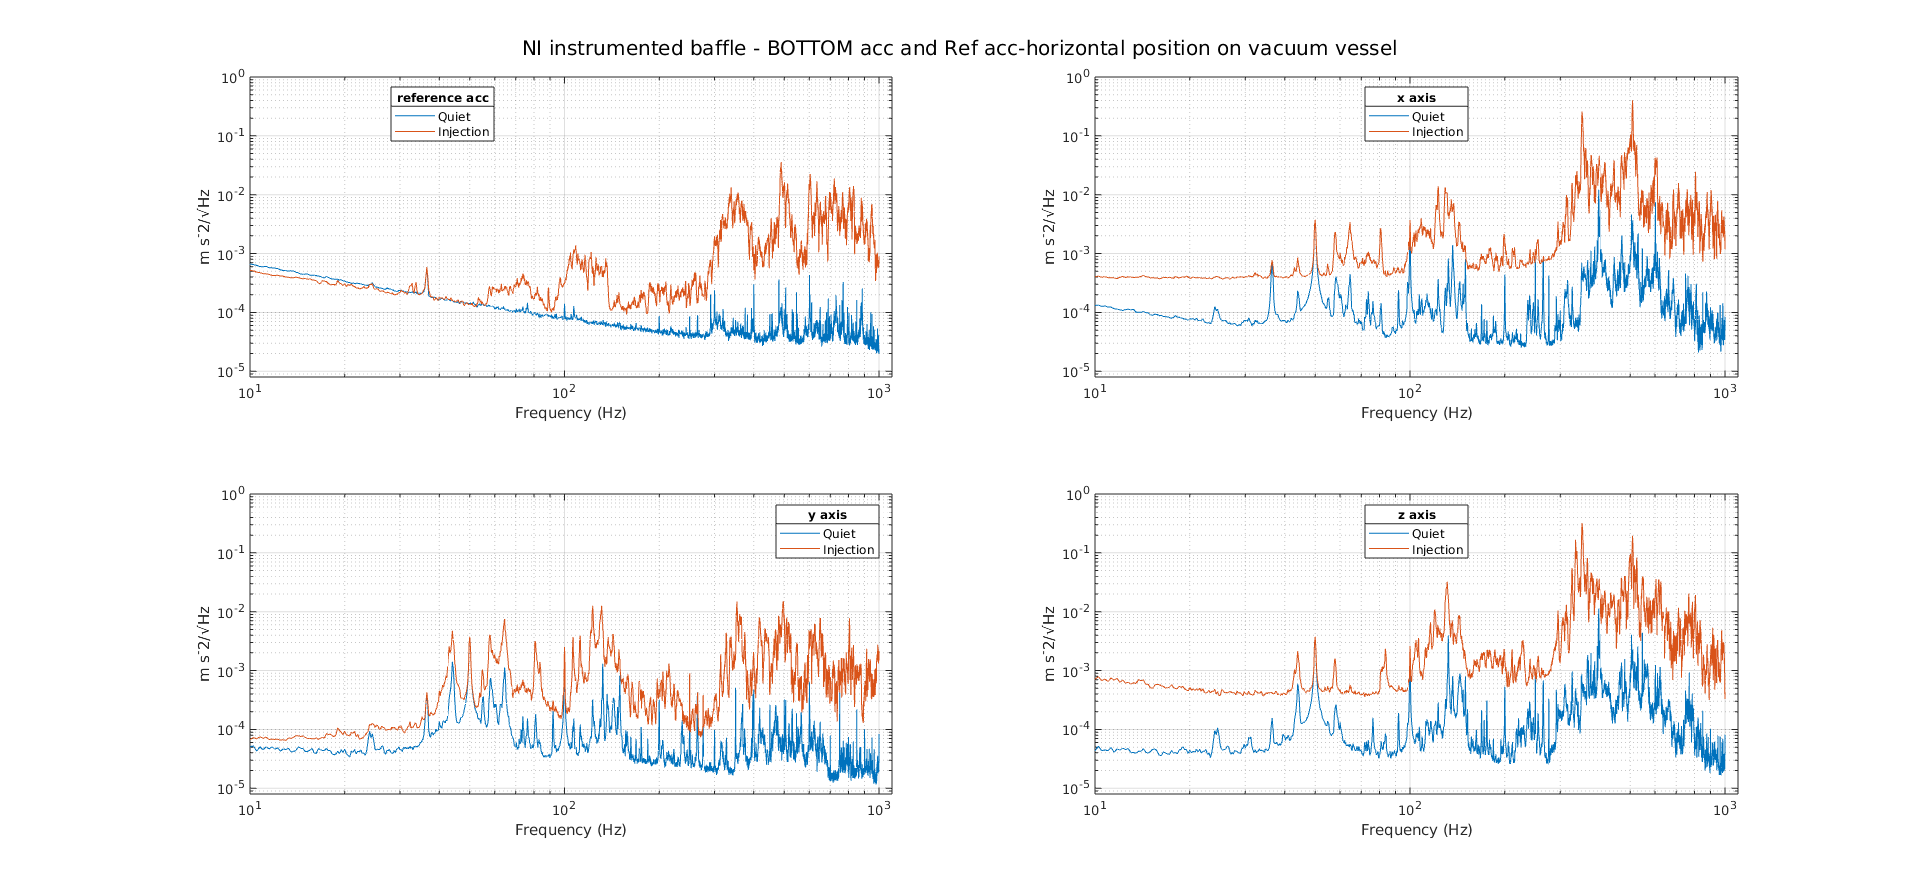
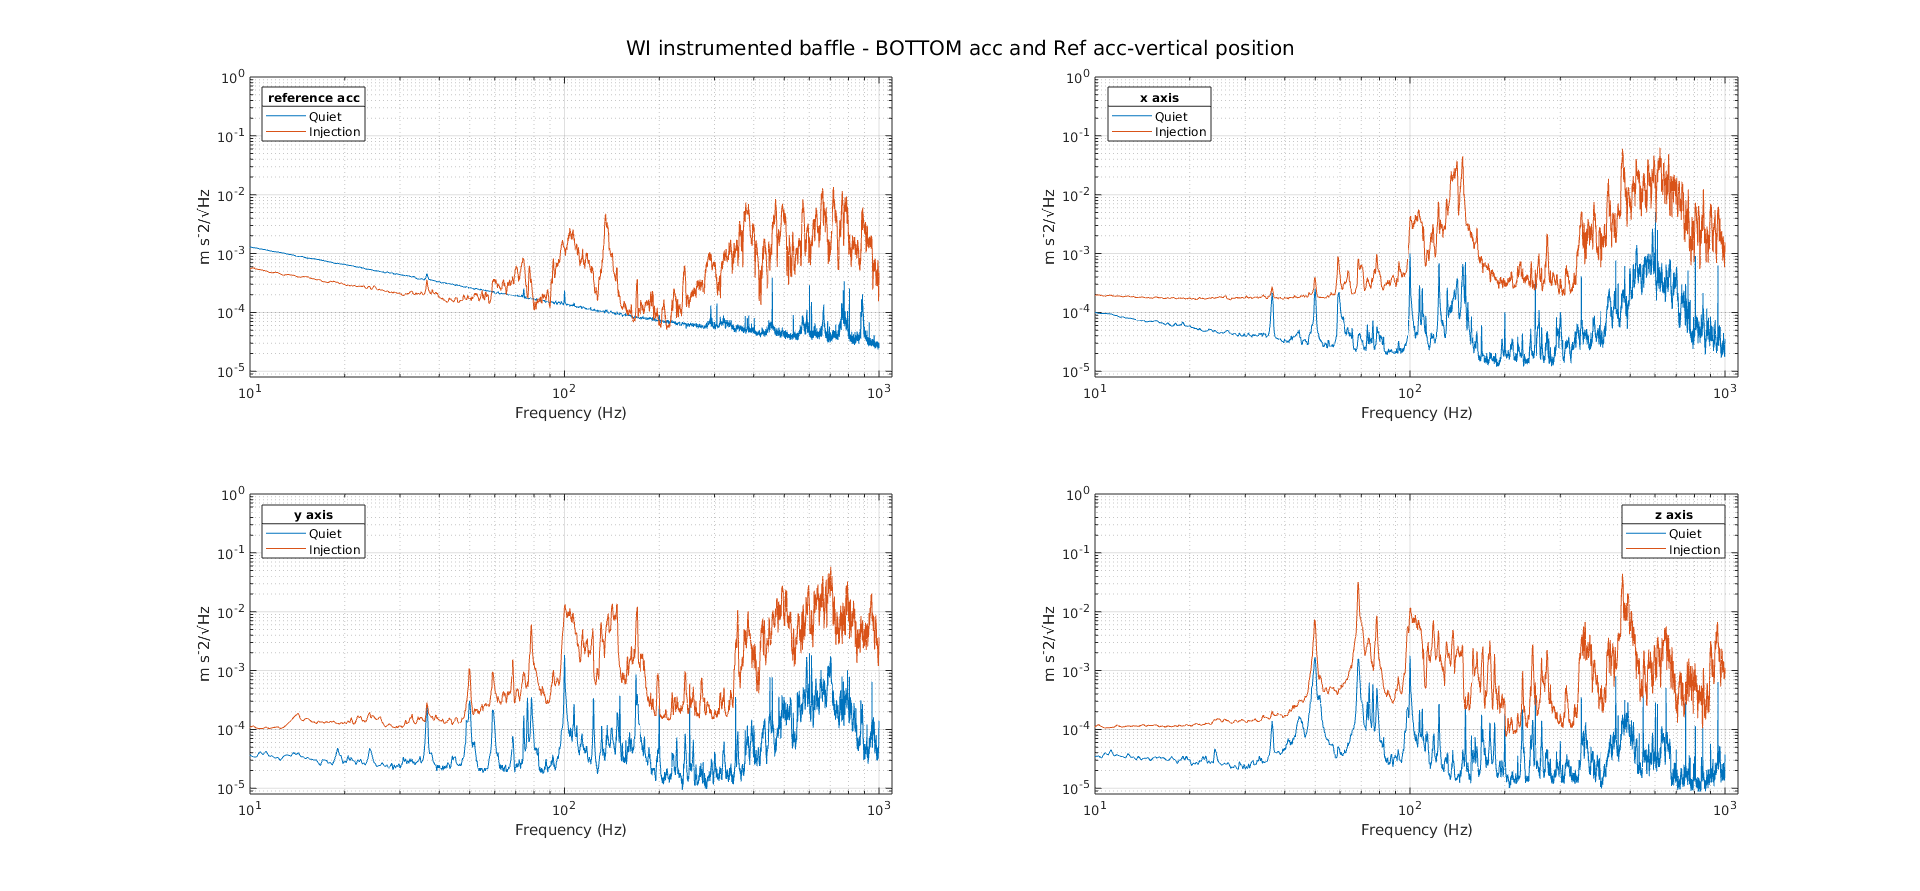
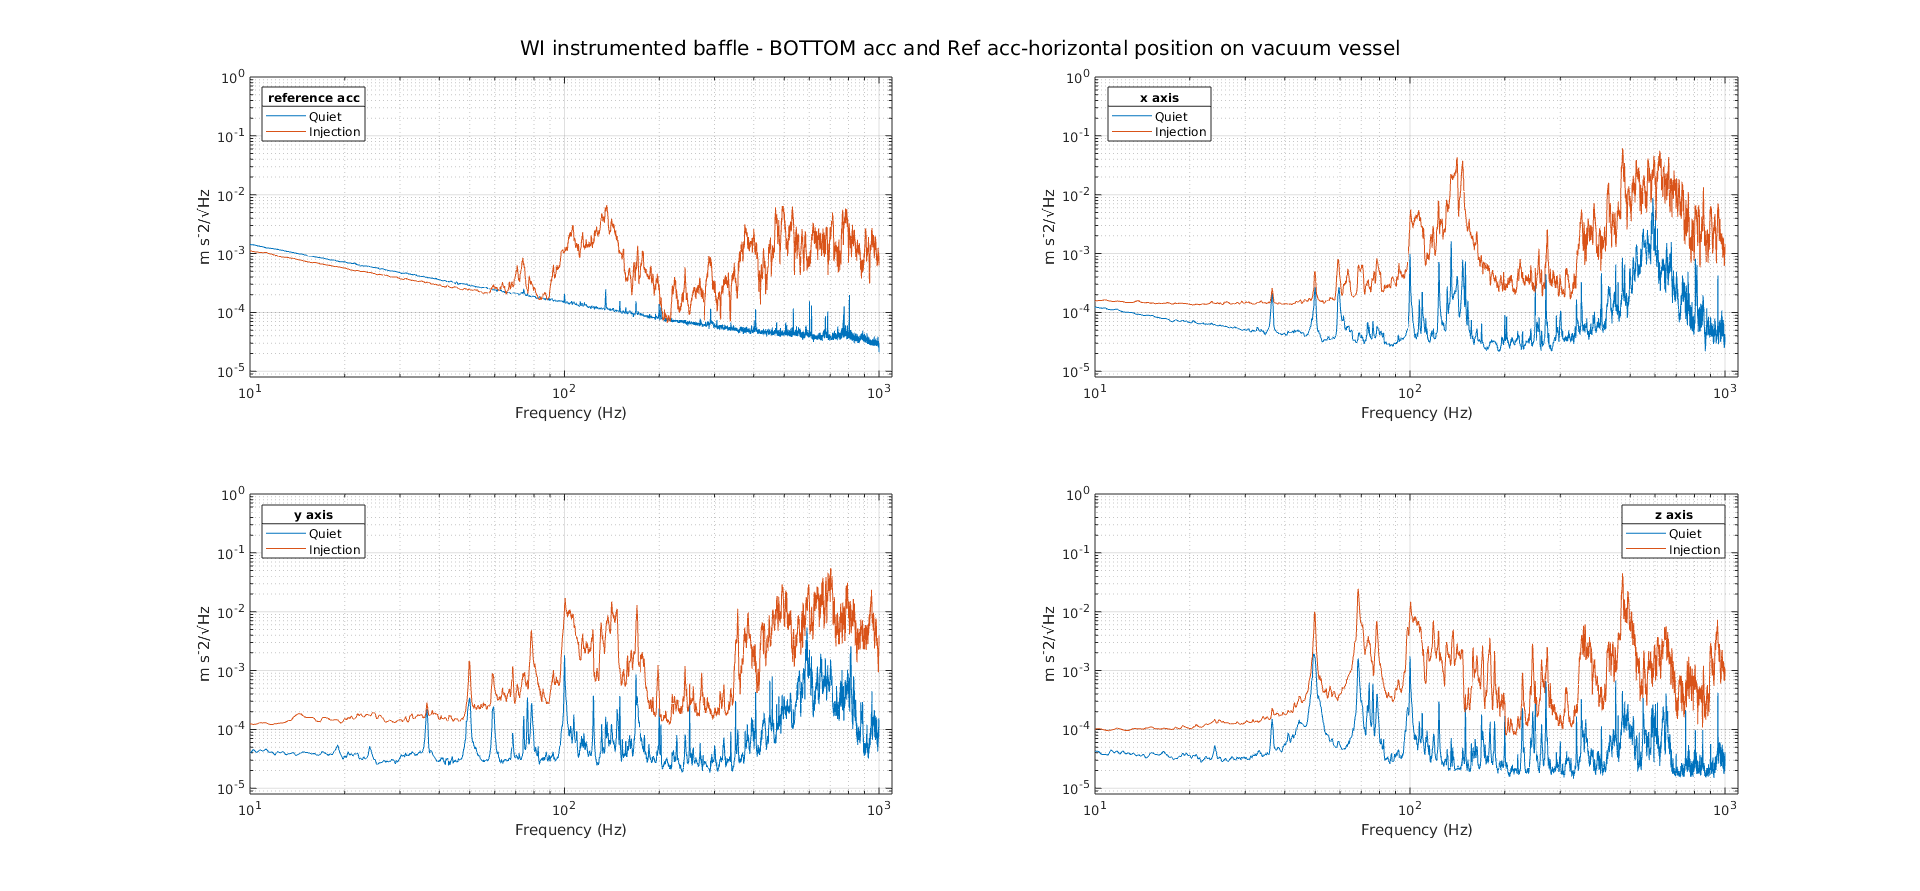
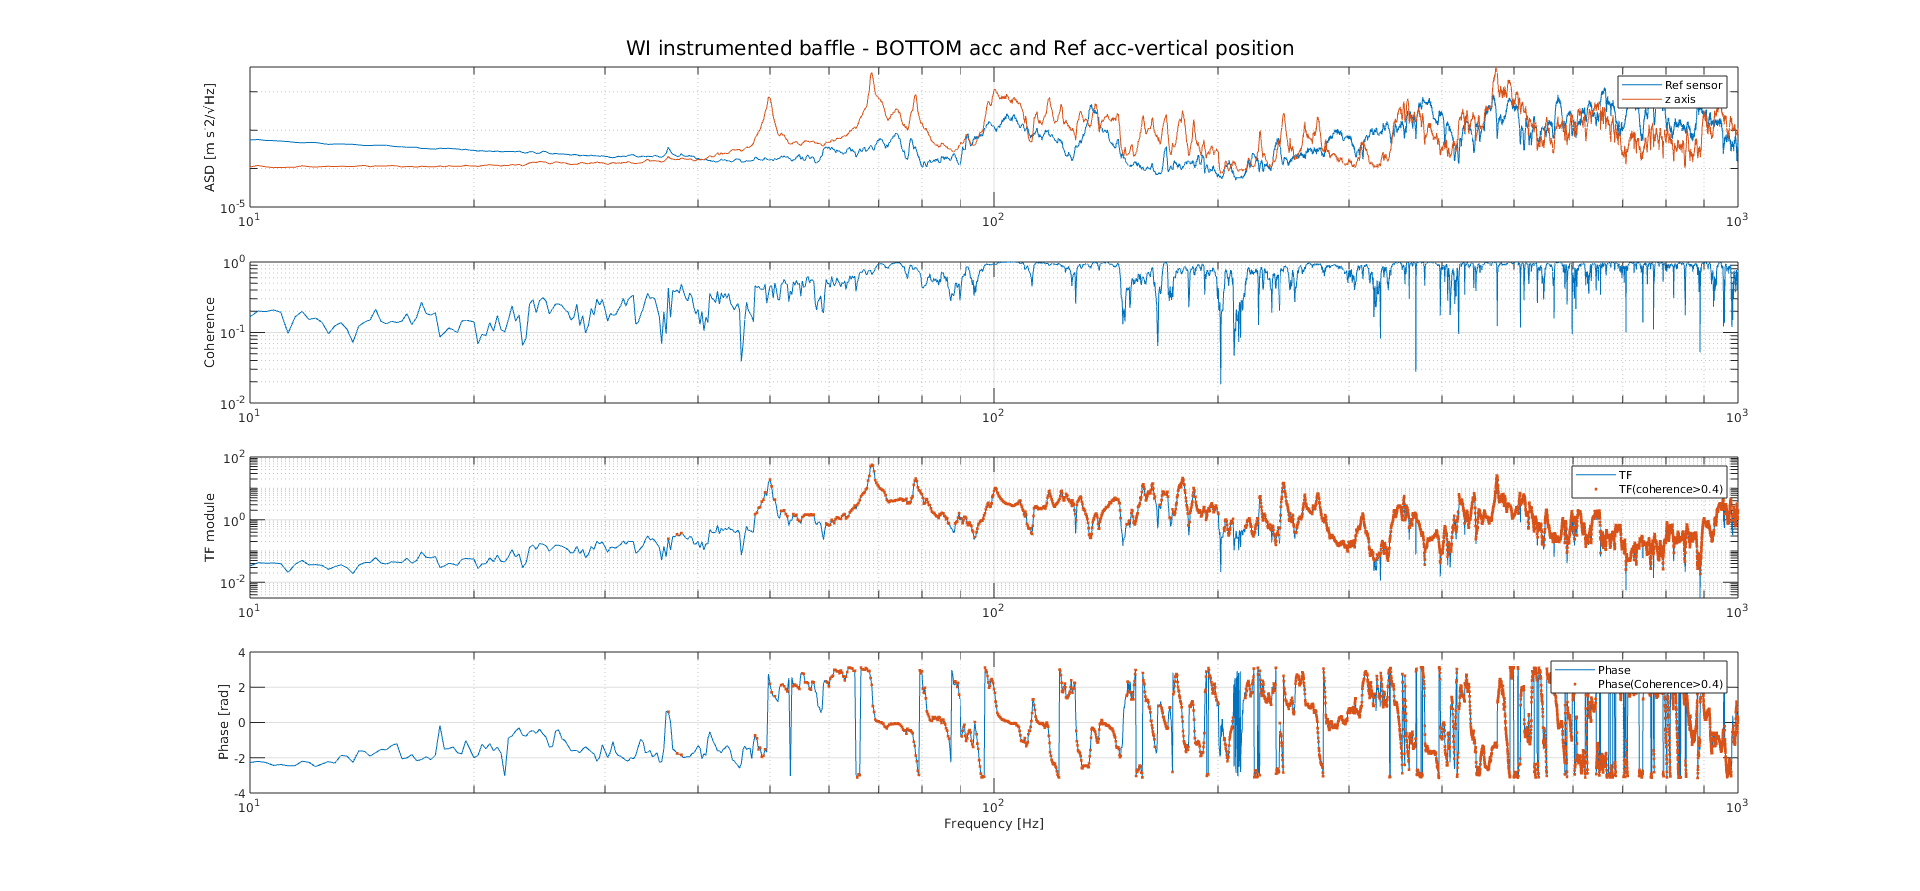
Figures 1–12 show the comparison between the quiet and injection spectra for all the investigated configurations. The shaker excitation significantly increases the vibration level over the ambient noise background, clearly revealing the frequency bands where the mechanical resonances of the instrumented baffles are excited.
A transient is visible in the quiet acquisition of the WI BOTTOM configuration with the reference accelerometer installed below the baffle (R1), Figure 10. Despite the increased background level, the injected signal remains clearly distinguishable and does not affect the estimation of the transfer functions.

Based on these measurements, the mechanical transfer functions were estimated for all the investigated configurations. The complete datasets are provided in the attached ASCII files (*_transfer_function.txt).

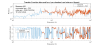
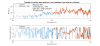
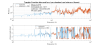
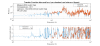
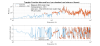
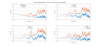
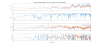
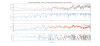
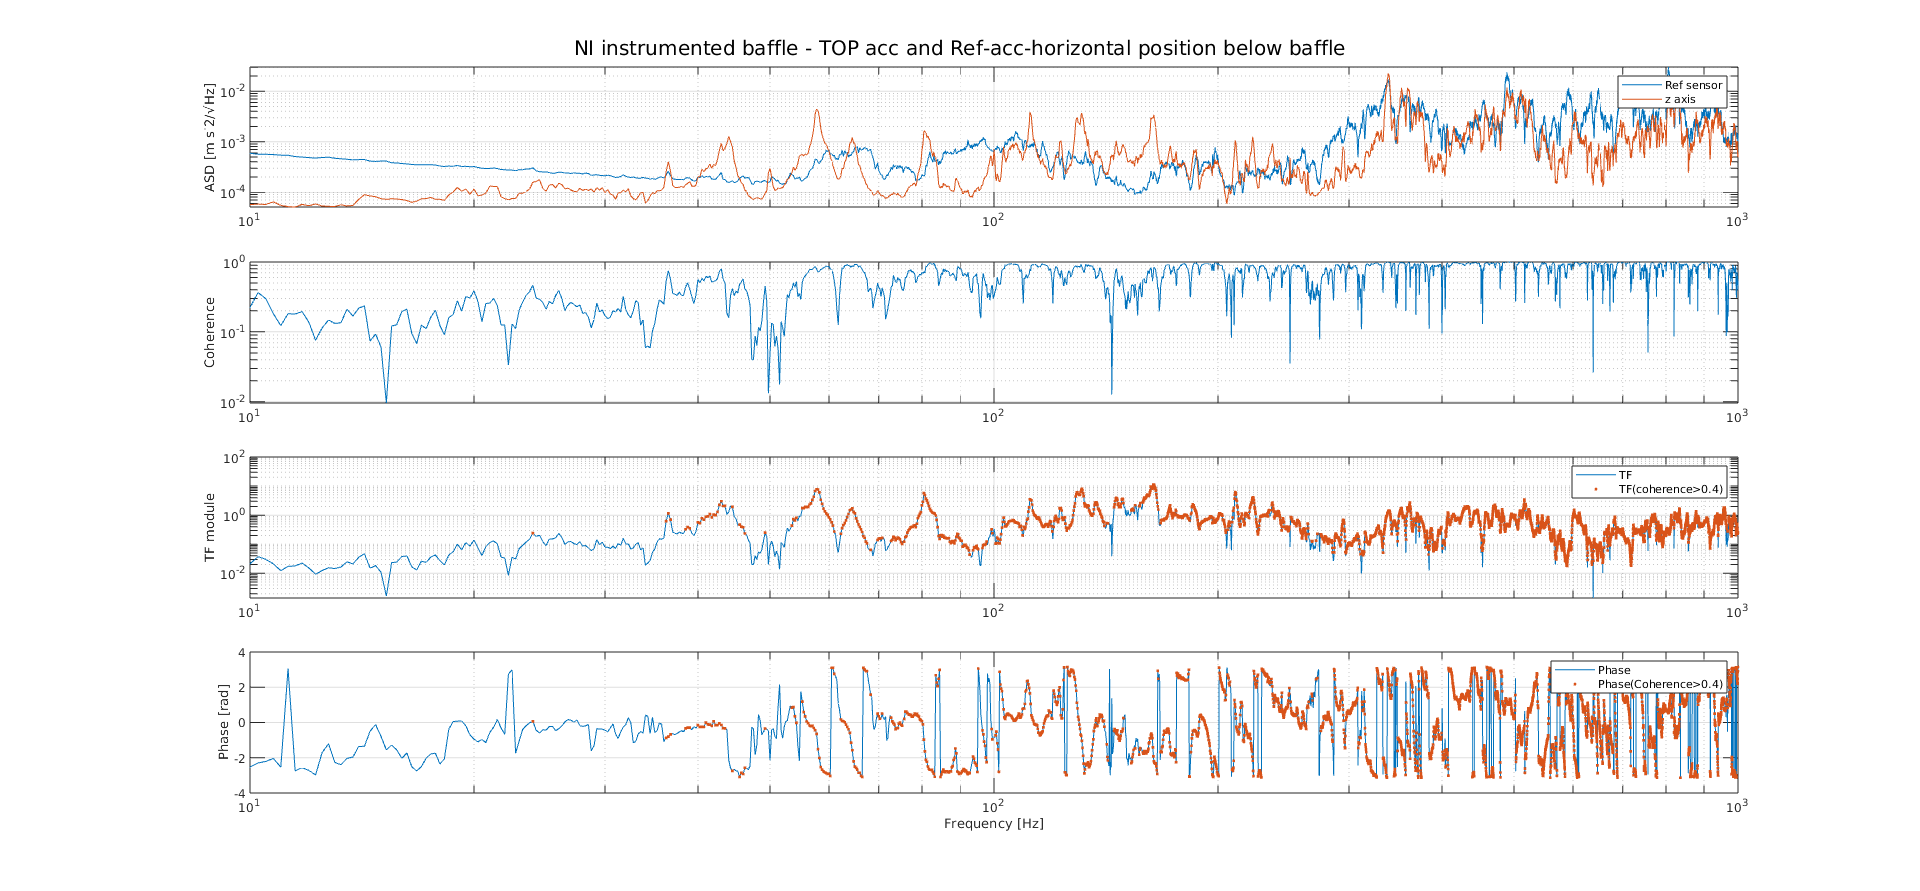
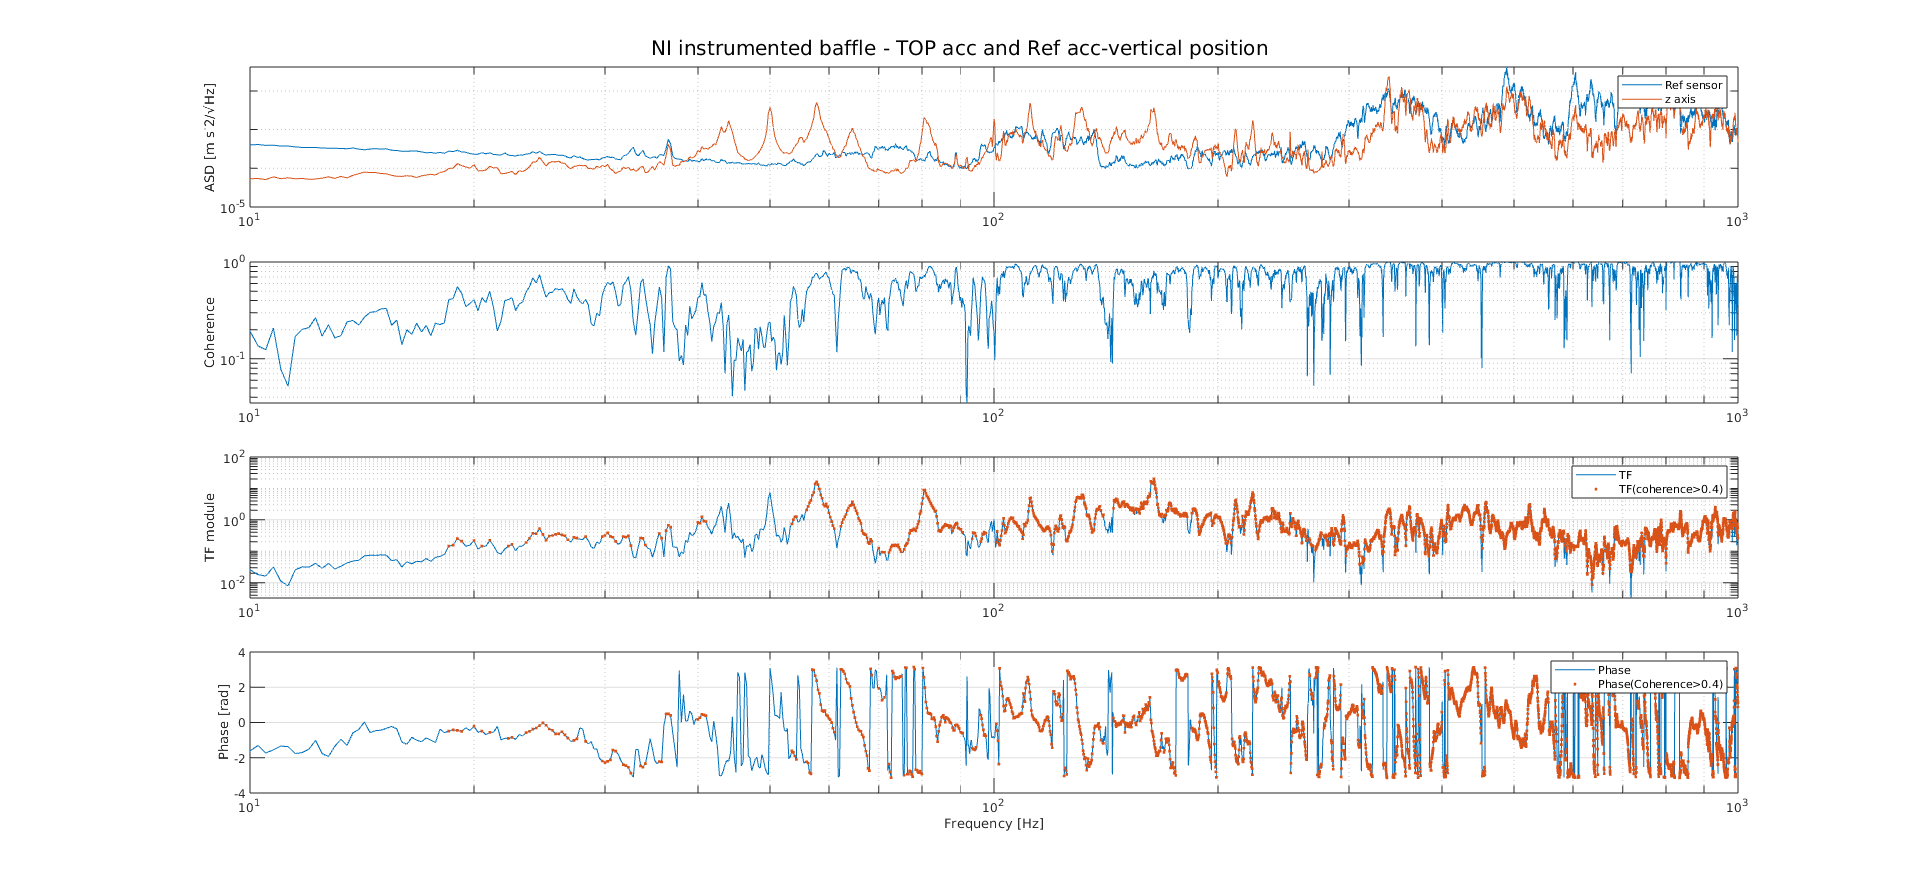
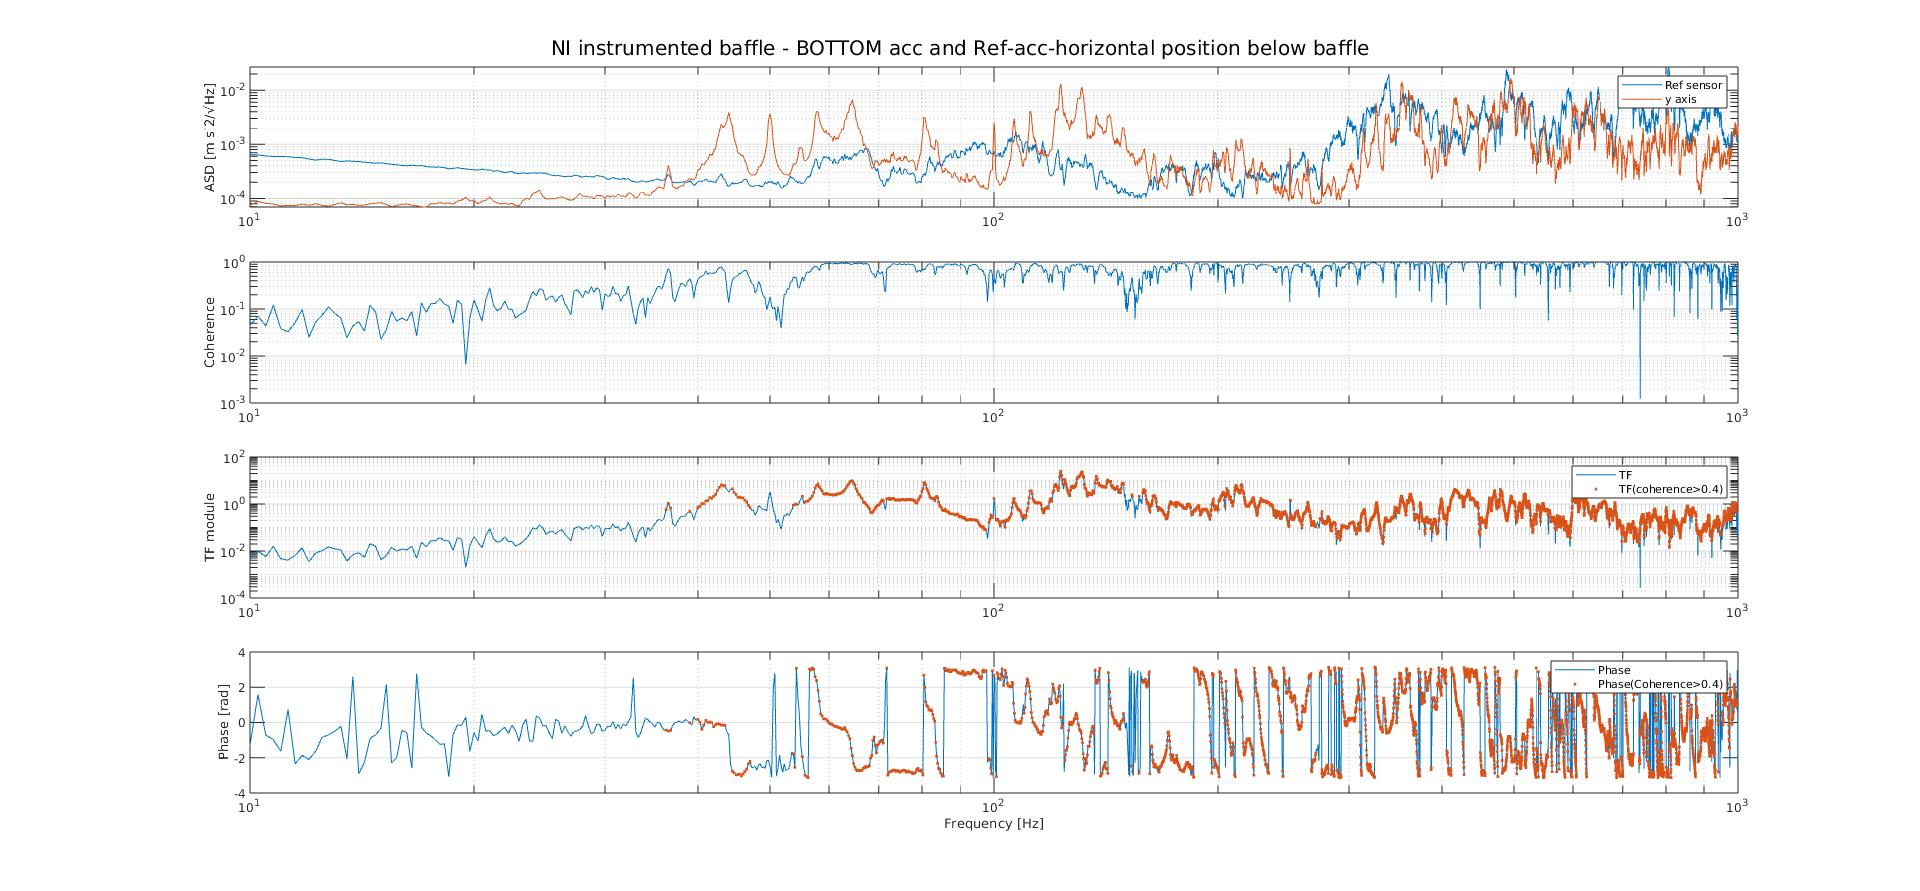
Figures 13–24 show representative transfer function measurements for the sensor axis aligned with the adapter axis. The top panel compares the ASDs measured by the reference accelerometer and by the triaxial accelerometer along the selected axis. The second panel shows the coherence, while the third and fourth panels report the transfer function magnitude and phase, respectively. Red markers identify the transfer function and phase values corresponding to frequency bins with coherence > 0.4.

Candidate resonance frequencies were identified using selection criteria based on the transfer function magnitude, coherence, and phase evolution around the candidate peaks. The complete list of the identified peaks for each measurement configuration is provided in the attached ASCII files (*_candidate_modes.txt).


Images attached to this comment
Non-image files attached to this comment
Tringali - 12:10 Friday 31 July 2026 (69489) Print this report

The following information summarizes the directory structure and file naming convention for the measurements performed on the NI and WI instrumented baffles.
 

*** NI instrumented baffle ***

  • main directory:                         /data/prod/envmon/Instrumented_Baffles/NI_tower/
  • measurement log/action list:    Installation_NI_Instrumented_baffle_16062026.txt
  • time-series data:                     /txt_files/20260616/
  • time series file named as:      SIG#_BLOCK(ch*).txt 

where

  • # is the measurement (SIG) number reported in the action list;
  • ch1 = mono-axial reference accelerometer;
  • ch2 = triaxial accelerometer, x-axis;
  • ch3 = triaxial accelerometer, y-axis;
  • ch4 = triaxial accelerometer, z-axis.
     

*** WI instrumented baffle ***

  • main directory:                          /data/prod/envmon/Instrumented_Baffles/WI_tower/
  • measurement log/action list:     Installation_WI_Instrumented_baffle_20260618.txt
  • time-series data:                     /txt_files/20260618/

The same file naming convention described above applies to the WI measurements.


An example MATLAB script (ReadInstrumentedBaffleData) is attached to show how to read the time-series data.

Non-image files attached to this comment
Search Help
×

Warning

Error

The present report has been modified outside this window. Please check for its integrity in the main page.

Refreshing this page will move this report into drafts.

×