ITF DOWN and in UPGRADING Mode.
All times are UTC.
Below the list of activity communicated to the Control Room:
07:37 - 09:17 INJ: Tests on PSTAB feed forward 50/250 Hz lines (Was, #69435);
08:28 - 11:02 ENV: Noise check on TCS chillers (Fiori, Tringali, Dattilo);
11:56 -1351 ALS: Turning on NEB amplifiers (Lagabbe, #69439);
12:11 - 15:05 ENV: Noise check on TCS chillers (Fiori, Tringali);
14:10 - 14:48 Lagabbe and Boldrini in Laser Lab to flip a mirror for ALS (#69439);
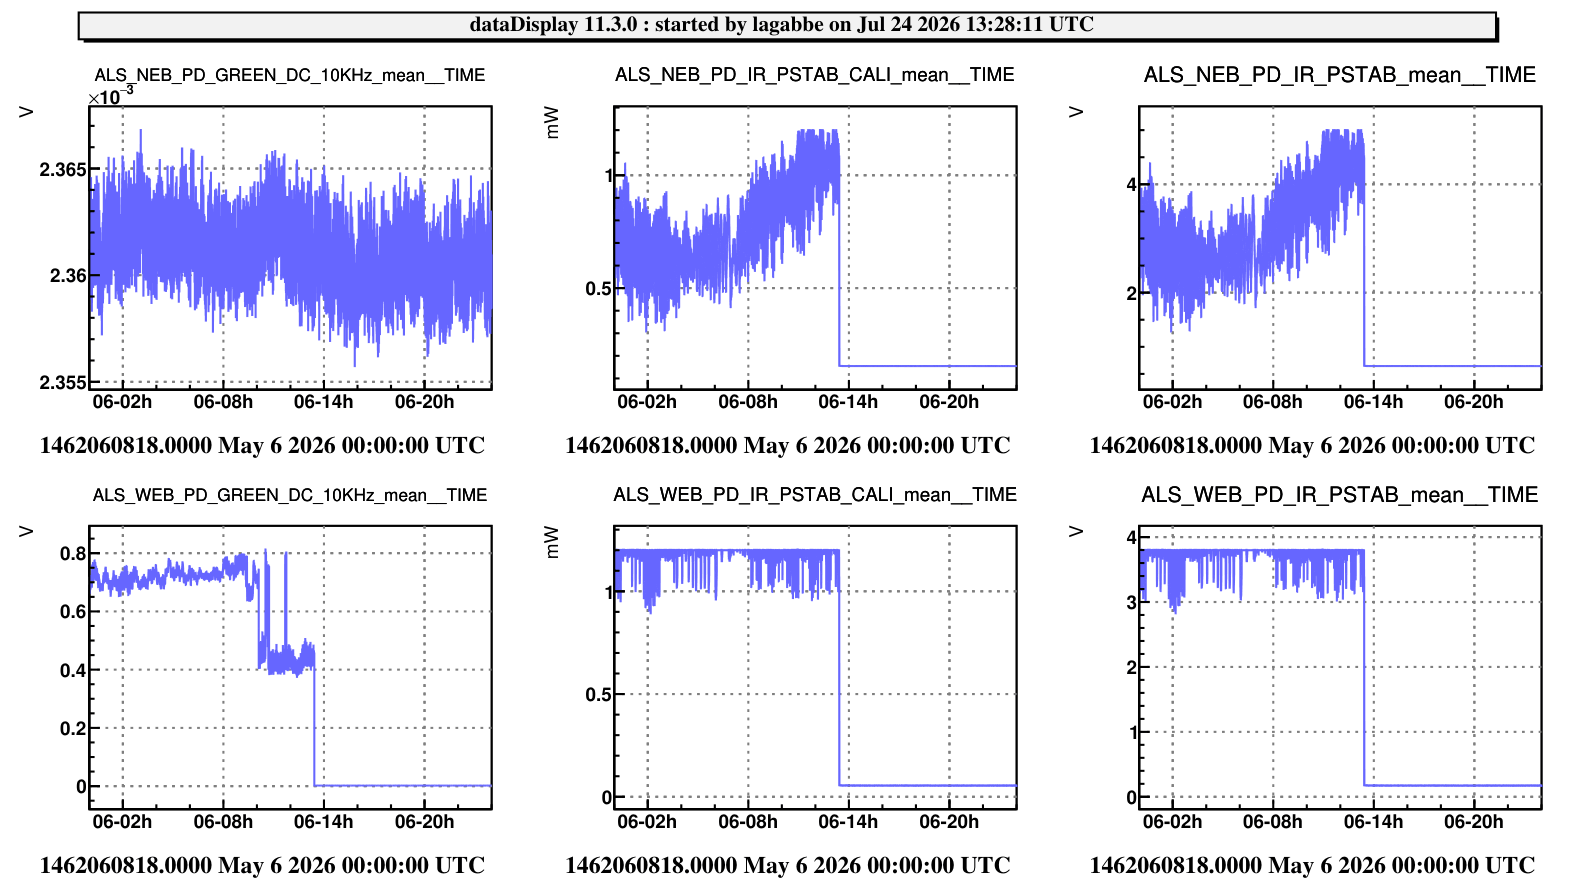
We went to NEB in order to switch on the laser amplifier on the ALS rack (kheopsys), but the input laser of the amplifier was missing. This amplifier requires 0 dBm of input power but its internal sensor shows -5.4 dBm.
After investigation, it appears that the power that is sent to both ALS_NEB and ALS_WEB was cut off at the same time on May 6 2026, which indicates that the problem comes from EIB. The flip mirror has been switched to block the laser beam that goes toward ALS green laser generator.
Now the ALS_WEB amplifier works properly, but the power at the output of the ALS_NEB amplifier is still missing. It is required to go to NEB again to switch on the amplifier
Following the previous temperature sensor tuning (https://logbook.virgo-gw.eu/virgo/?r=69362), I complete the procedure for WEN aand WWN box sensors to have all WEB temperature sensors within 0.1°C.
For this, I applied offsets of 0.025 V for WEN box and 0.002 V for WNN box. For memory, the temperature change for a 0.1 V offset are respectively 3.34° and 3.20° for WEN box and WNN box.To align the sensor values on the motor values,
Implemented the 50Hz and 250Hz line feed forward into the PSTAB, it works but the target signal needs to be replaced by one which is not contaminated by the 50Hz harmonics.
7:38:40 UTC restarted ISYSnoise without changes in the configuration file,
other than putting PSTAB1 line amplitude to be the same as in the
External file. This unlocked the injection which then relocked after 1 minute.
After fixing some forgotten copy pastes, and adjusting the feedback
sampling frequency could restart the ISYSnoise process. Also added
buttons to turn the FF on and FF into the VPM interface.
08:23 UTC (3min) 50Hz feed-forward on with automatic tracking converged.
It is effective at removing 50Hz from PSTAB channels, both PDa and PDd
simultaneously, but 50Hz harmonic remains on RFC and B2 spectrum,
where they are reduced only by a factor 1.5-2. It is somewhat not
suprising as the 50Hz is polluting the PSTAB photodiodes sensor, so
minimizing the 50Hz in the PSTAB sensor does not improve the light
power stability. Need to use a sensor that is not contaminated by 50Hz
harmanics, the RFC reflection photodiodes can be good candidates as
they are in vacuum and with a differential read-out of the photodiode signal.
09:03 UTC (6min) 50Hz and 250Hz FF on with aumatic tracking
09:10 UTC (6min) 50Hz and 250Hz FF off
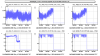
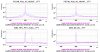
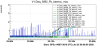
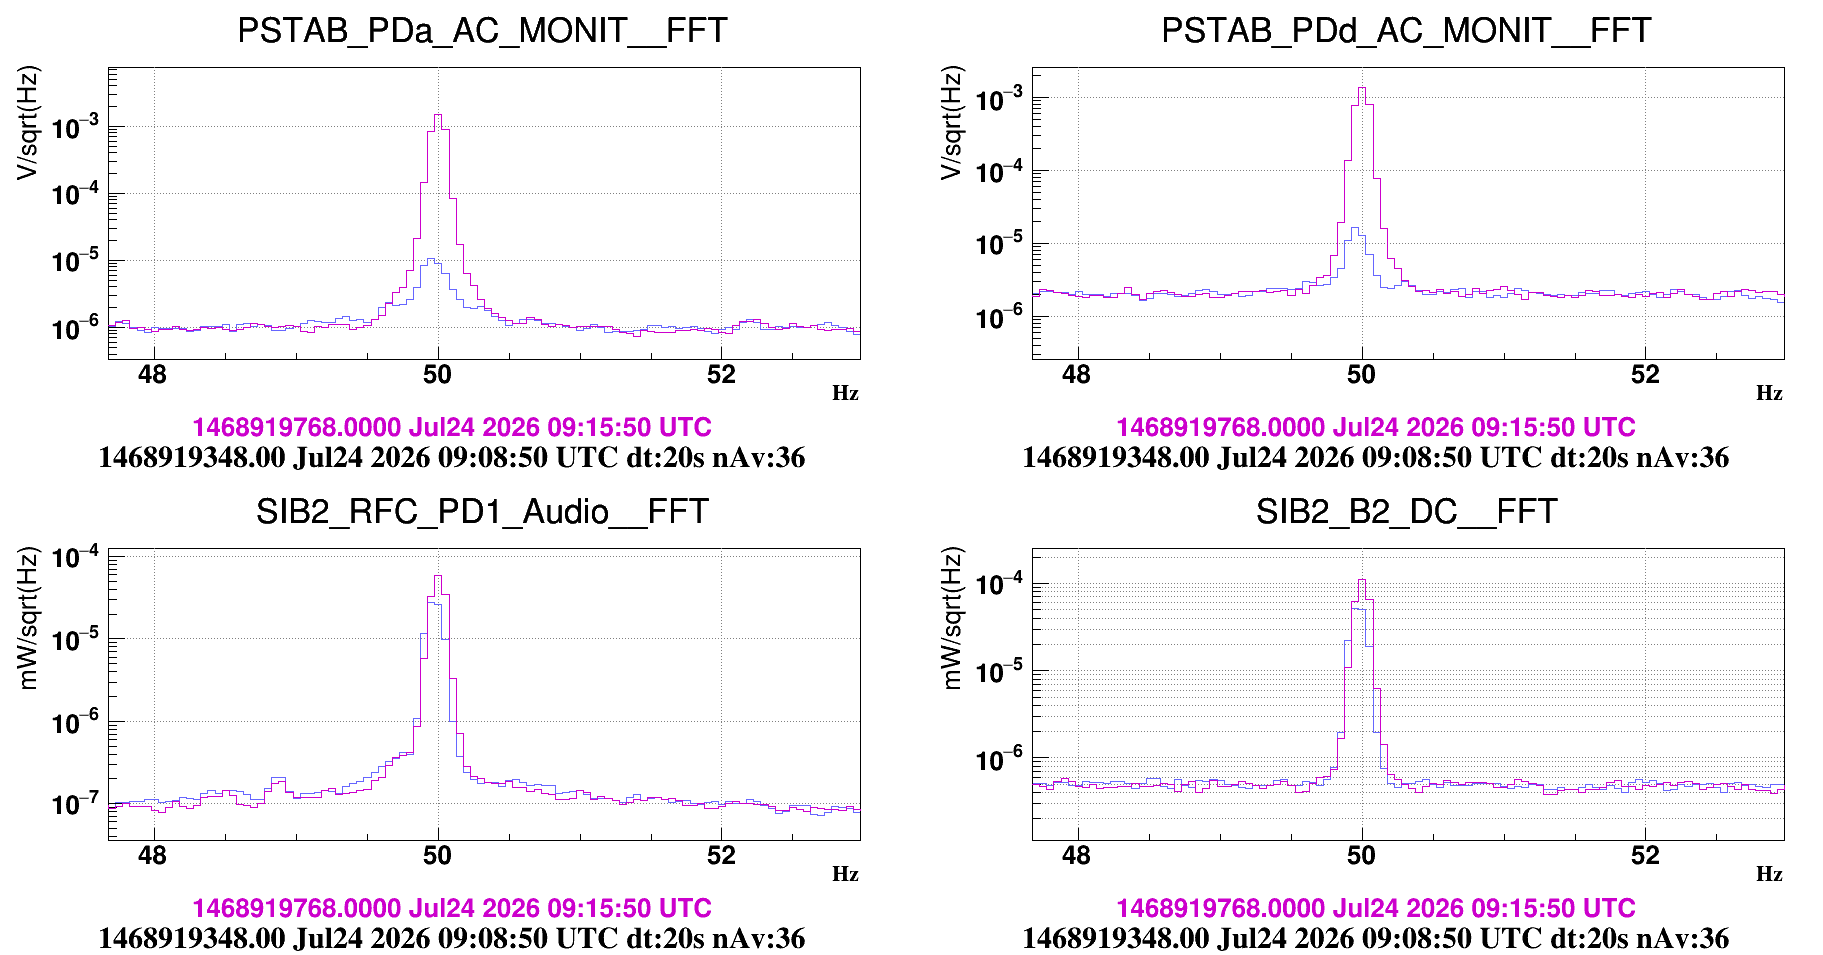
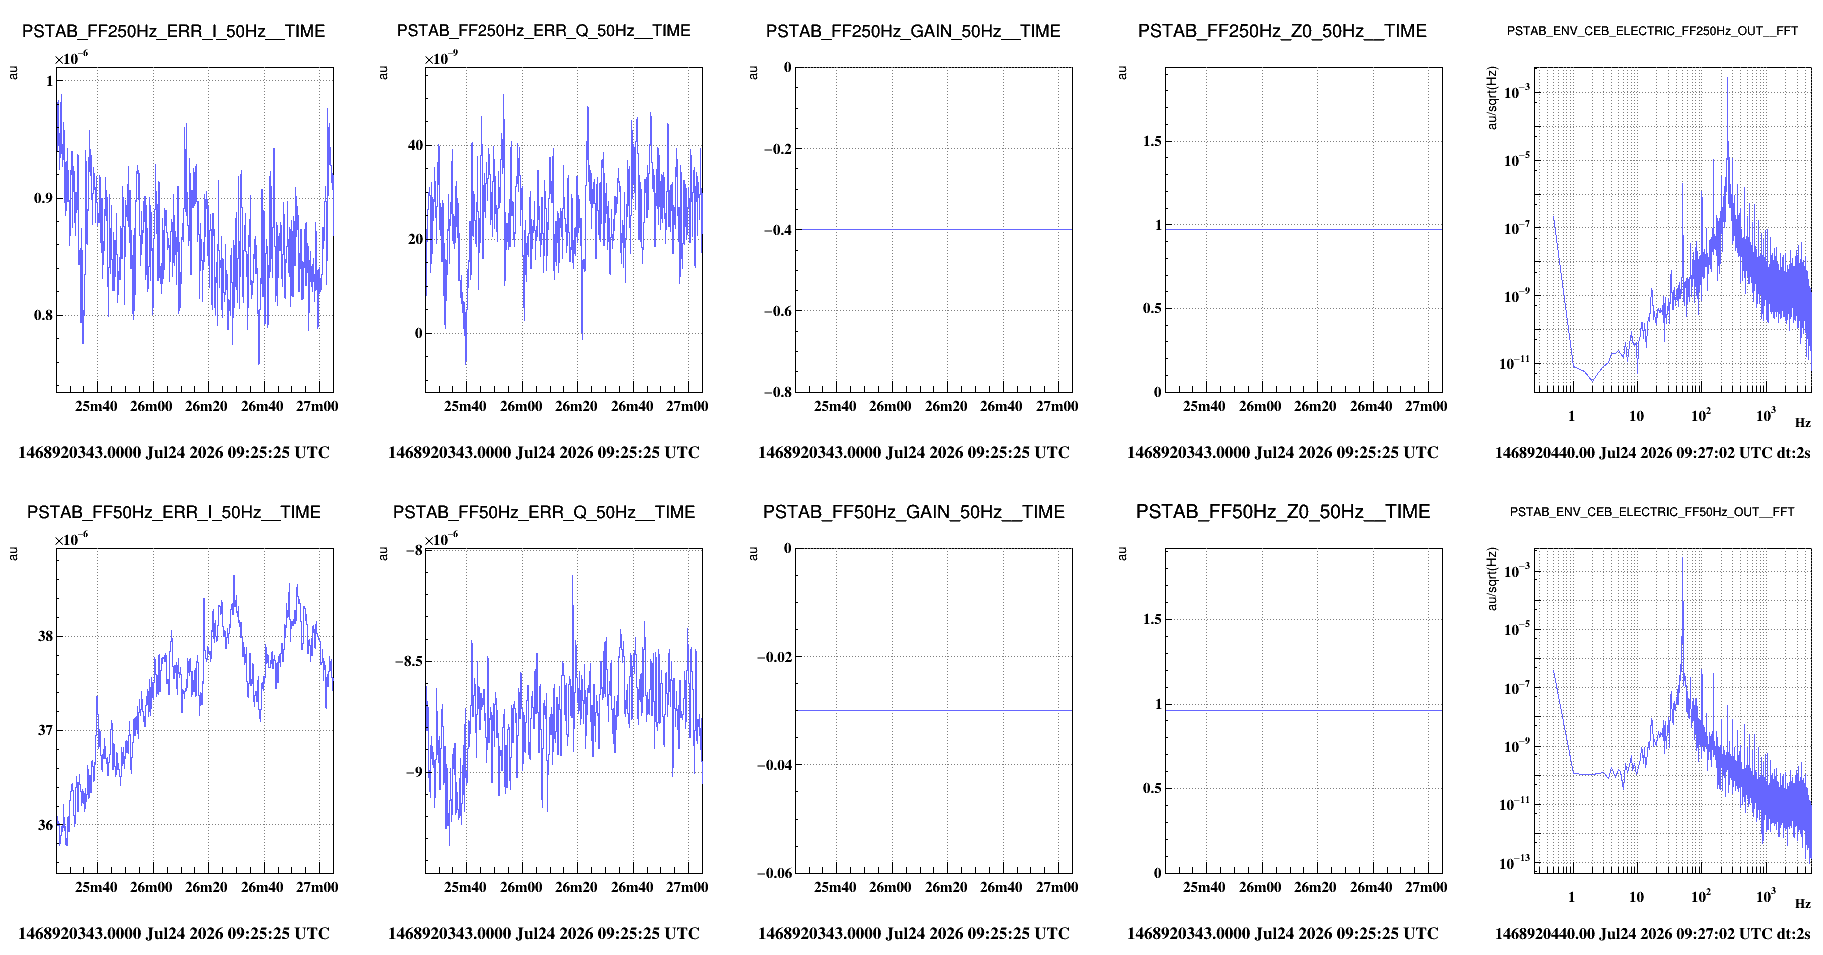
Figure 1 shows the result of the feed-forward on the 50Hz lines, it is
reduced by ~2 orders of magnitude on both PSTAB photodiodes (PDa is
the one which is in loop), but for signals without 50Hz contamination
(RFC, B2, the improvement is less than a factor 2). Blue shows data
with the FF enabled and purple with the FF disabled
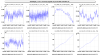
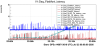
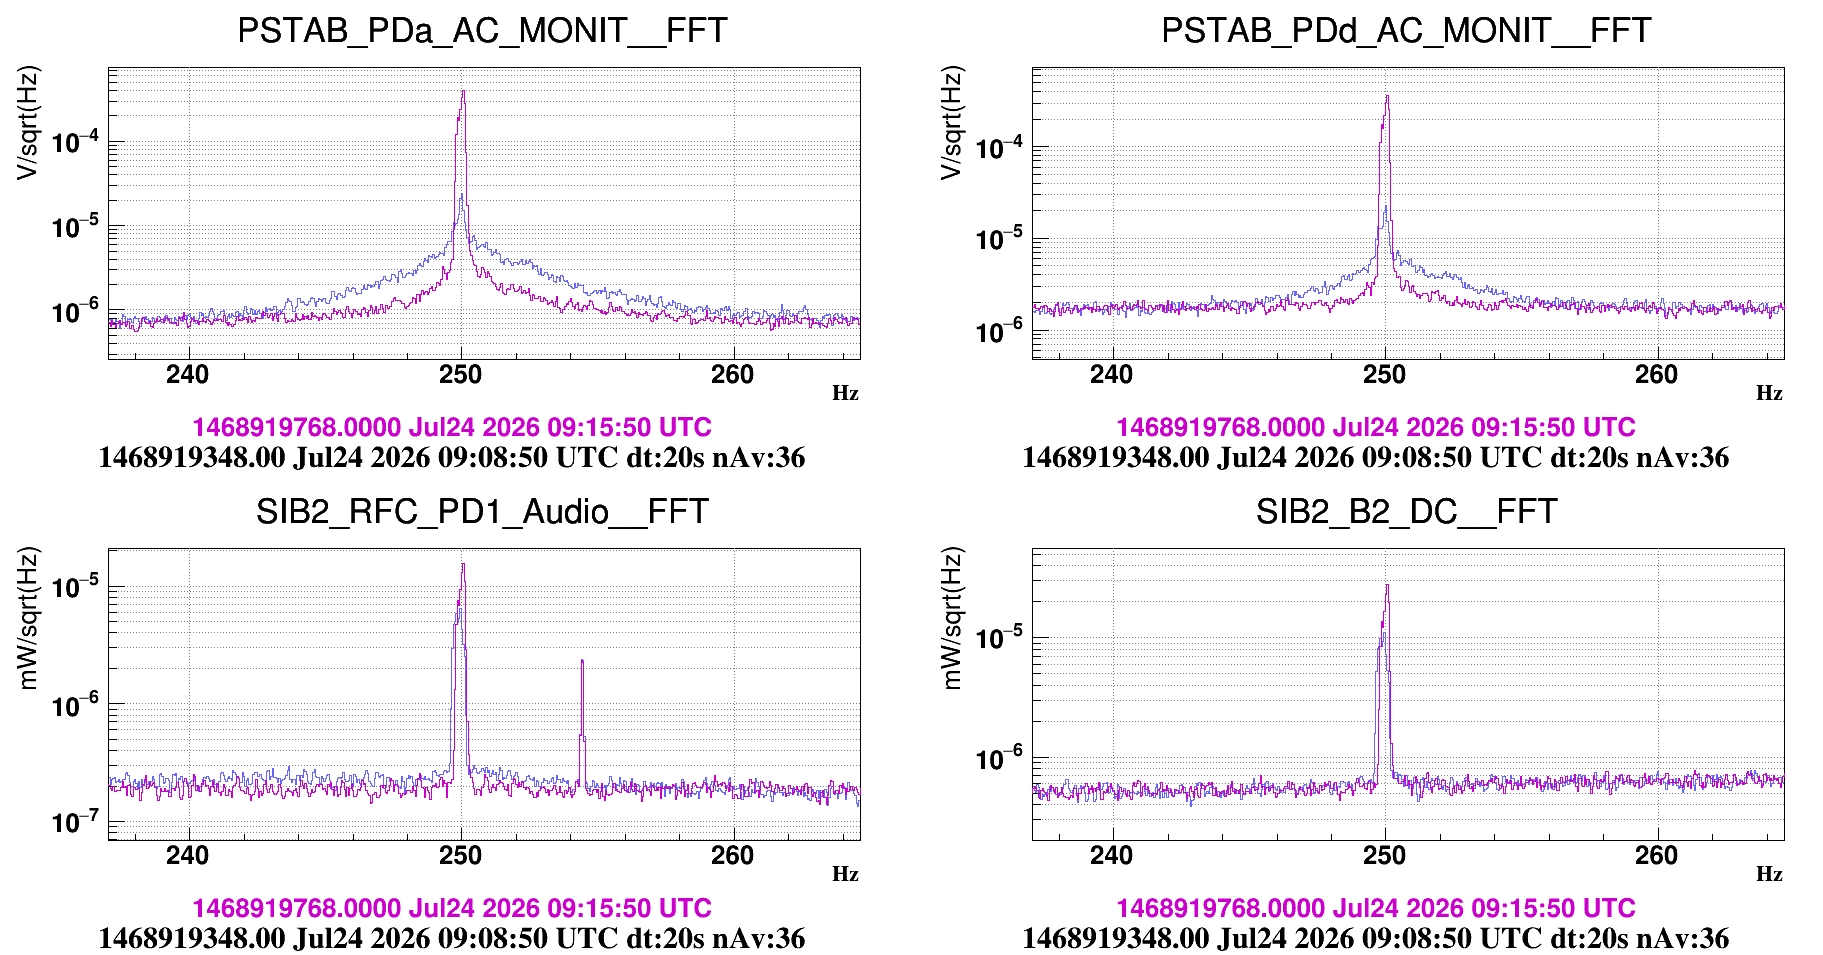
Figure 2 shows the result for the 250Hz line, where the environmental
channel has less clearance between the 250Hz line and the measurement
noise, so the FF is effective at removing the line but adds a wide
bump around the line.
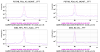
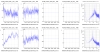
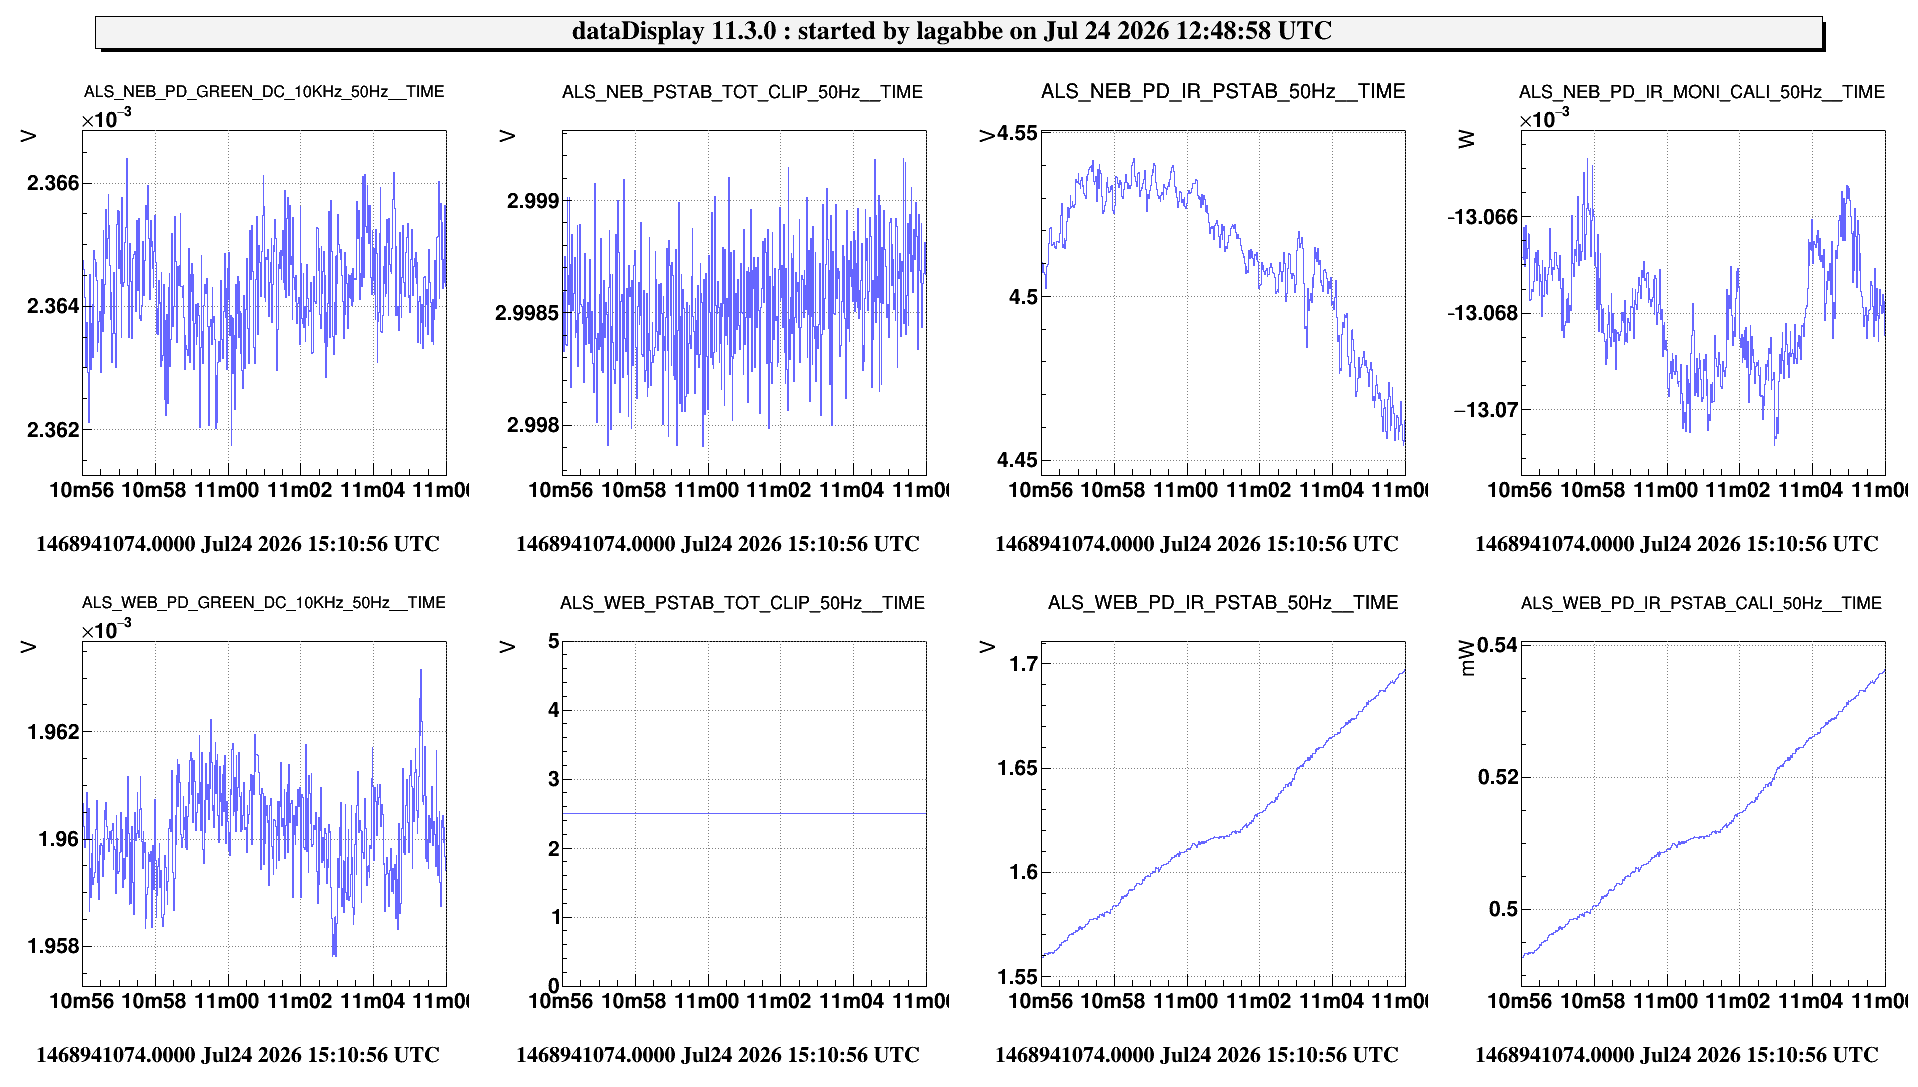
Figure 3 shows some of the FF channels when the loop is open.
Leaving the FF off as it doesn't have a protection to not misbehave
when the injection is unlocked. Next step is to add the RFC Audio
channel to RTPC19 so it can be used as a target channel for the
feed-forward.
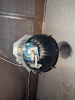
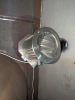
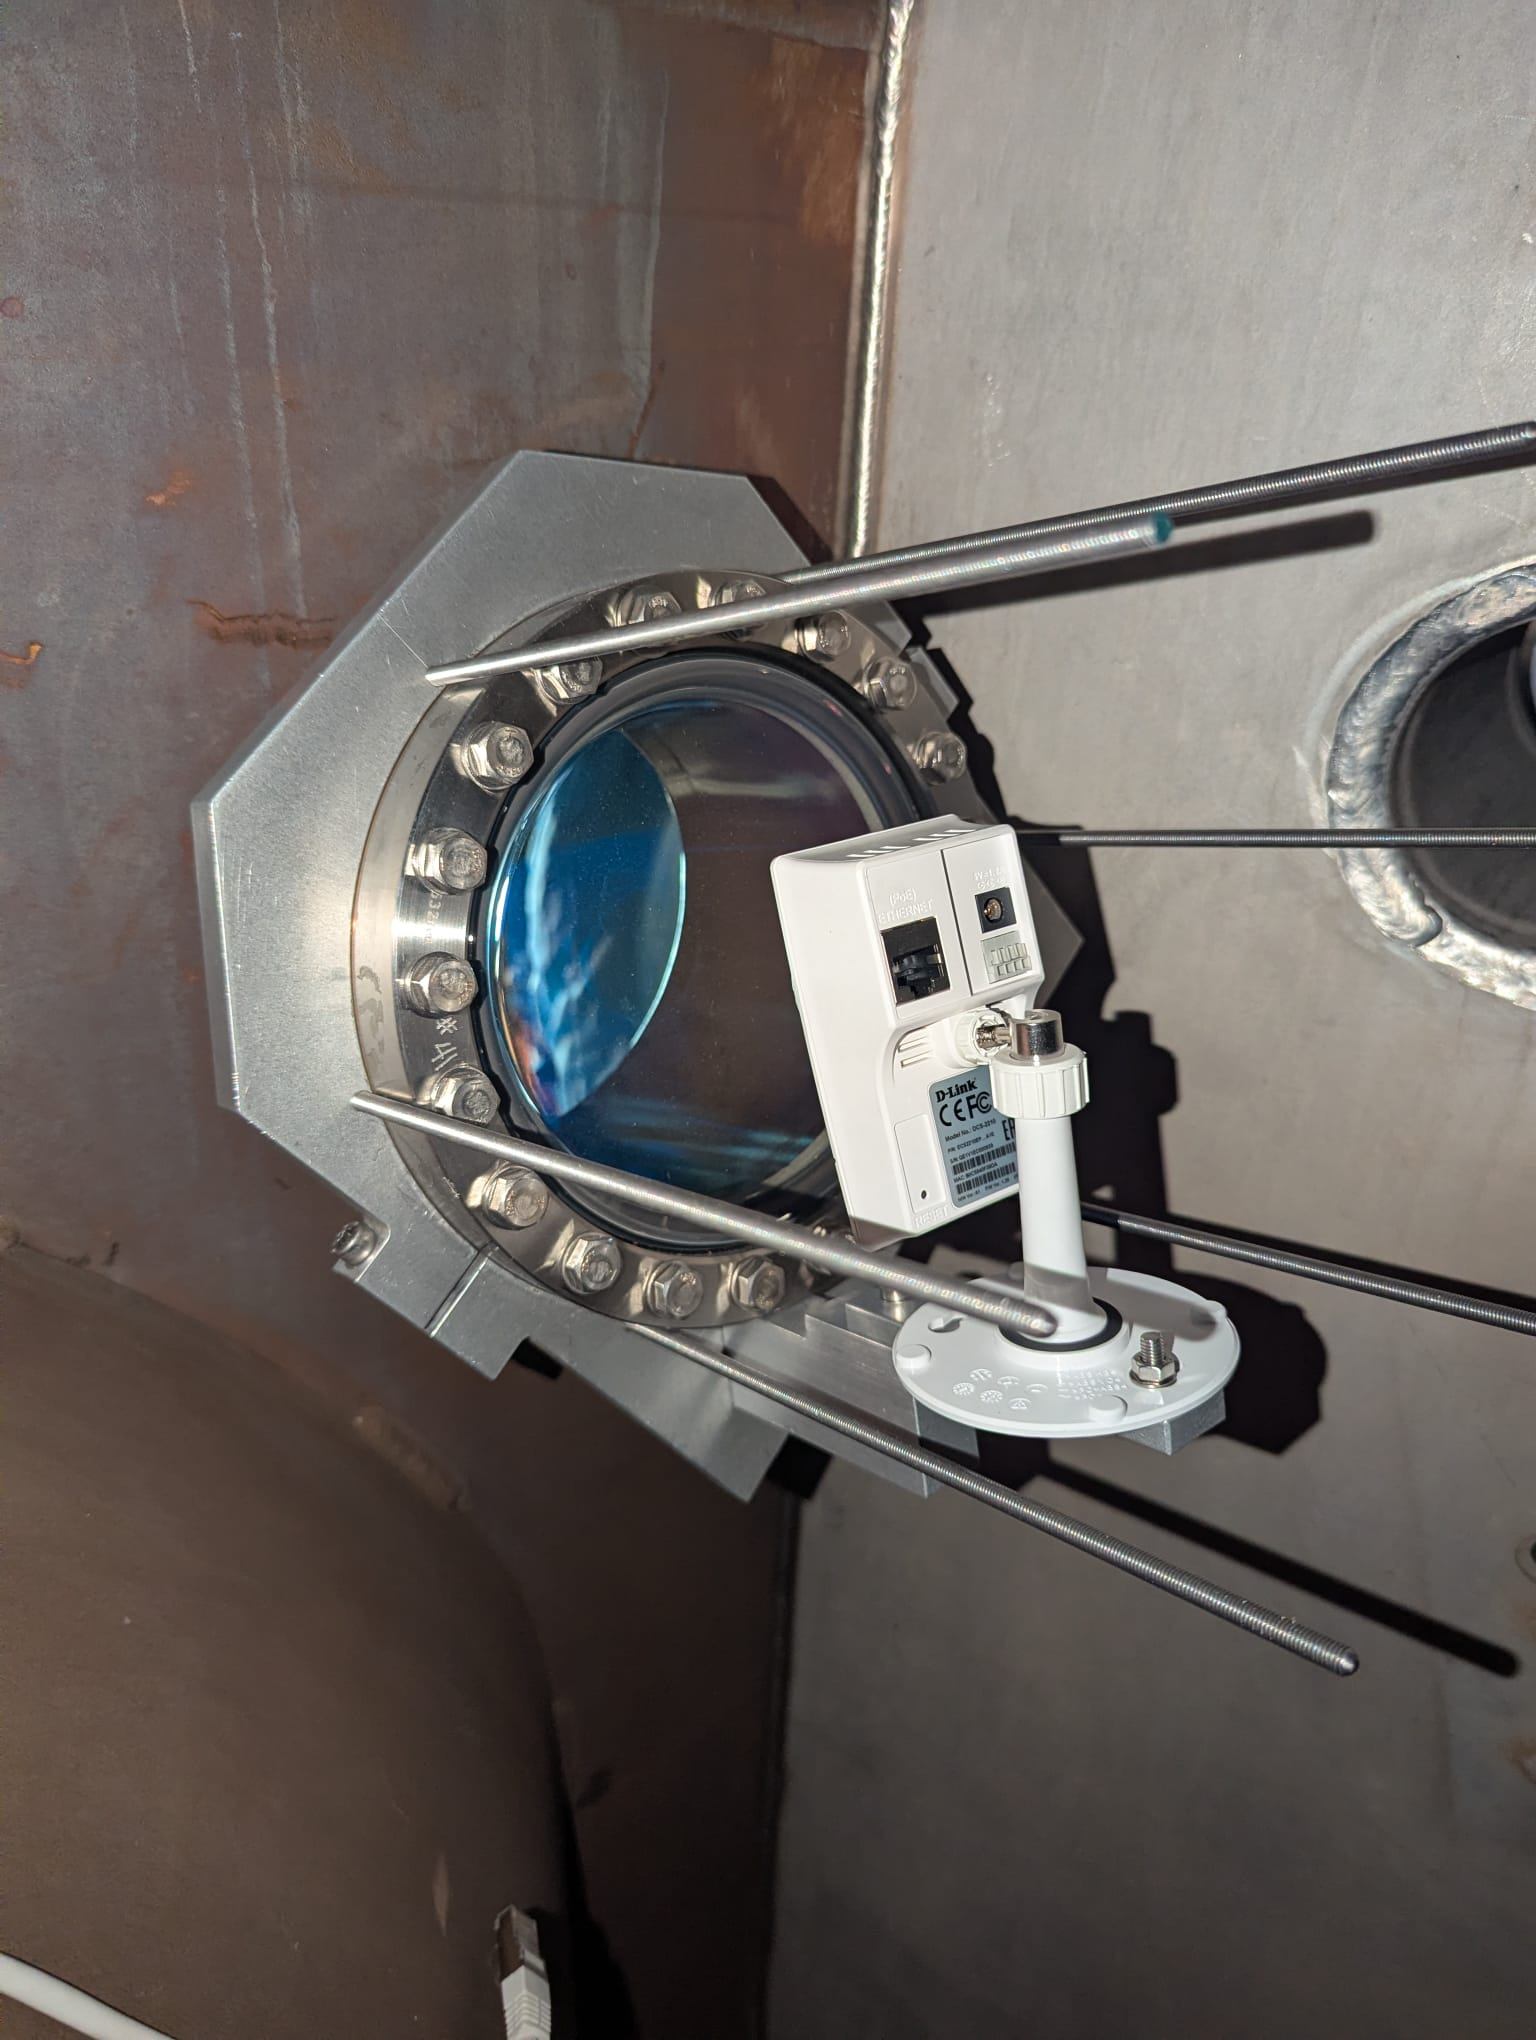
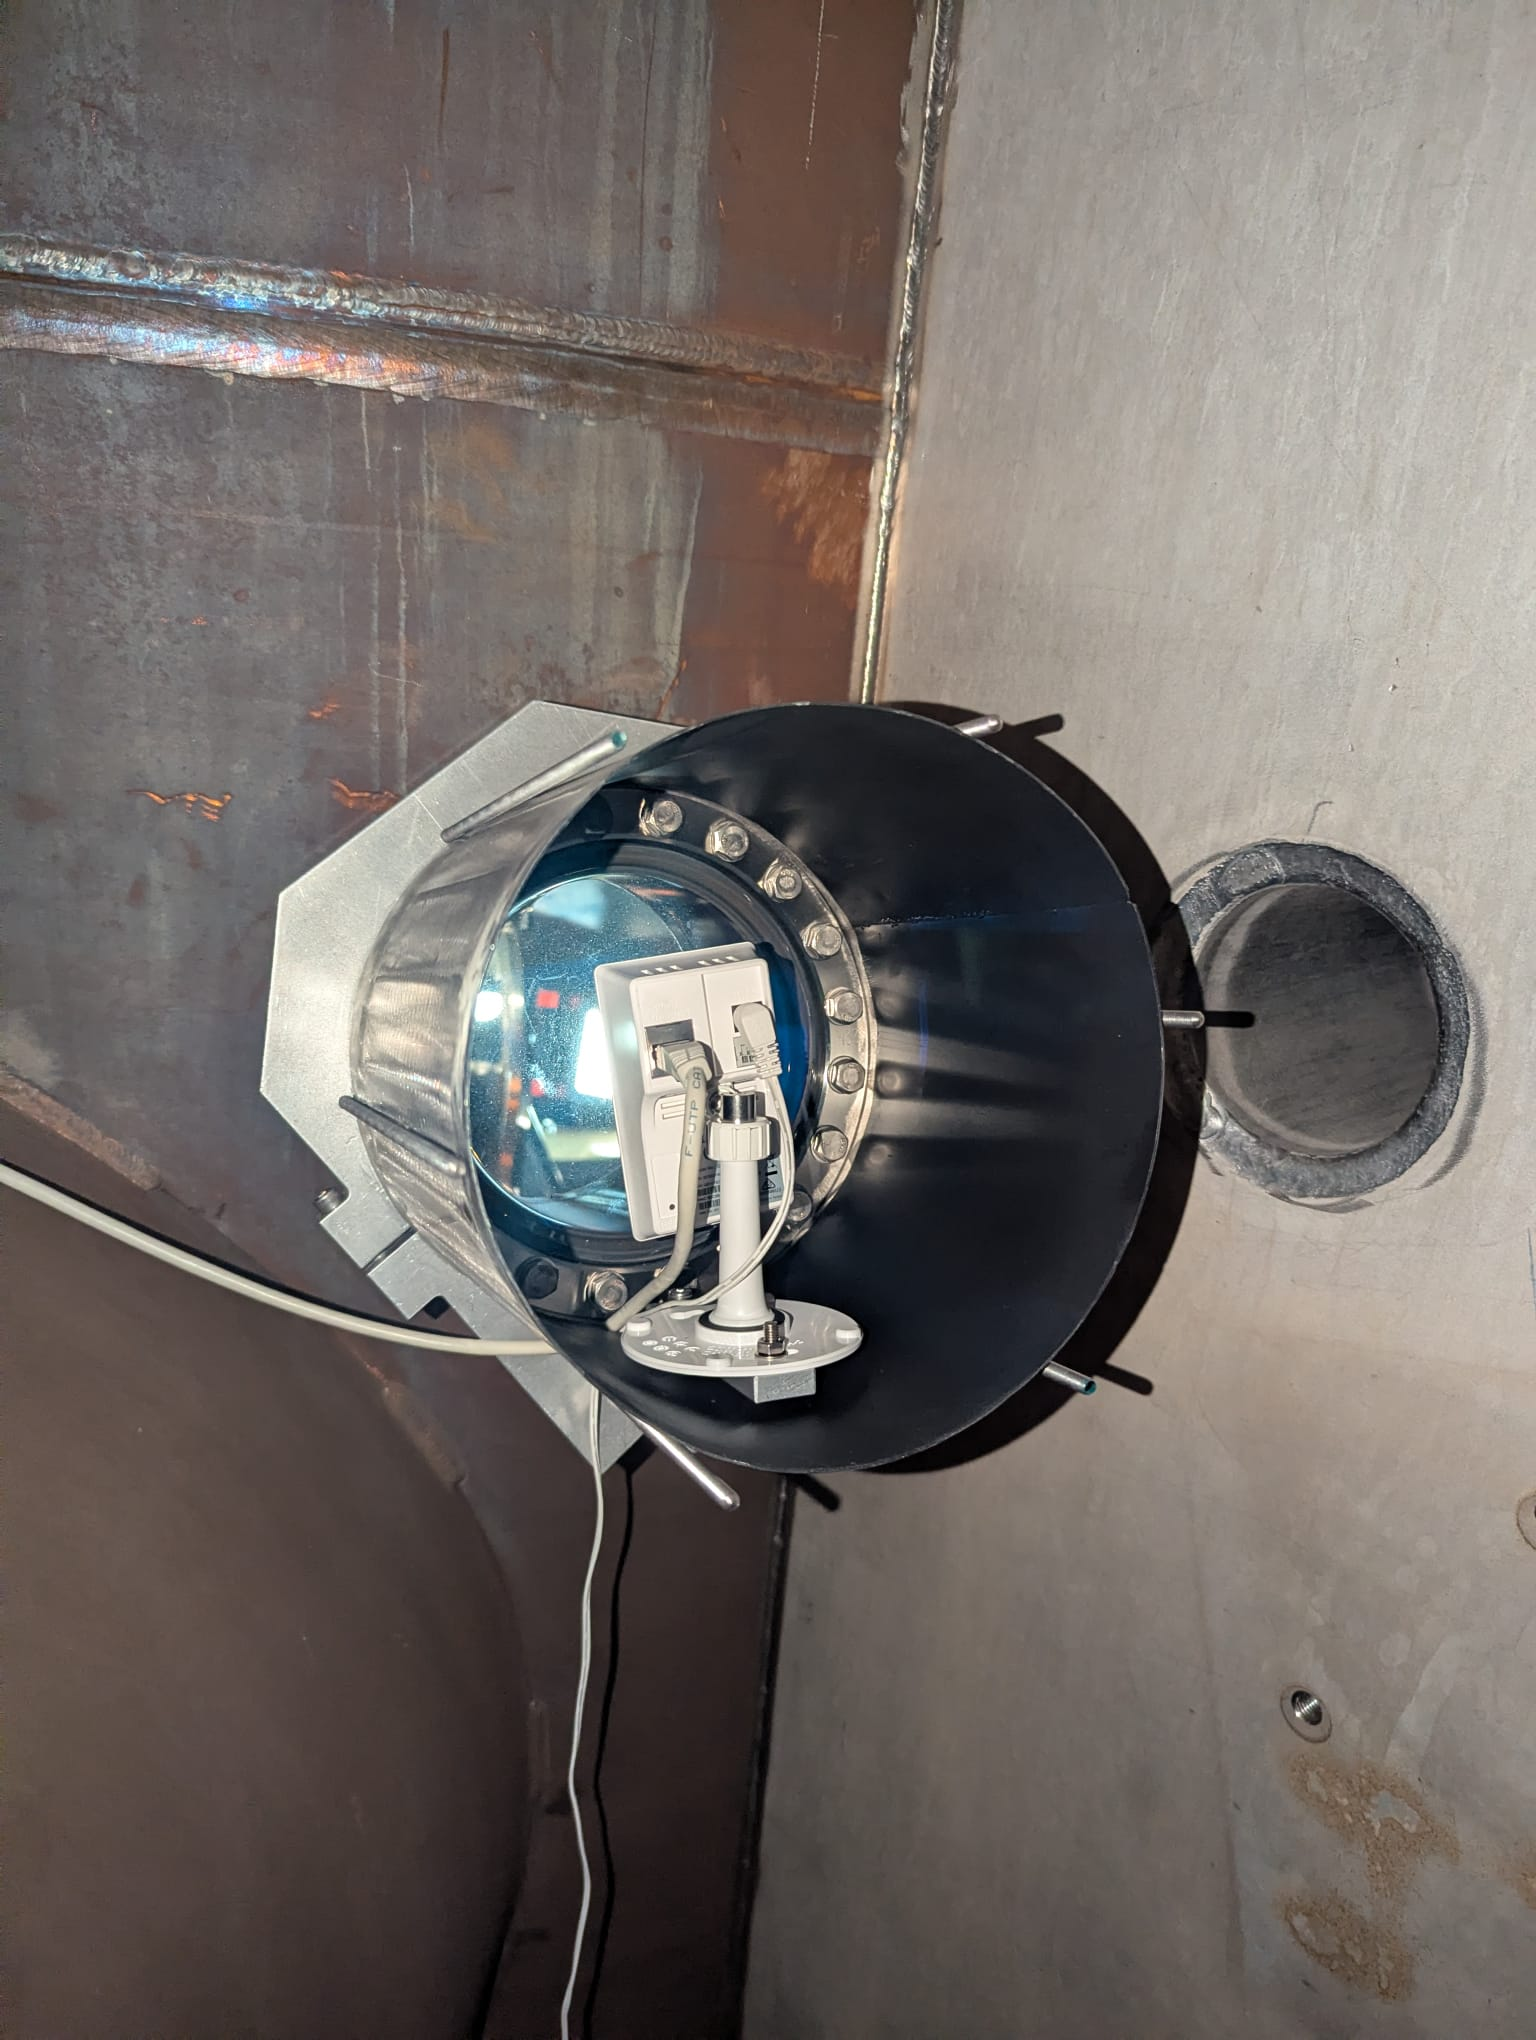
On Wednesday Angelo and I went to the WI tower to install a prototype for a camera holder that also covers the exposed viewport.
This first version of the holder is made by a metal bracket that is tightened around the flange (NOT the viewport itself, to avoid mechanical stress on the glass) and then a metal cylinder that envelopes the camera and obstructs the viewport.
The figures show the assembly stages. Fig.2,3 in particular show the camera cables exiting the envelope through a thin slit on its bottom side.
The holder is currently installed, so the risk of accidental exposure to 1064 nm light inside the tent around the WI tower is greatly reduced.
We are considering successive iterations made of PVC to further diminish the risck of applying mechanical stress on the viewport and to possibly introduce some ability to adjust the camera. Another feature we would like to introduce is to remove the need for tools to open/close the assembly and move the camera, as currently a #8 wrench is required for these operations.

Any work on the lasers and the fibres on the racks 1 & 7 (PCAL & ALS) that requires to disconnect fibres or open laser enclosure must be authorized in advance.
The permit to work is now close, lasers are allowed in the WI tower.
According to this plot, the issue seems to be fixed automatically during this night
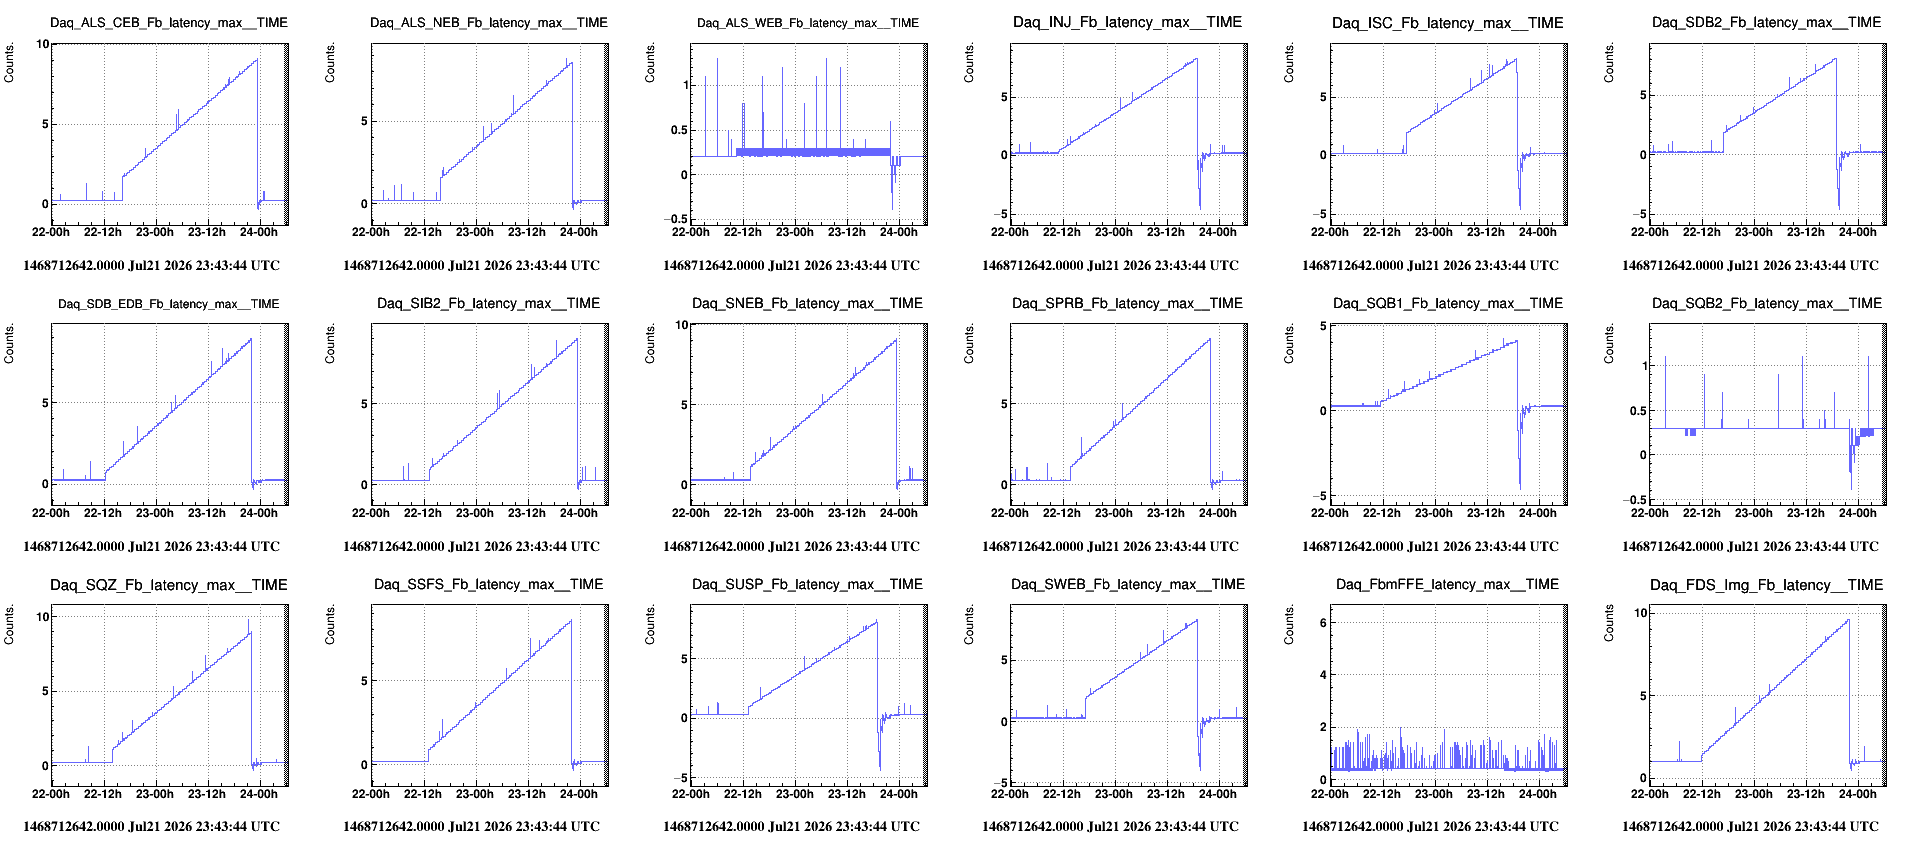
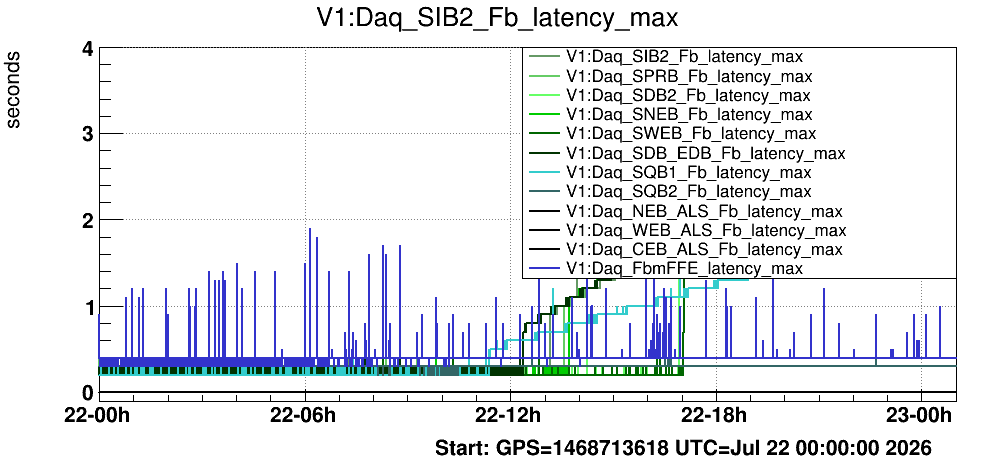
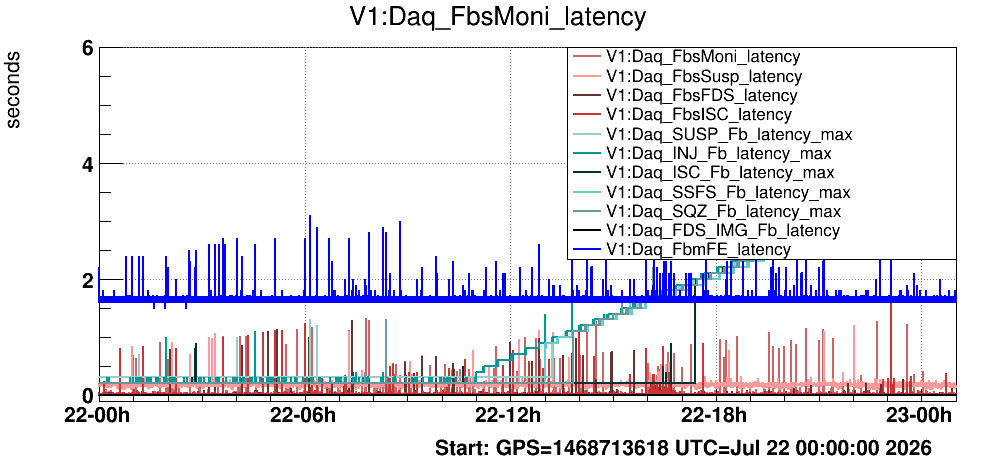
Looking at the DAQ VIM plots (plot1, plot2) of the 2026-07-22, one can see that
- starting from the 2026-07-22-11h the latency of the TolmFrameBuiders (*_Fb) started to increase
- while that of their frame receiver (FbmFFE) remains at the same level (~0.4s max)
- This lead that there is an issue with the rtpc's ntpd daemon.
Looking at their /var/log/messages with the date in local time , one can found that there is an issue related to the chronyd daemons .
Below the report related to the chronyd issue for some rtpcs
- rtpc4 (SUSP_Fb)
- Jul 22 14:37:38 rtpc4 chronyd[1442]: Can't synchronise: no selectable sources
Jul 22 15:11:57 rtpc4 chronyd[1442]: Selected source 90.147.138.152
Jul 22 15:17:21 rtpc4 chronyd[1442]: Can't synchronise: no selectable sources
Jul 23 20:53:24 rtpc4 chronyd[1442]: Selected source 90.147.138.152
Jul 23 20:53:24 rtpc4 chronyd[1442]: System clock wrong by -7.984378 seconds, adjustment started
Jul 23 21:23:37 rtpc4 chronyd[1442]: Can't synchronise: no selectable sources
Jul 23 21:37:39 rtpc4 chronyd[1442]: Selected source 90.147.138.152
Jul 23 21:37:39 rtpc4 chronyd[1442]: System clock wrong by 4.052407 seconds, adjustment started
- Jul 22 14:37:38 rtpc4 chronyd[1442]: Can't synchronise: no selectable sources
- rtpc7 ( FDS_Img; FDS_Fb)
- Jul 22 13:53:42 rtpc7 chronyd[1453]: Can't synchronise: no selectable sources
Jul 23 23:59:02 rtpc7 chronyd[1453]: Selected source 90.147.138.152
Jul 23 23:59:02 rtpc7 chronyd[1453]: System clock wrong by -7.775702 seconds, adjustment started
- Jul 22 13:53:42 rtpc7 chronyd[1453]: Can't synchronise: no selectable sources
- rtpc8 (SNEB_Fb)
- Jul 22 14:32:56 rtpc8 chronyd[1451]: Can't synchronise: no selectable sources
Jul 22 15:41:46 rtpc8 chronyd[1451]: Selected source 90.147.138.152
Jul 22 15:47:10 rtpc8 chronyd[1451]: Can't synchronise: no selectable sources
- Jul 22 14:32:56 rtpc8 chronyd[1451]: Can't synchronise: no selectable sources
- rtpc9 (SWEB_Fb)
- Jul 22 14:44:16 rtpc9 chronyd[1451]: Can't synchronise: no selectable sources
Jul 22 19:02:14 rtpc9 chronyd[1451]: Selected source 90.147.138.152
Jul 22 19:02:14 rtpc9 chronyd[1451]: System clock wrong by 1.607974 seconds, adjustment started
Jul 22 19:07:36 rtpc9 chronyd[1451]: Can't synchronise: no selectable sources
Jul 23 20:53:30 rtpc9 chronyd[1451]: Selected source 90.147.138.152
Jul 23 20:53:30 rtpc9 chronyd[1451]: System clock wrong by -8.208126 seconds, adjustment started
Jul 23 21:23:45 rtpc9 chronyd[1451]: Can't synchronise: no selectable sources
Jul 23 21:37:47 rtpc9 chronyd[1451]: Selected source 90.147.138.152
Jul 23 21:37:47 rtpc9 chronyd[1451]: System clock wrong by 3.713912 seconds, adjustment started
- Jul 22 14:44:16 rtpc9 chronyd[1451]: Can't synchronise: no selectable sources
- rtpc21 (SSFS_Fb) :
-
Jul 22 14:42:31 rtpc21 chronyd[1943]: Can't synchronise: no selectable sources
Jul 22 14:59:38 rtpc21 chronyd[1943]: Selected source 90.147.138.152
Jul 22 15:05:02 rtpc21 chronyd[1943]: Can't synchronise: no selectable sources
Jul 23 23:58:50 rtpc21 chronyd[1943]: Selected source 90.147.138.152
Jul 23 23:58:50 rtpc21 chronyd[1943]: System clock wrong by -7.652092 seconds, adjustment started
-
This should be fixed by the IT department
According to this plot, the issue seems to be fixed automatically during this night
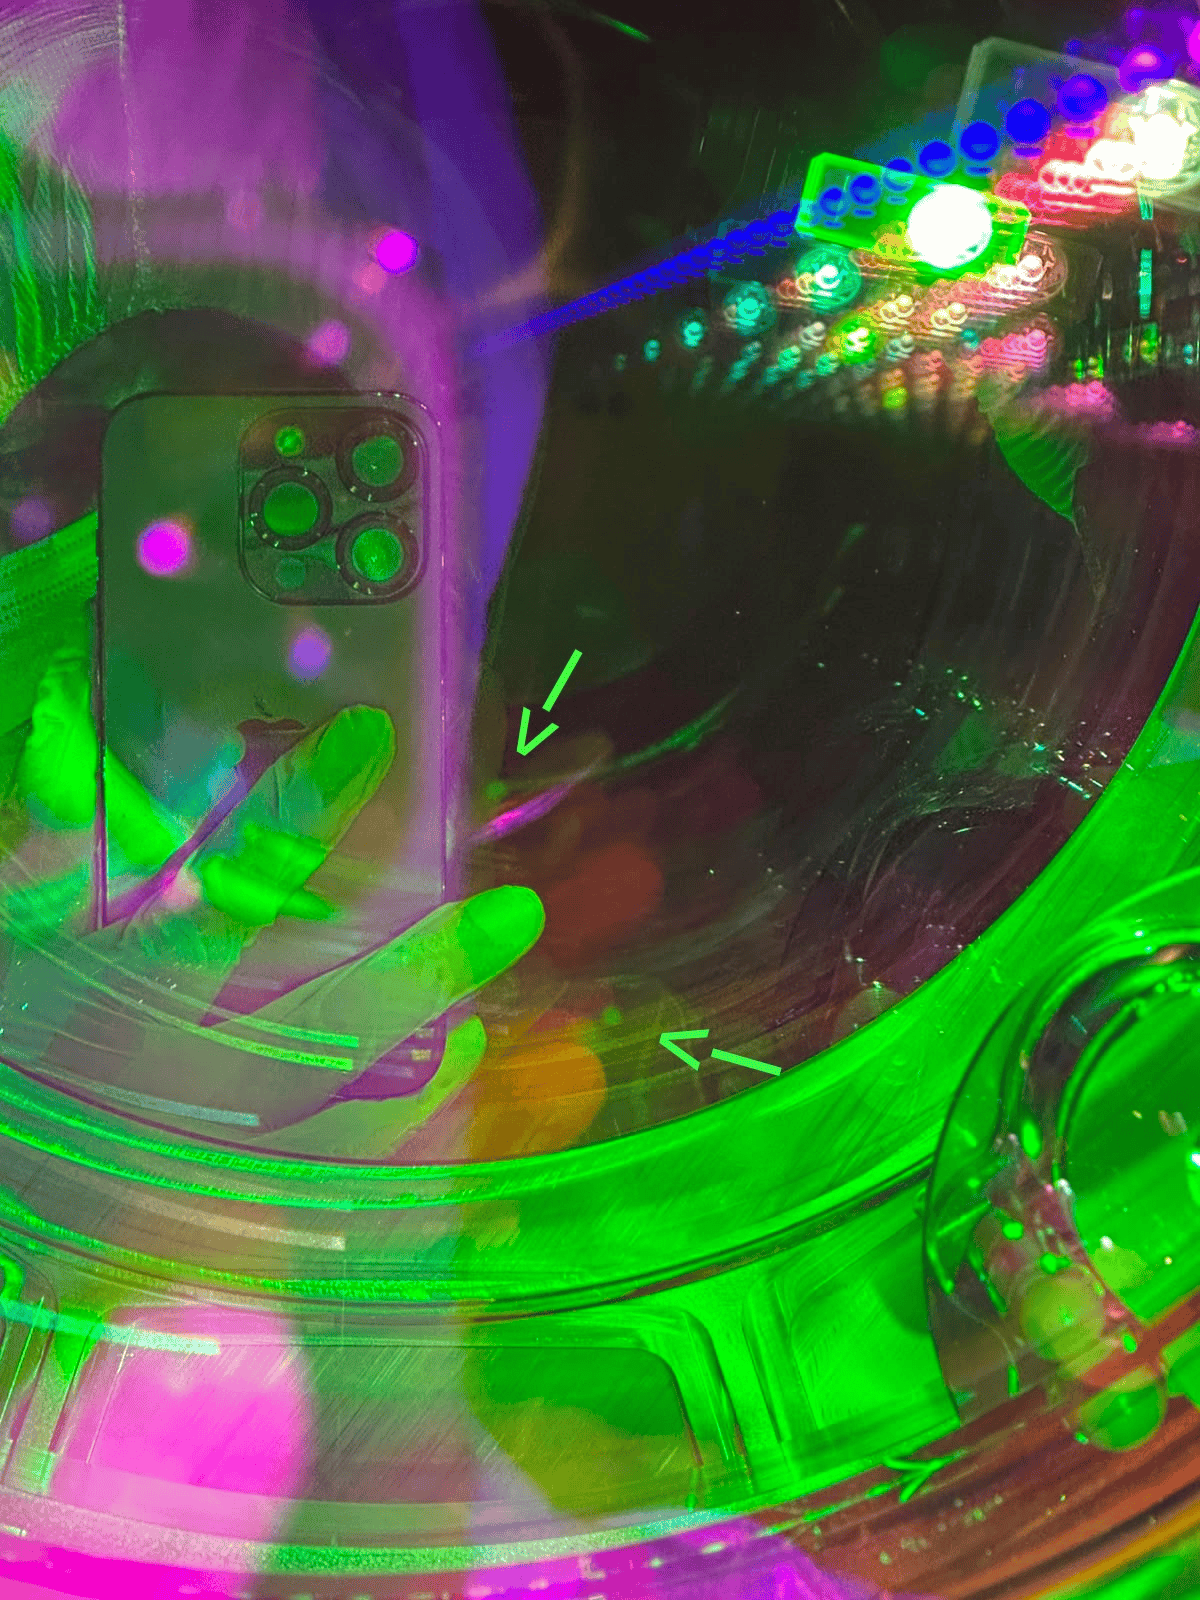
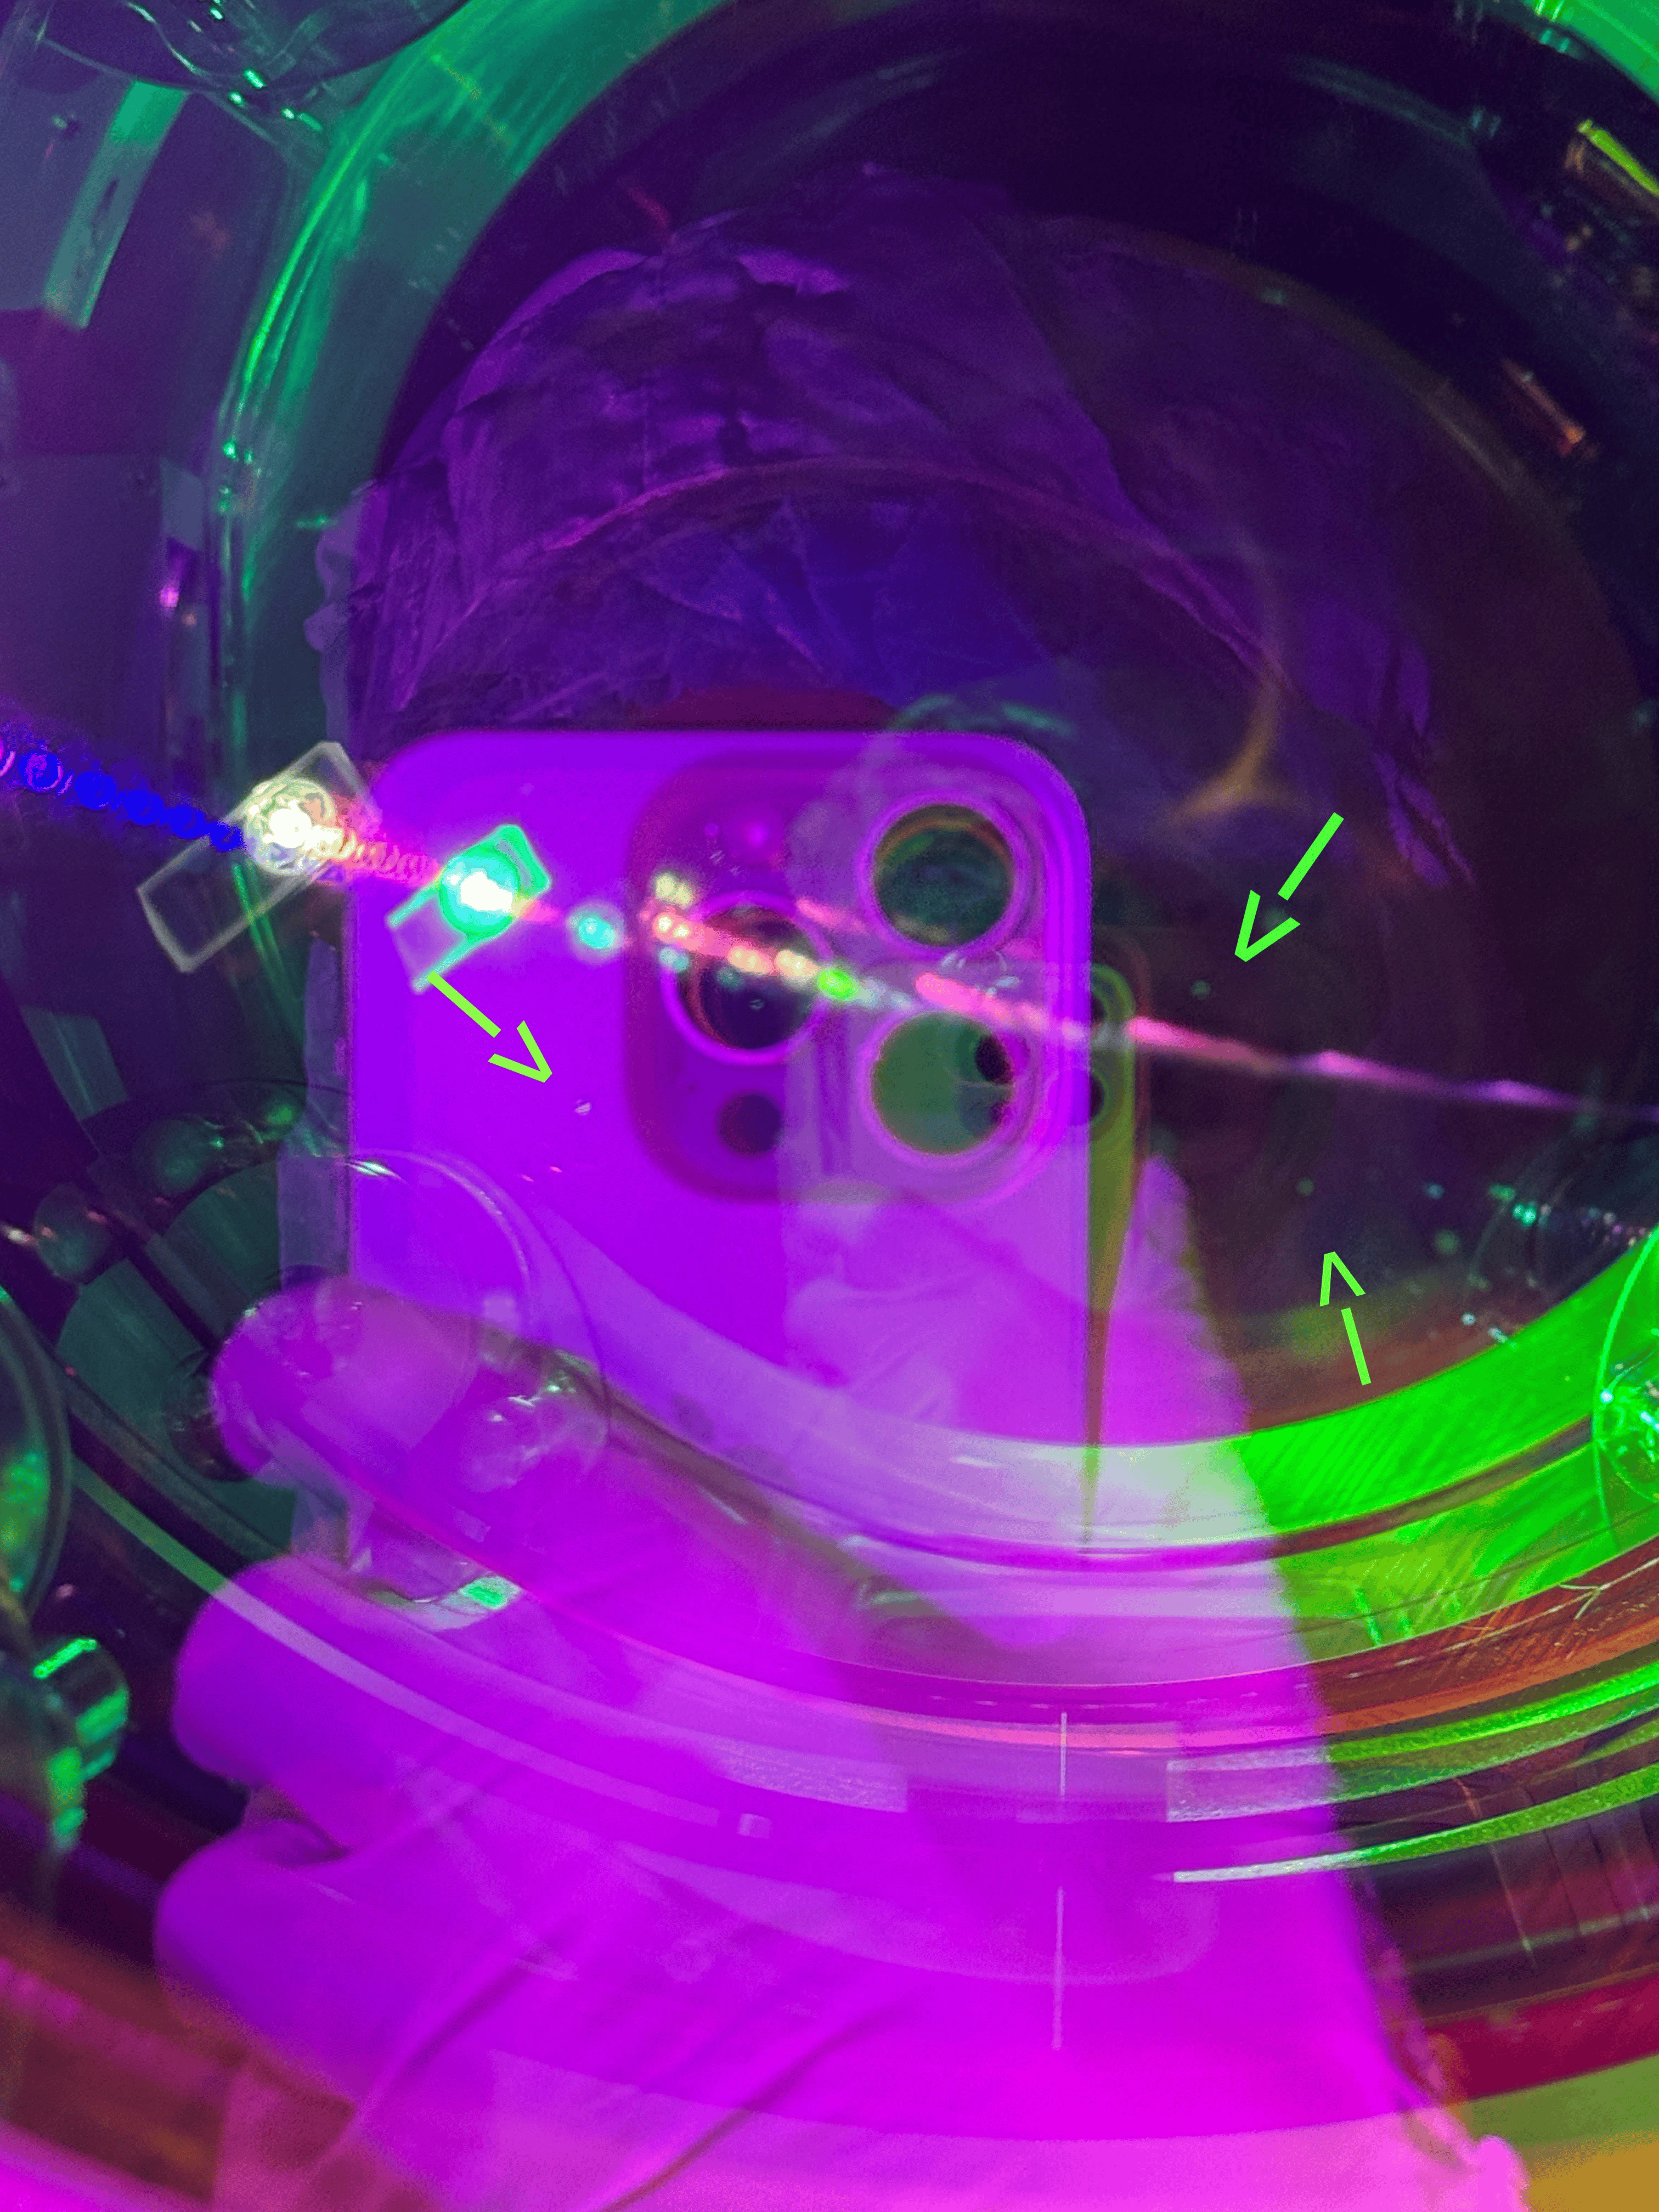
Here the pictures of the spots found yesterday.


Some NN geophones have been disconnected and displaced in preparation for the crane maintenance scheduled for Tuesday the 28th.
Some NN geophones and microphones have been disconnected and displaced in preparation for the crane maintenance scheduled for Tuesday the 28th.
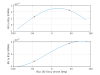
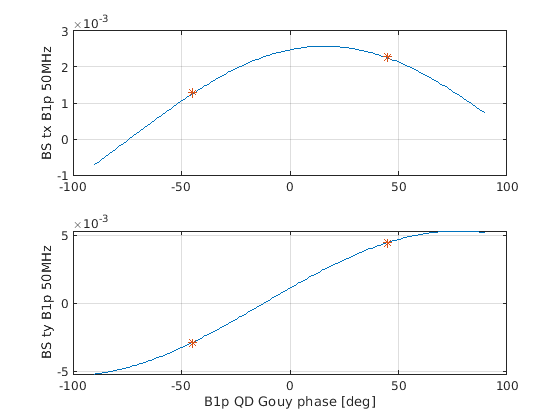
In order to measure the optimal gouy phase for the BS sensing I' ve measured the sensing matrix between Sc_BS_MAR_TX_CORR @ 3.1 Hz (for tx) and 3.7Hz (for ty) in the last 200sec of Carm null 1f (having a statistics of 200 days locks since the January 2025) and ASC_B1p_QD1/2_50MHz_H/V_I (in which we have the automatic tuning of the phase to minimize the even modes).
The result is visible in Figure 1, considering (TBC) that QD1 has -45 deg of gouy phase and QD2 45 deg (if this is wrong the fit has to be redone).
Then it comes out that the optimal gouy phase is 78 deg for ty and 16 deg for tx.
The following report has been submitted to the On-call interface.
On-call events -> Air Conditioning
Title: North End Chiller Alarm
Author(s): romboli
| Called at: 00:35, 23-07-2026, by: Alarm or monitoring system |
| Remote intervention: Started: ; Ended: |
| On-site intervention: Started: 02:45, 23-07-2026; Ended: 03:30, 23-07-2026 |
| Status: Resolved |
| Operator when issue resolved: None |
Details:
I received three high temperature alarm from North End Building. I did not take immediate action because the readings were not excessively high. When I arrived on site, the DMS showed that the temperature was in normal limit (green flag). I couldn't check remotely because the internet is down since yesterday. At the North End Building the chiller was working properly and the temperature inside the hall seemed right. Then alarms ceased.
* Note that any files attached to this report are available in the On-call interface.
While inspecting the WI payload we noticed three spots on the AR surface of the mirror. Looking through the CP, we can see two spots in the right lower direction from the center and one is located in the left lower direction from the center. All of them are within a range of 10 cm from the center.
Some remarks: the spots do not look like point absorbers. PAs are usually sub-micrometer scale and these are round cloudy mm-scale spots. A cleaning operation would be very risky and we decided not to touch the mirror, also motivated by the fact that the spots are NOT located in the HR surface of the mirror.
Some pictures will follow when the network is back.
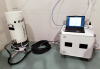
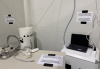
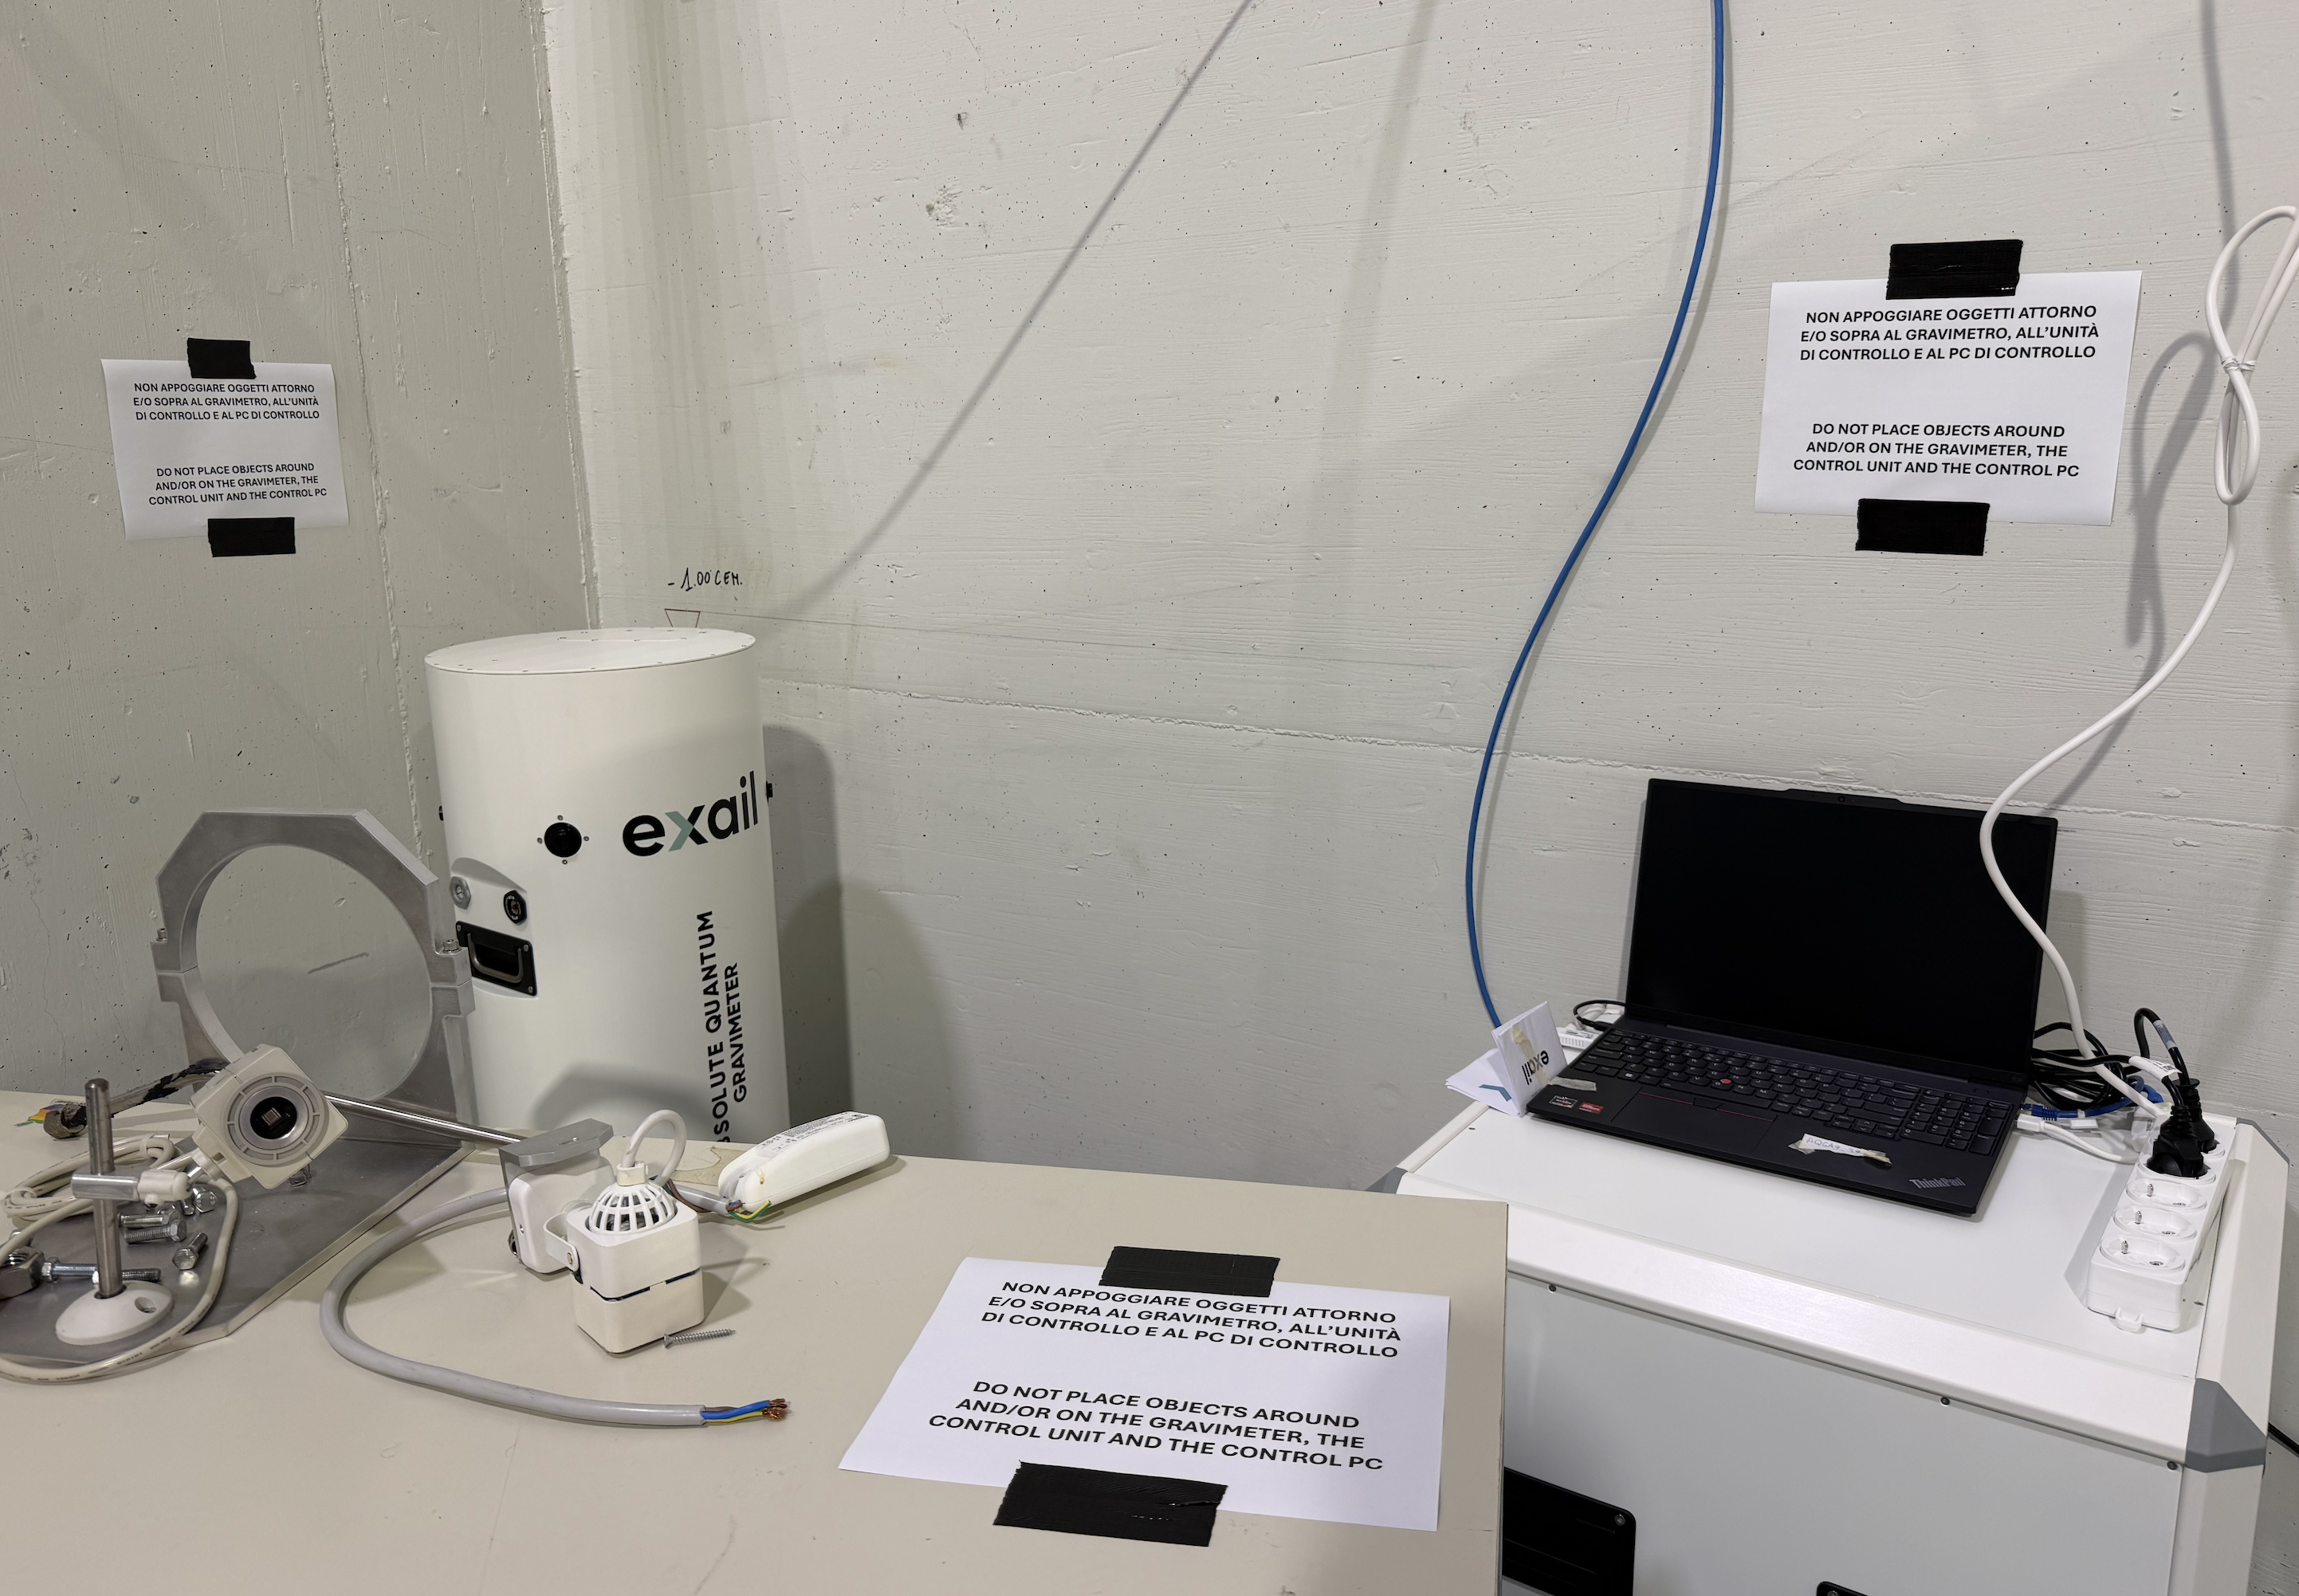
This morning starting from 11:00 LT me, Rossi Fabrizio and INGV people (Greco Filippo, Messina Alfio and Mirabella Luca) mooved the Absolute Quantum Gravimeter from 1500W Fiber Lab to WEB experimental Hall as scheduled (#69223).
The packaging procedures were completed at 12:00 LT. Then, we mooved the boxes up to WEB and we installed it along the south wall of the building (Fig 1). The hardware installation was completed around 13:30 LT.
We left WEB at 13:45 LT and we went back to the building at 14:45 LT.
We encountered some issues with the local interent connection in the morning (not related with the loss of GARR connection reported by IT Service), the problem has been soved by IT department in the afternoon.
We completed the installation at 15:30 LT with the Gravimeter fully operational locally, once the GARR connection will be restored it will be able to be reached from outside EGO.
The Gravimeter, its control unit and the Computer must not be touched, advicing signs have been attached nearby.
During the WI payload works we also verified that the PAM system is well aligned with the mirror center. The led of the PAM system on the tower base was swicthed on and Ettore from inside the tower verified that the led beam was reaching the same place it was before. The baffles around the payload were taken as reference for this check.
PAY: WI payload balancing and final tuning (#69411);
VAC: WI tower closing and evacuation;
Absolute Quantum Gravimeter installation at west end building (#69411);
In the morning we completed the works concerniing the WI payload installation.
The balance was done and the mirror reuslted misaligned WRT the maiornette, similarly to the NI case, by non-negligible values.
TY= +3700 urad ; TX= -500 urad ; Tz= +2000 urad. The OpLev sensing will be reset later on.
The system behaves normally.
The flange has ebeen closed and the pumping is goin on. Pictures will follow.
Excellent ciollaboration by all the teams involved: VAC, Clean-Operaiton, in-vac-Cabling
We noticed two spots on the rear face of the mirror. They appeared as the first contact was peeled-off.
Later on Suzanne and Eugenio took some pictures to verify the situation. It has been decided not to touch. Another dedicated entry will follow.
During the WI payload works we also verified that the PAM system is well aligned with the mirror center. The led of the PAM system on the tower base was swicthed on and Ettore from inside the tower verified that the led beam was reaching the same place it was before. The baffles around the payload were taken as reference for this check.
While inspecting the WI payload we noticed three spots on the AR surface of the mirror. Looking through the CP, we can see two spots in the right lower direction from the center and one is located in the left lower direction from the center. All of them are within a range of 10 cm from the center.
Some remarks: the spots do not look like point absorbers. PAs are usually sub-micrometer scale and these are round cloudy mm-scale spots. A cleaning operation would be very risky and we decided not to touch the mirror, also motivated by the fact that the spots are NOT located in the HR surface of the mirror.
Some pictures will follow when the network is back.
Here the pictures of the spots found yesterday.
Everything is fine except one connector (U1) not well connected at the level of the F7 cage, problem fixed.
In case someone in the future wants to connect the opening and closing of work permits. The NI tower permit to work has been closed using an independent logbook entry https://logbook.virgo-gw.eu/virgo/?r=69393