PAY: WI mirror coil cabling check (#69494);
ISC: etalon set point change (#69495);
ISC: DRMI lock recovery;
Arm guy phase measurement, in progress;
The swap of the two LNFS done on July 15th has been done without exchanging the eth address of the devices. As a consequence, while restarting the automation, it was trying to communicate with the old address, thus inverting the {6, 8, 56 }MHz signals with the {22, 81}MHz. We stucked at the Fmoderr state of the INJ node, untill we swapped the ethernet cables of the two LNFS (to be noted: it seems there is the possibility to swap the ports directly into the configuration file of the LNFS server.
Because of this, we found a peculiar corner case of the FmodErr loop: after the exchange of address, the LNFS_FREQ_3 was not anymore setted on 56MHz (was instead the old 81). The check of the Fmod, however, is based on a 56MHz demodulated channel, that gave 0 correction to the loop. Eventually, no change (both MC_Z or LNFS) has been requested, and the 8Mhz frequency has not been changed (and so the 6 and 56, which are automatically updated once the 8 changes).
As a result, this morning we didn't have any modulation at 56MHz. The problem has been solved applied a reset of the 8MHz.
The Fmod loop will be updated consequently.
In order to better center the corrections for the Etalon control in the actuator dynamics we have changed in a 4 days ramp
NI to 20.1 and WI to 19.6
we report on additional results of the analysis:
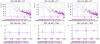
About the acoustic bump at 19 Hz - we made two additional observations that support the hypothesis that is is an acousting mode of the INJ lab room (aka, laser lab bench room):
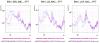
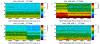
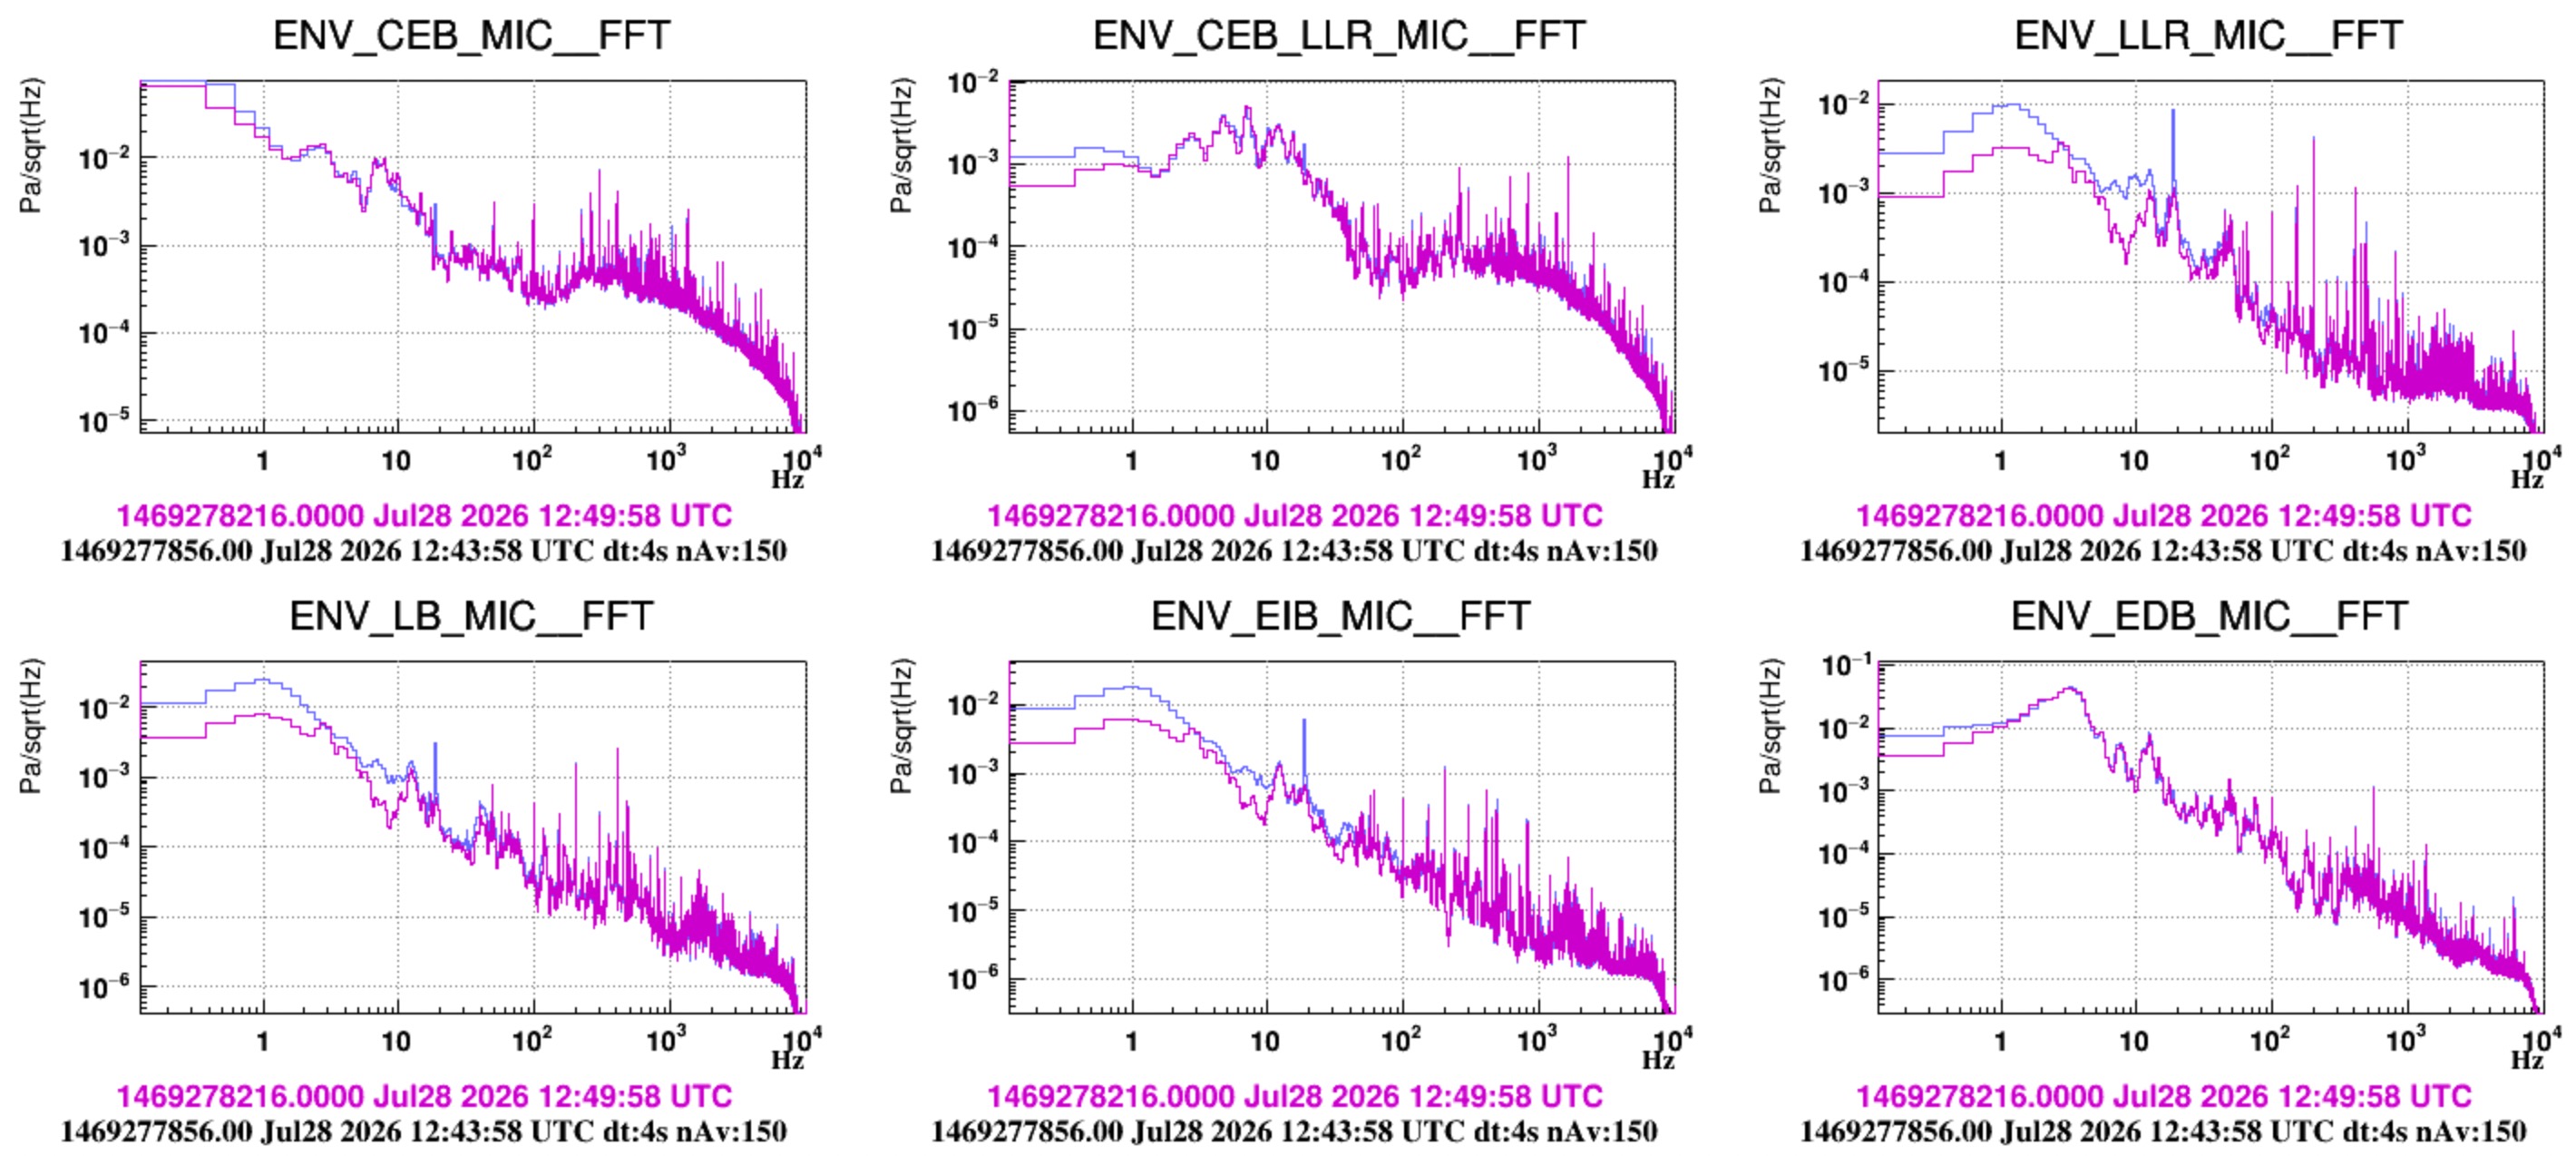
- Figure 1: while the atrium door was open, the 19 Hz acoustic mode shifted to 20 Hz. The shift-up is a bit counter-intuitive. A similar observation was done when we in Sept 2024 we did the test of opening this door, but with the HVAC on (https://logbook.virgo-gw.eu/virgo/?r=65126). It seems that this is the acoustic mode that we excided when when repetitively closed and opened opened the atrium door. It is interesting to check if this up-shifting behaviour is reproduced by the ANSYS simulation that Lorenzo is implementing.
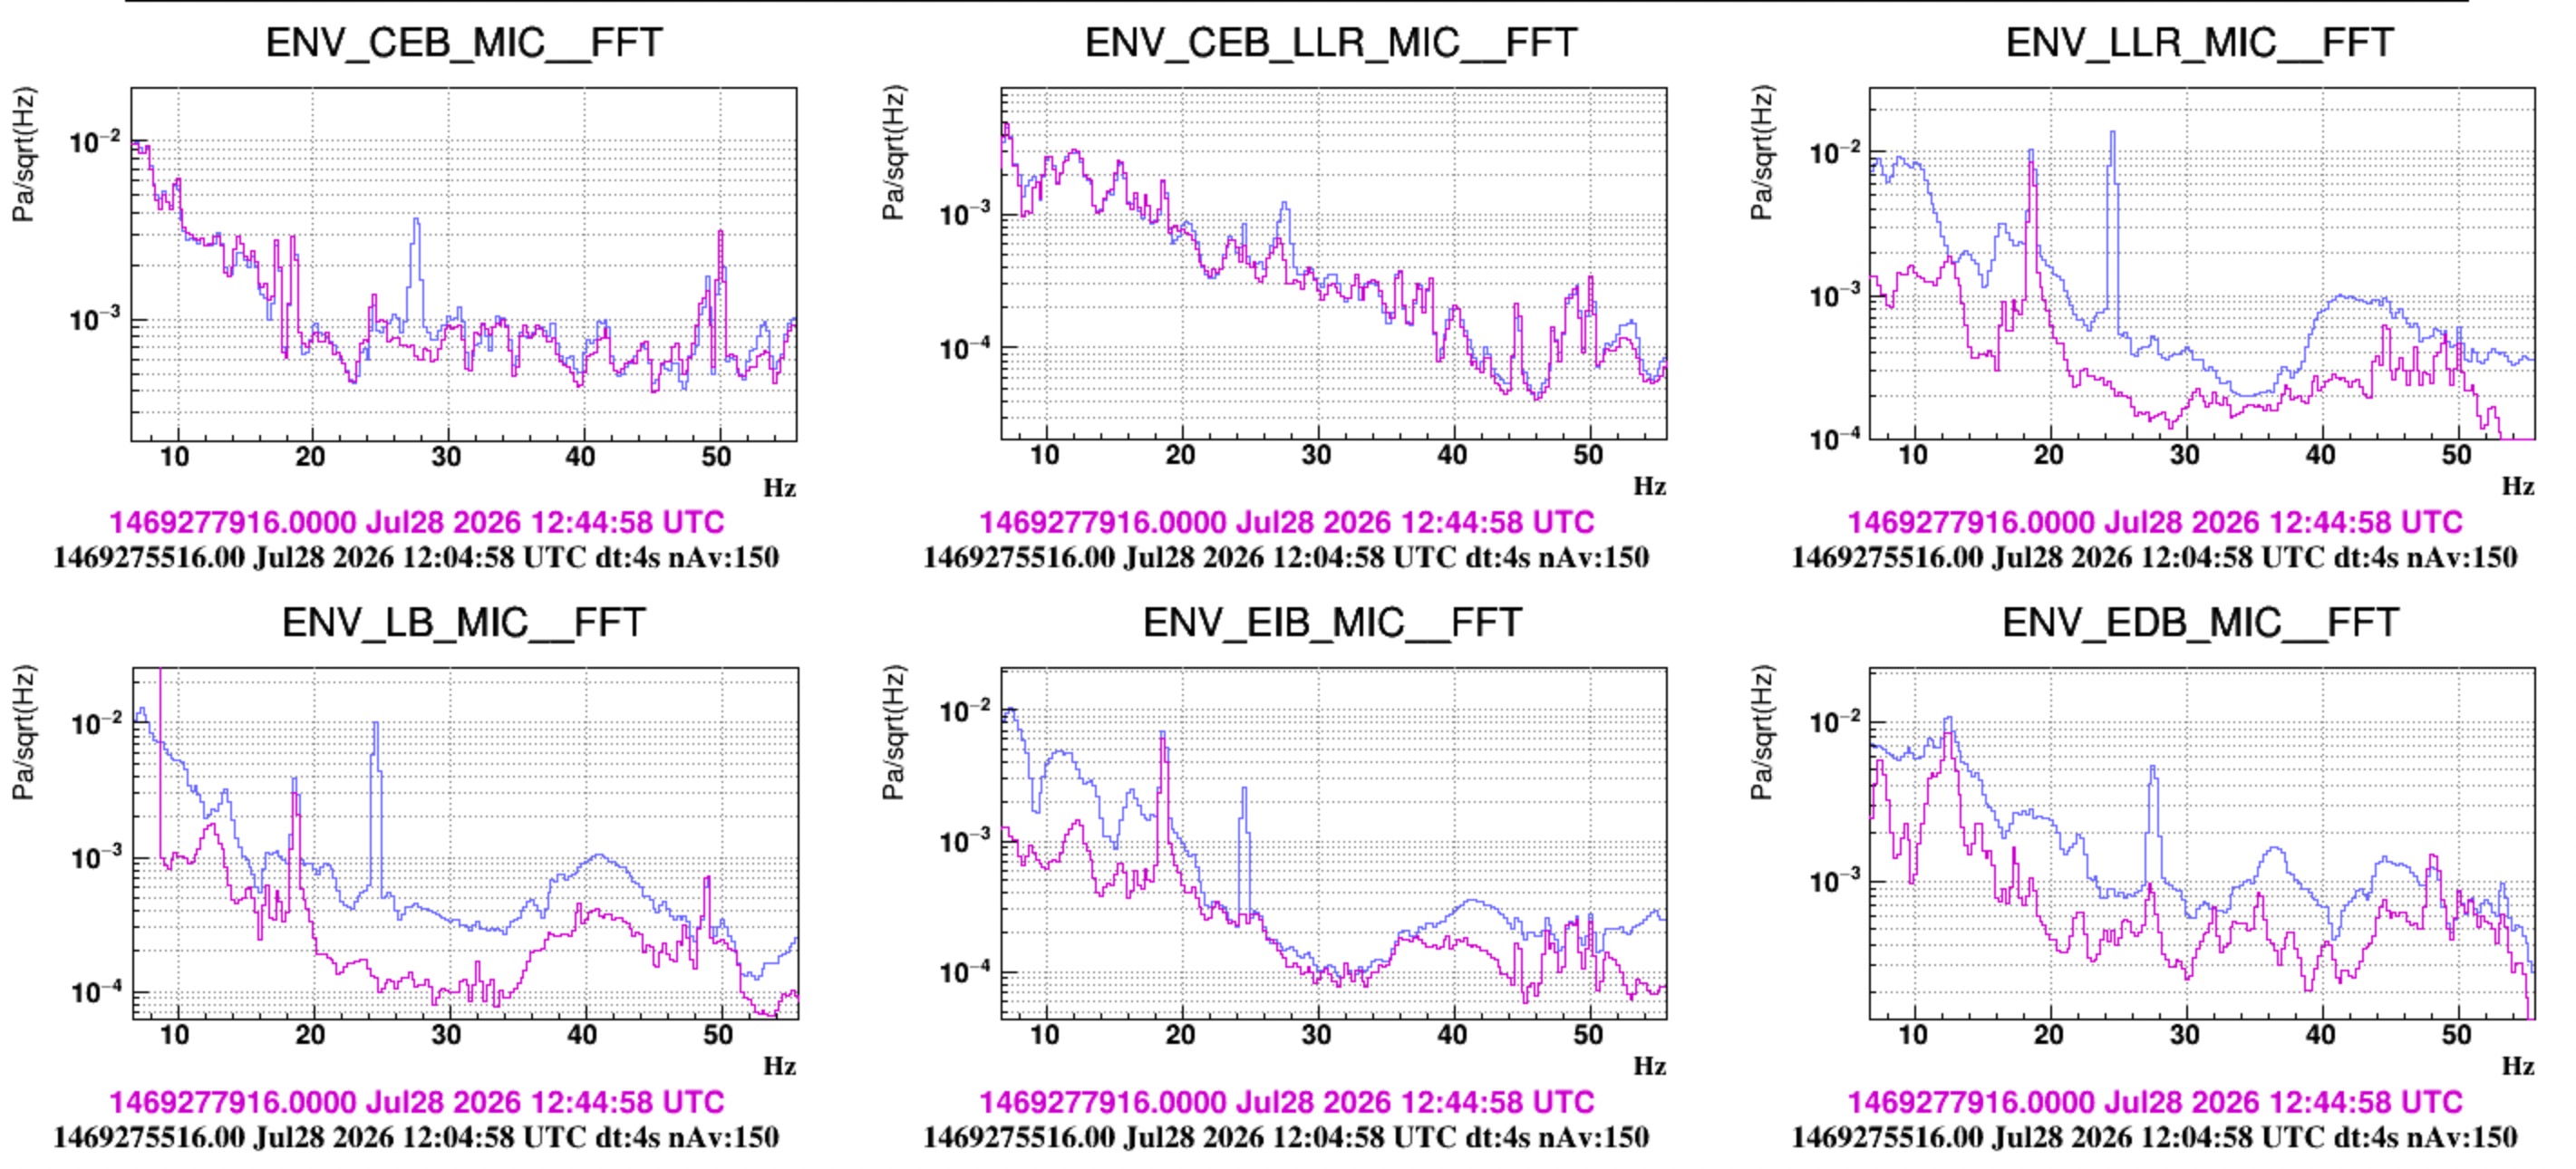
- Figure 2: shows that this peak's amplitudes changes by a factor 2 at the location of the three microphones inside the INJ room. It is the larges largest in the NW corner of the room. This change of amplitude within the room is a characteristic of acoustic modes, which also could be cheched with a simulation. We can also notice that the amplitude of the 12 Hz instead is very similar in the 3 positions.
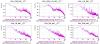
About acoustic peaks associated to the INJ and DET HVAC fans: 24 Hz and 27 Hz
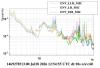
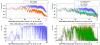
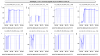
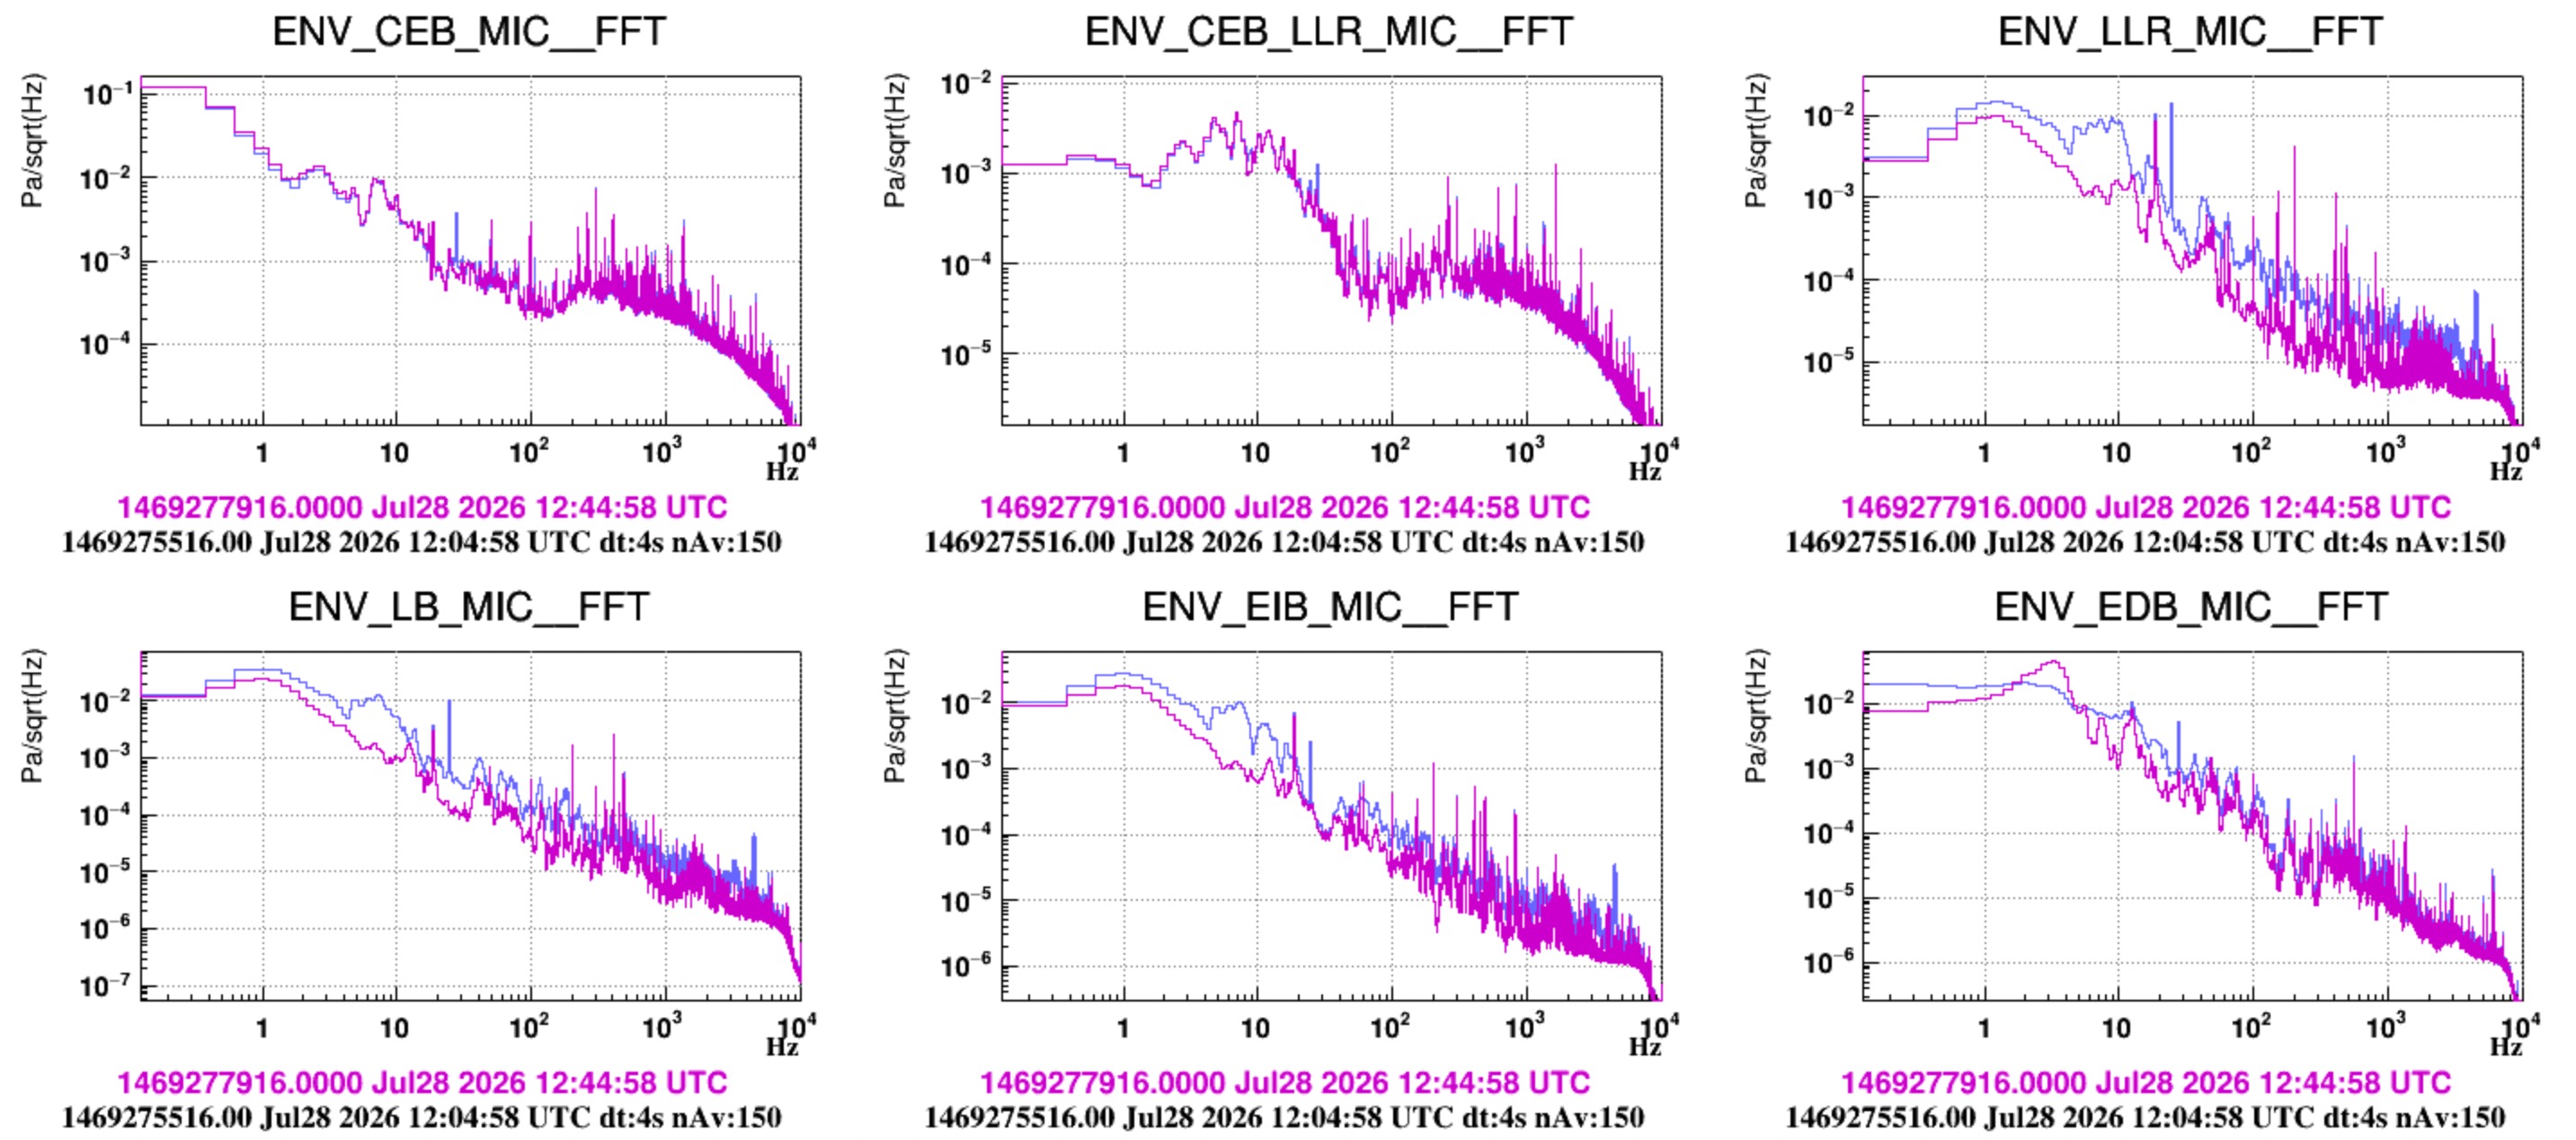
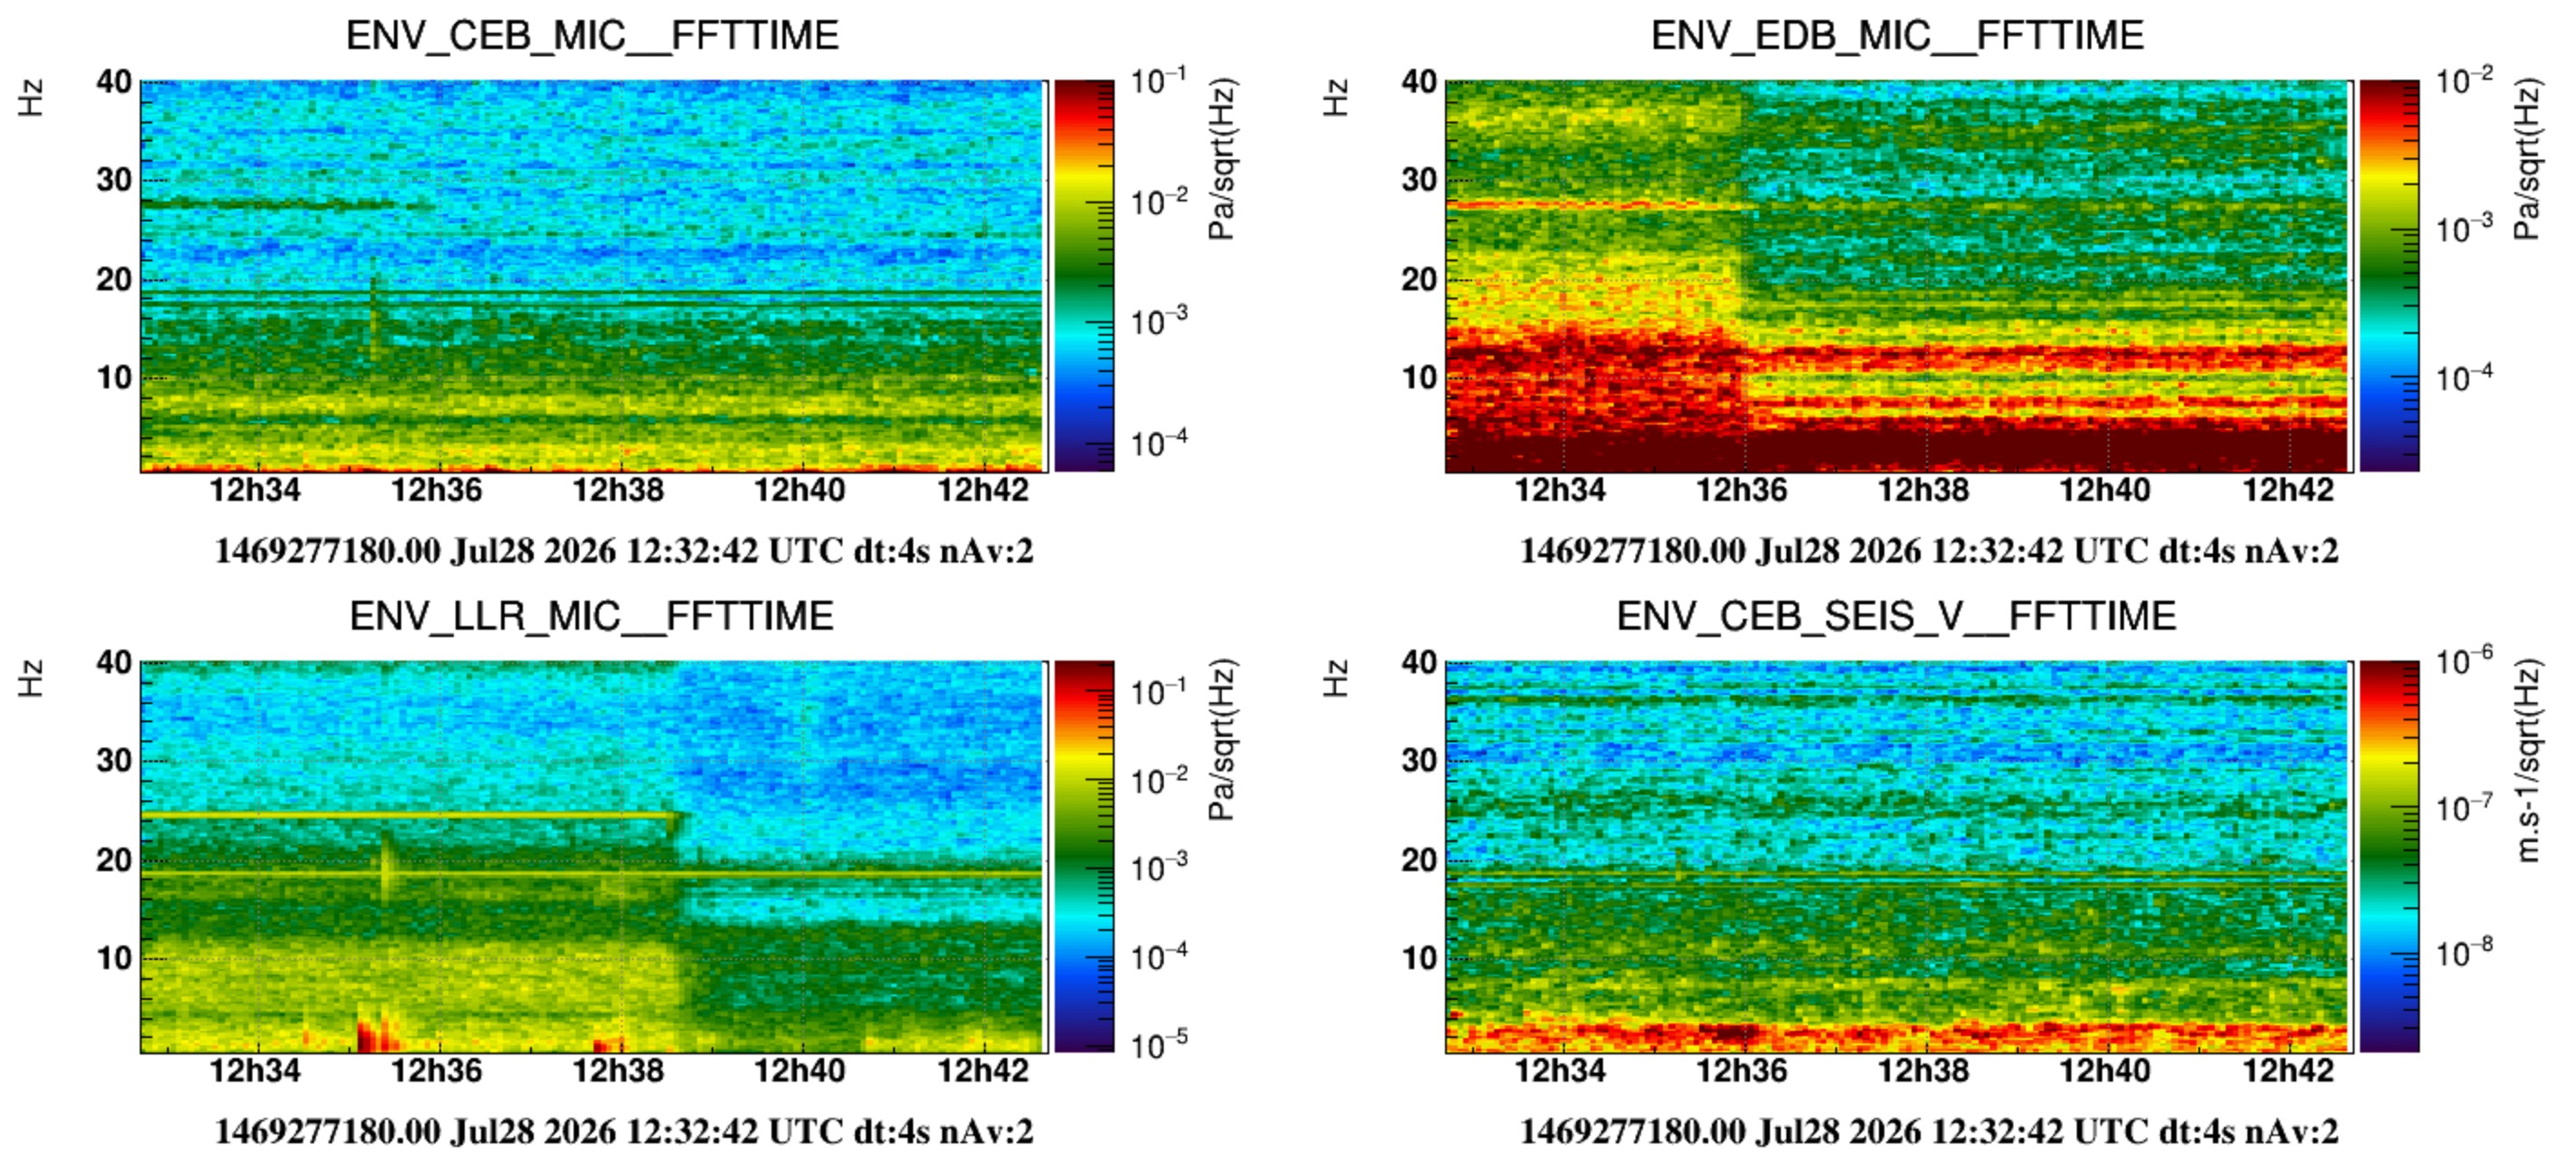
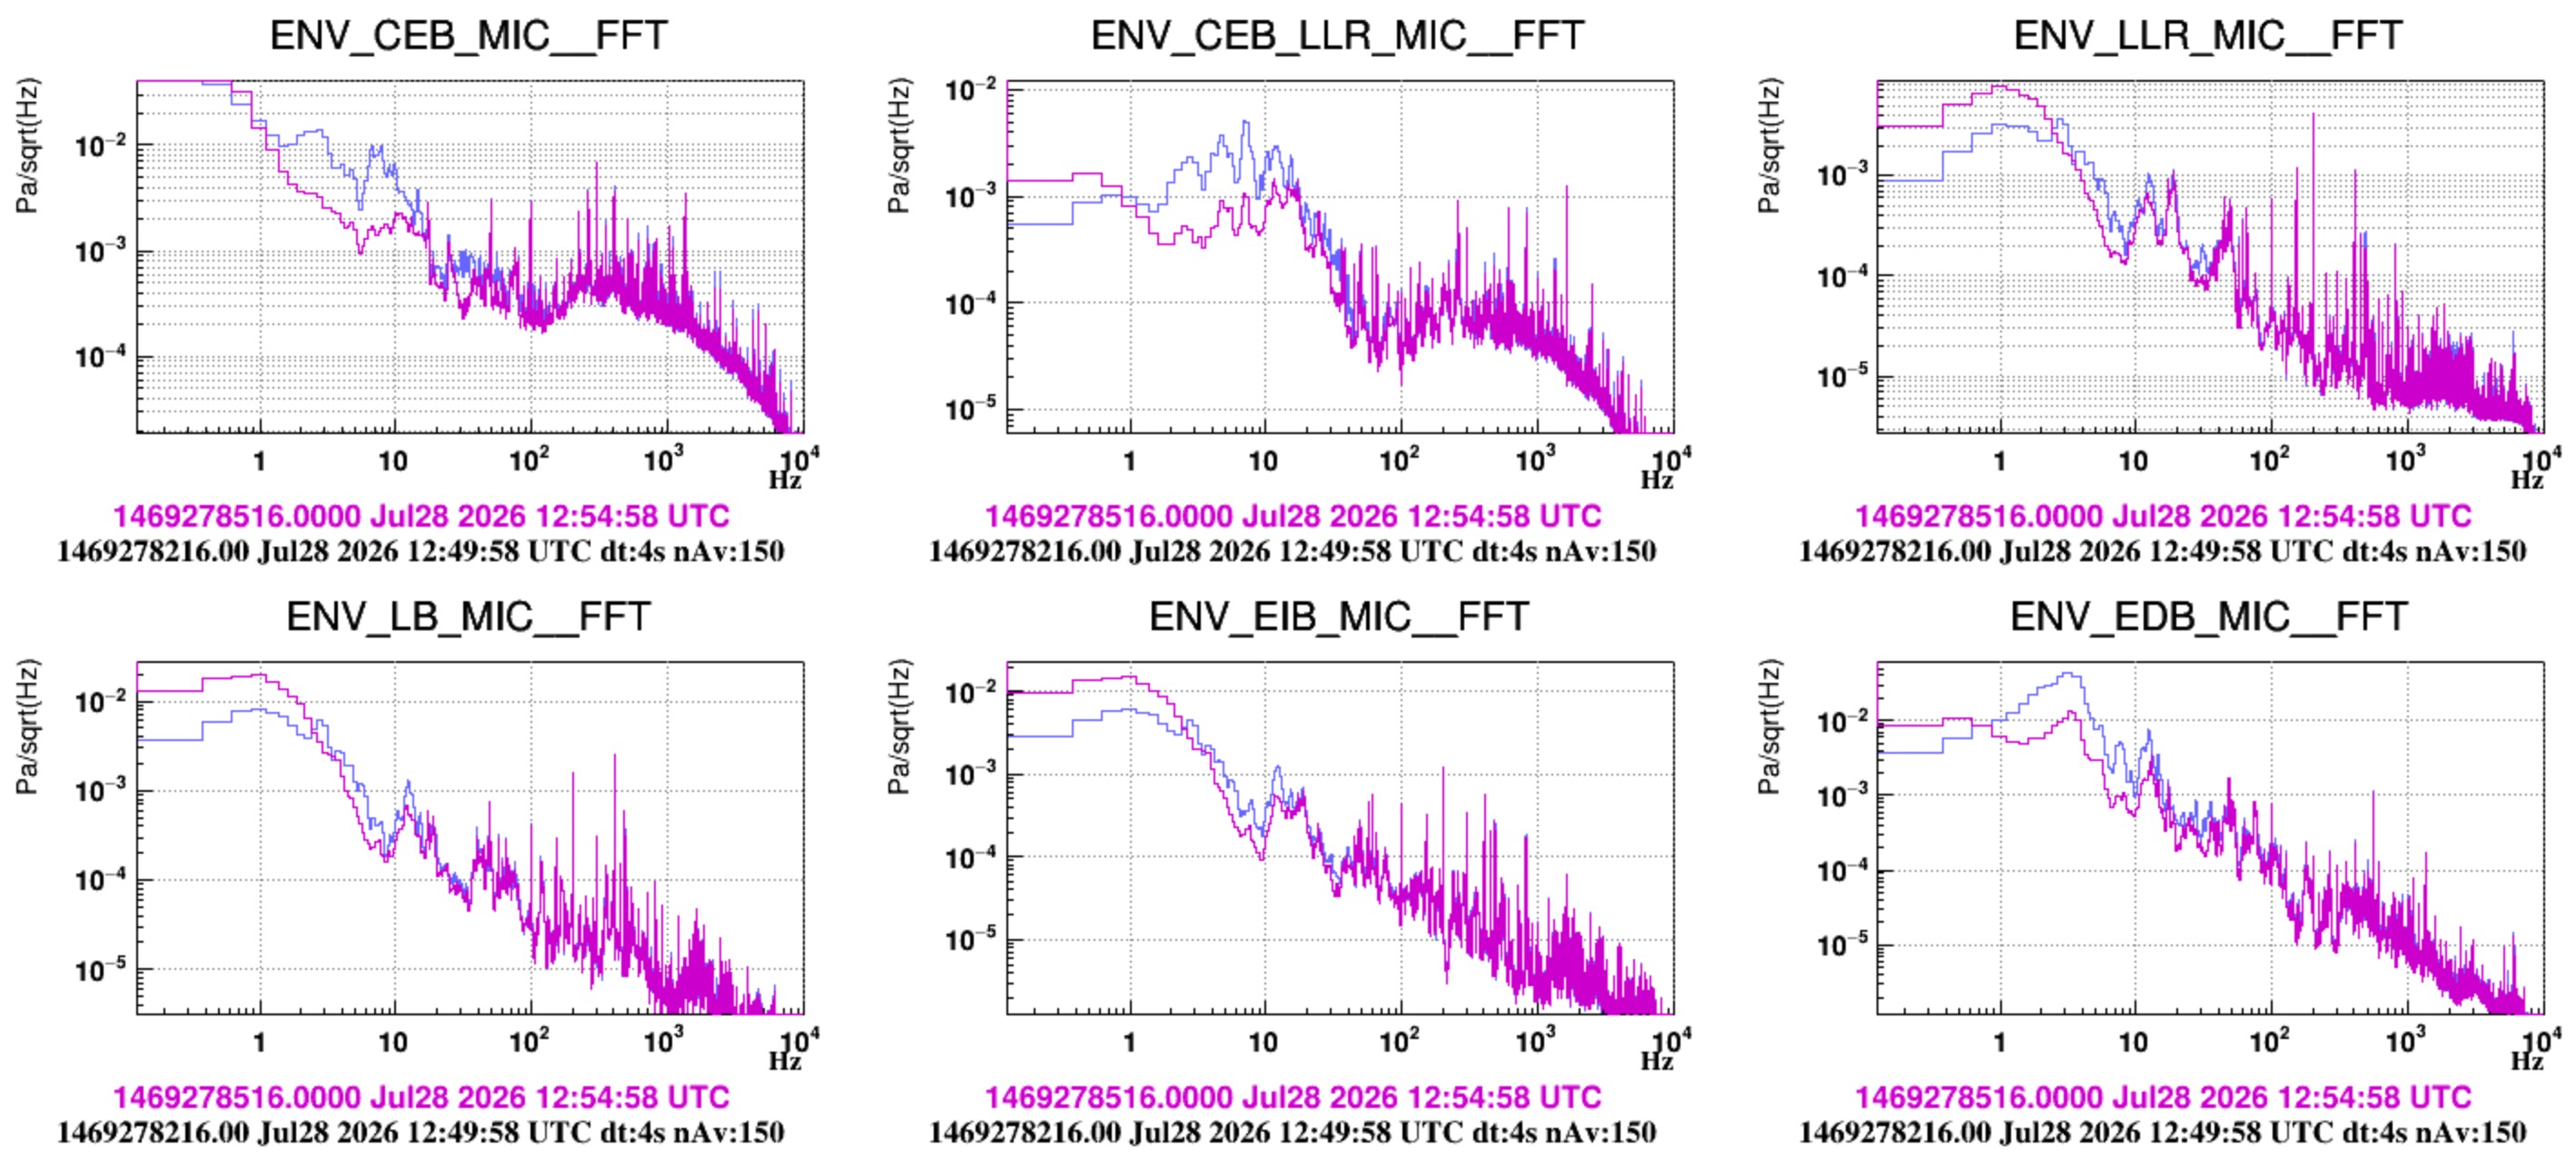
- Figure 3 shows the switch off of "just" the INJ and DET HVAC. The two lines disappearing at 24 Hz and 27 Hz are associated to the frequency of the outlet fan of the INJ and DET HVAC, respectively. Interestingly, they have roughly similar amplitude inside the respective labs, e.g. of the order of 0.01 Pa/sqrtHz. But, the 27 Hz is heard clearly inside the CEB HALL (also by the ENV_CEB_LLR_MIC that we positioned close to the EER). Figure 4 shows the time of disappearing lines.
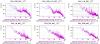
About the acoustic peak at 12 Hz - this peak is associated to the main hall, it could be an acoustic mode of the hall
- Now we look at how the noise further progressively reduces inside the INJ room and in the DET lab when switching off the HVAC of the CEB Clean Rooms and finally that of CEB main hall. The INJ and DET HVAC are already off.
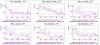
- Figure 5: switching off CR HVAC. No significant effect is seen in the main hall and inside the DET lab. Some reduction of noise below 10 Hz meaning that CR is actually the main source of noise below 10 Hz (after the INJ HVAC itself). Also loud (aroud 0.01 Pa/sqrtHz) is the 18.6 Hz line associated to the CR HVAC outlet fan.
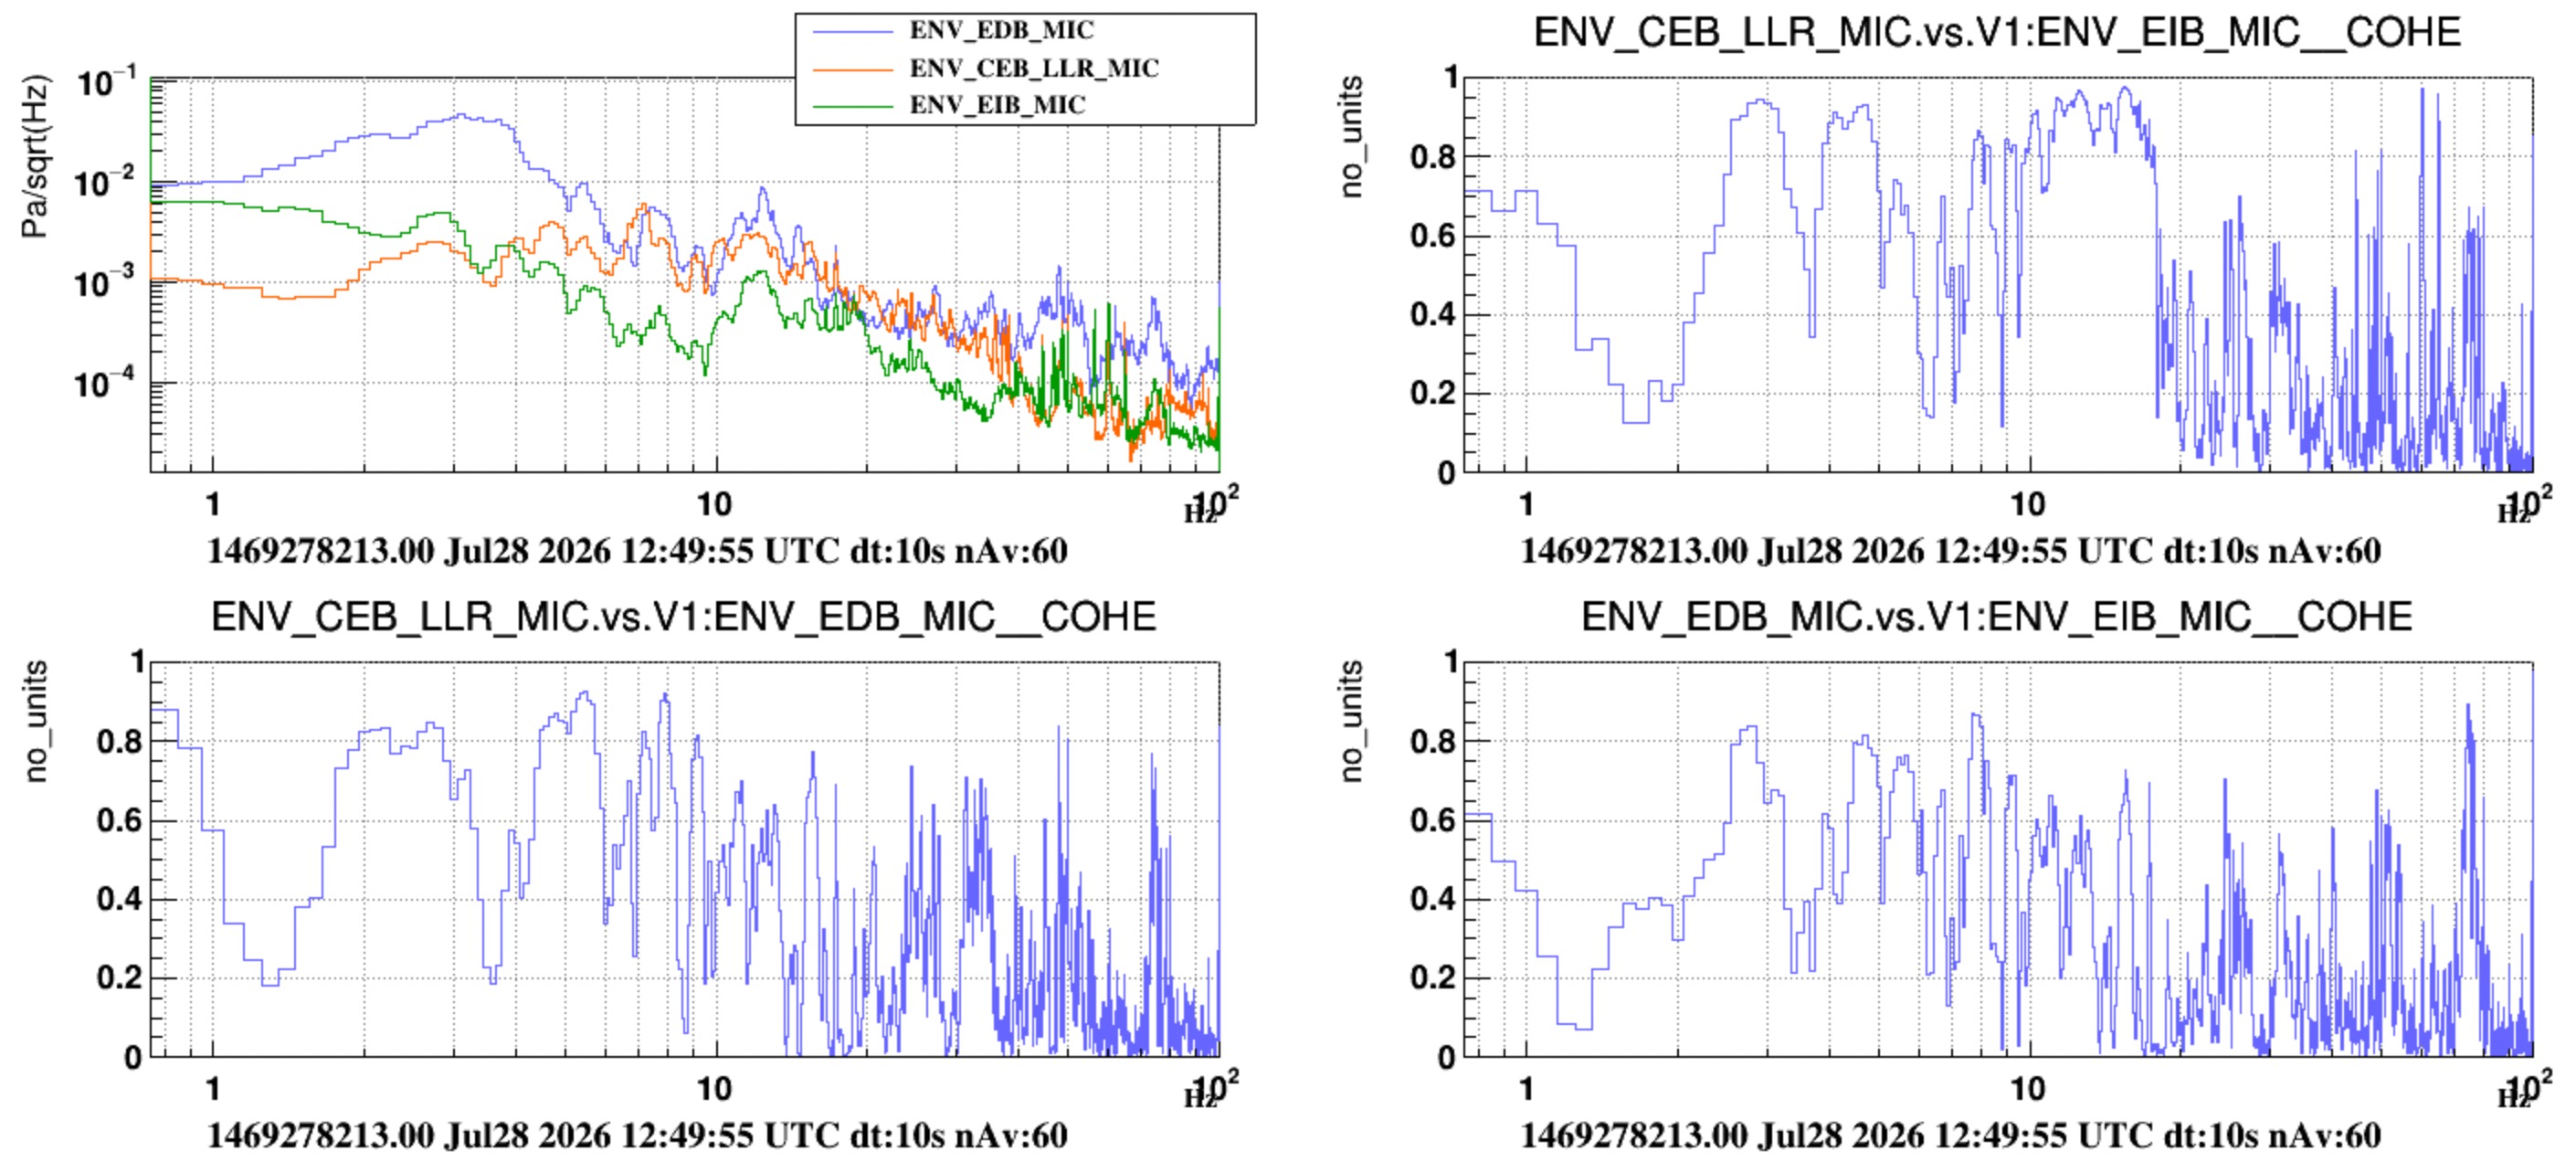
- Figure 6: switching off HALL HVAC. The noise reduces below 10Hz in the hall, in DET lab and in INJ Lab. Noticeably an acoustic peak at 12 Hz reduces significantly in all microphones (but it does not disappear). The microphone close to EEroom clearly show a set of well shaped peaks at roughly 2.5, 4.5, 7 Hz, whose amplitude reduced, but did not disapear. These might be also acoustic modes of the hall (?)
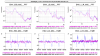
- Figure 7: the 12 Hz peak is coherent between EDB, EIB and the Hall.
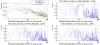
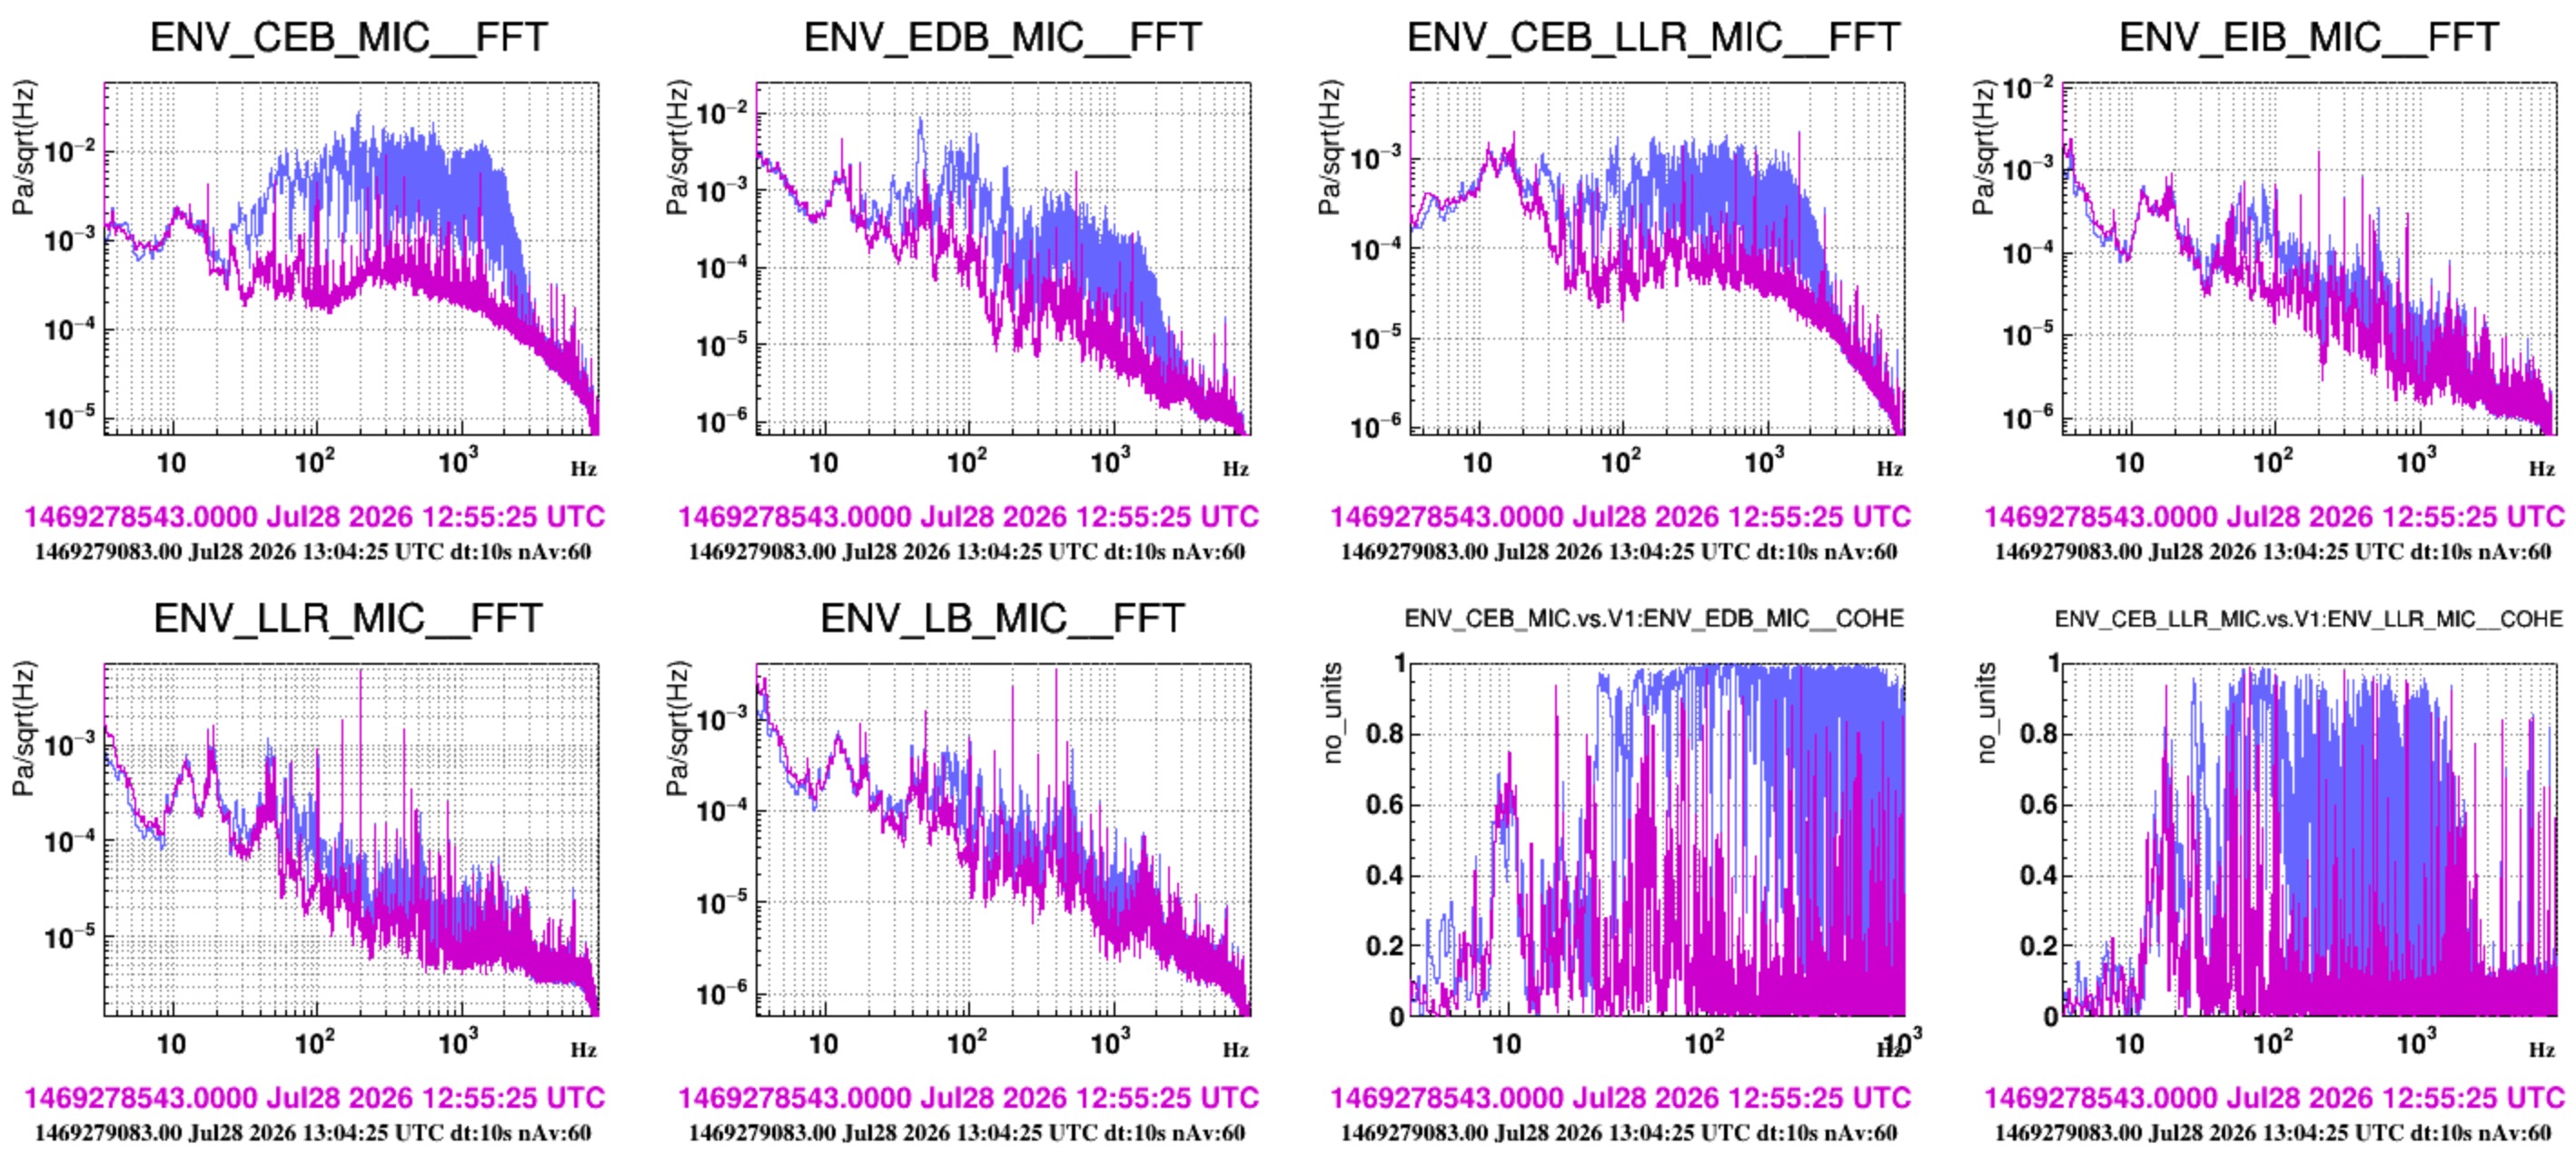
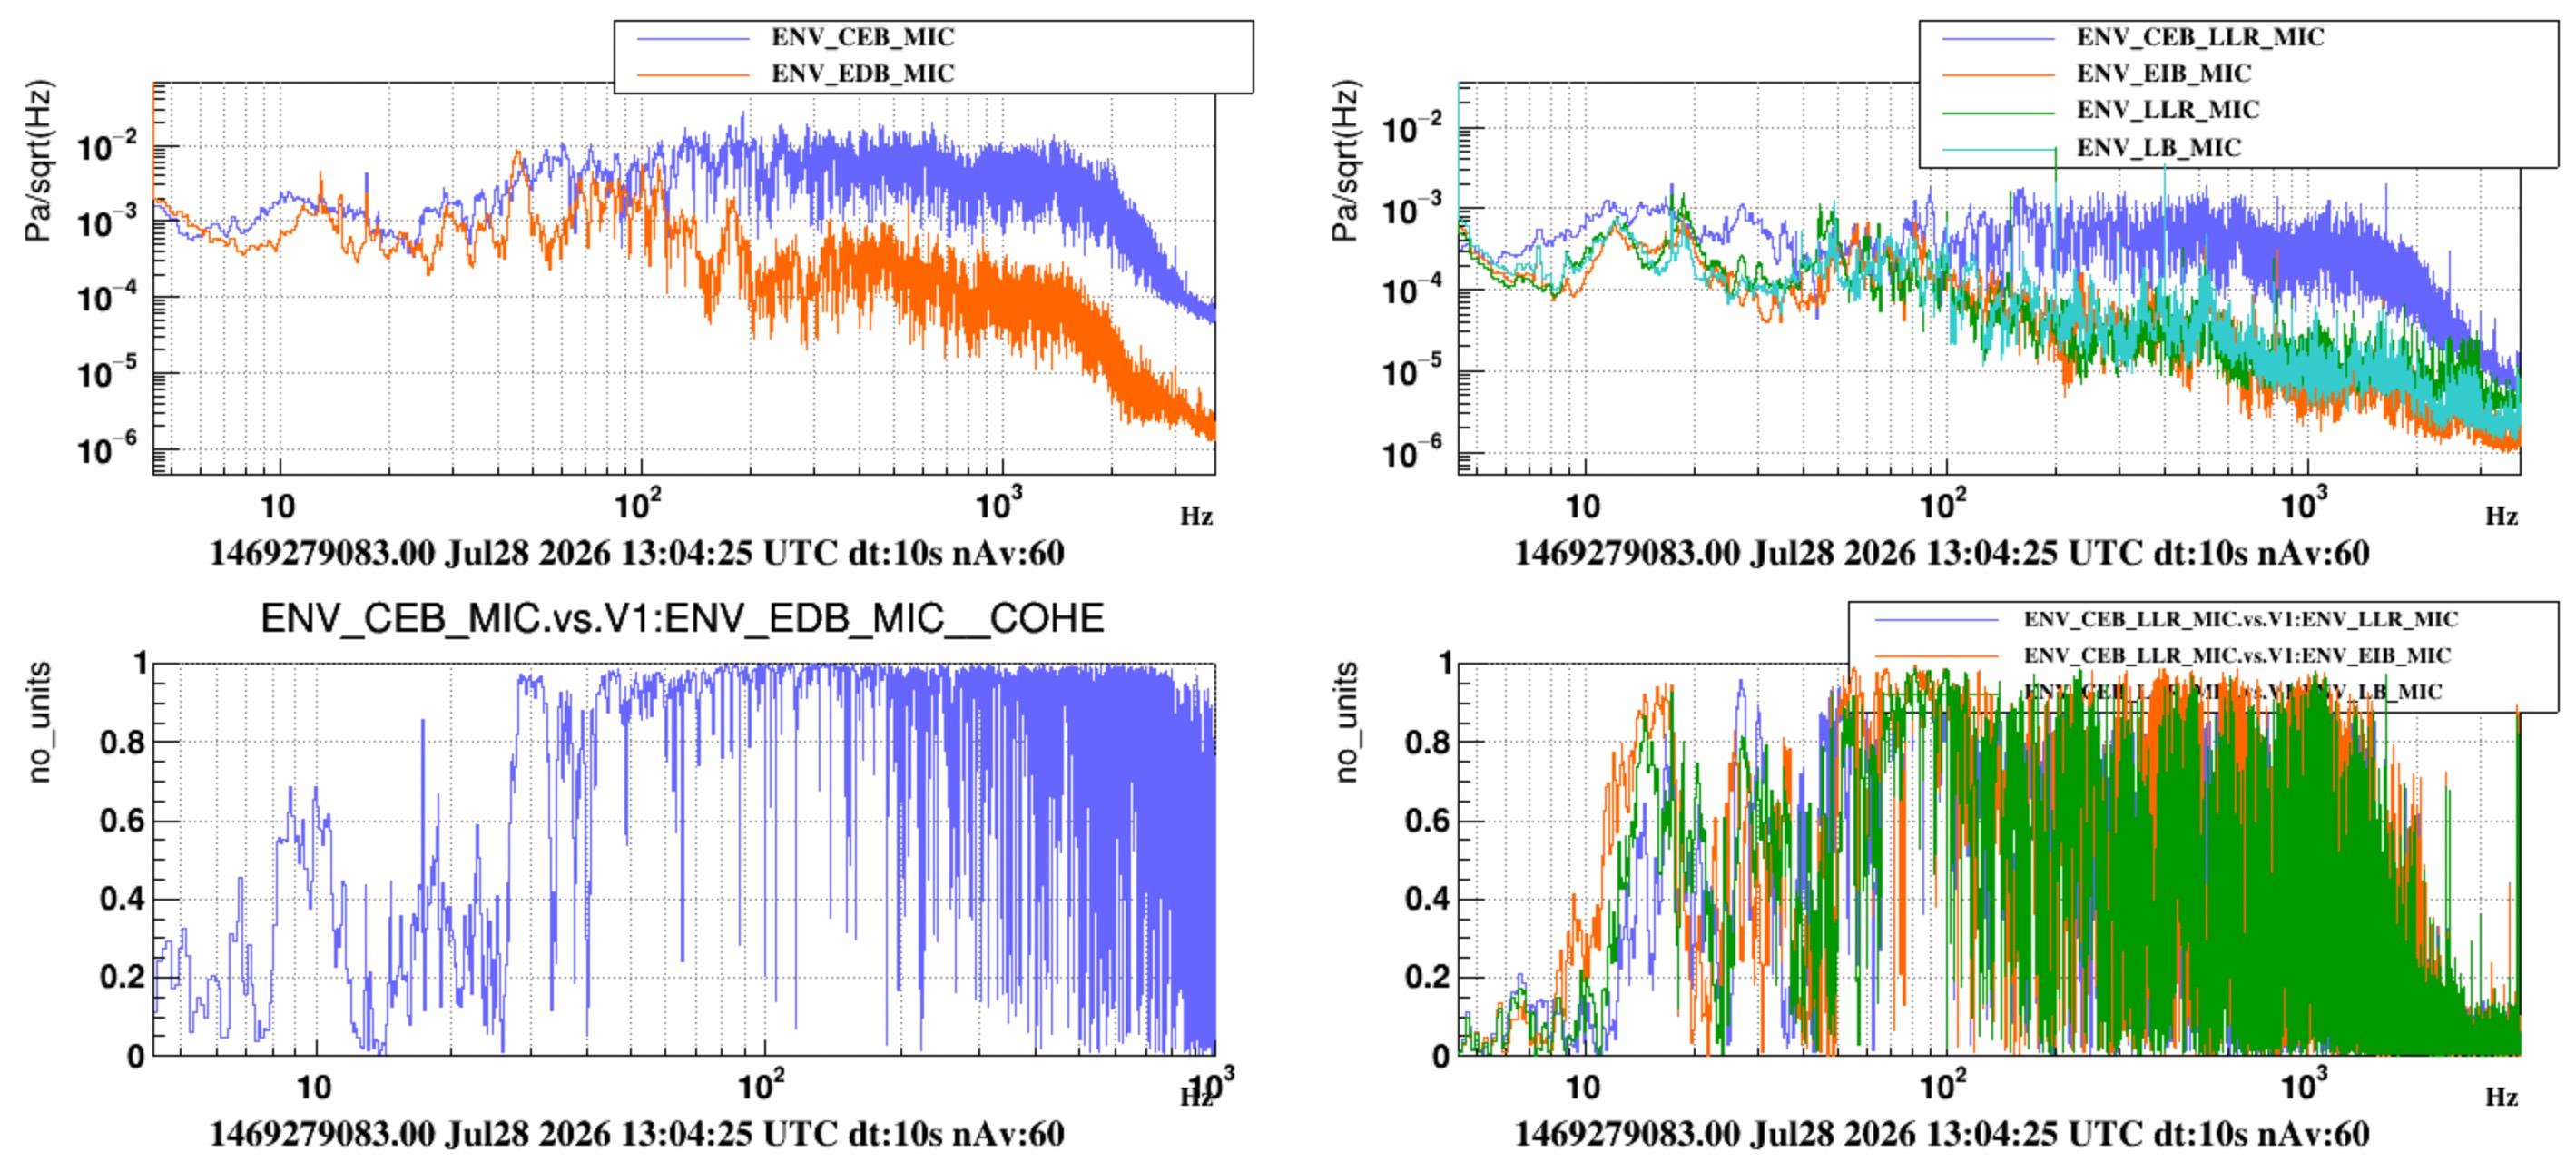
Sound transmission measurement (a rough look) - we injected white noise with one loudspeaker in DET terrace while all HVACs were off.
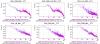
- Figure 8 - shows the injected noise. It overcome the quiet level starting from about 30 Hz.
- Figure 9 - compares ASD spectra during the injection of microphones inside and outside DET lab (left) and inside and outside INJ lab (right). Also shown is the coherence. Roughly we see that effective isolation occurs above 100 Hz. These data should be further analyzed, and possibly injections repeated adopting standard techniques, as done for example in https://logbook.virgo-gw.eu/virgo/?r=67440.
ITF found DOWN and IN UPGRADING Mode with only the north arm locked.
All times are UTC.
08:04 ALS arms realign (Boldrini, Lagabbe, Spinicelli).
10:30 ALS Recovered, Automation put back in operation, test to lock arms IR & Green via ITF_LOCK ongoing.
The automation has been restarted (#69477);
The recovery of the ITF is ongoing.
ITF left in COMMISSIONING Mode and DOWN State.
Today I re-enabled the etalon loops, using setpoints just slightly above the current temperatures, just to monitor the corrections:
- NI: 19.98 degC
- WI: 19.49 degC
These setpoints were changed online, and also in the configuration file.
Between yesterday and today we put back in operation most of the automation:
- we saved the new aligned positions for the arm mirrors, and BS;
- we revived all the nodes:
- DET_MAIN needed an update on the B1_PD3 threshold to allow the acknowledgement of the SDB1 shutter being close;
- in ARMS_LOCK we removed any mention of the old FlipMirror_ATR for the old ALS setup, and we added the new one instead; this is done using relay 5 on the TTL_inj process. NOTE: we do not close the flip mirror when ALS is not needed anymore, as we observed today that acting on it makes even the standalone arms to unlock;
- in ITF_LOCK we commented the opening of the Central Heating flip mirrors, as we are not using any TCS laser now;
- from now on any information based on ITF_LOCK is available again (index, monitoring from DMS and so on).
We tested up to LOCKED_ARMS_IR_ALS, we'll continue the recovery in the usual way from now on.
I received notification of WE PCal error via the DMS. The power on the Rx sphere is very unstable and goes close to 0. This must be related to the alignment of the WE mirror, which results in the PCal reflected beam going outside the sphere input port.
I have switched off the Pcal beam so the beam does not move around on the Rx bench. We will switch it on later (probably only on Monday, not being available in the next two days).
The following information summarizes the directory structure and file naming convention for the measurements performed on the NI and WI instrumented baffles.
*** NI instrumented baffle ***
- main directory: /data/prod/envmon/Instrumented_Baffles/NI_tower/
- measurement log/action list: Installation_NI_Instrumented_baffle_16062026.txt
- time-series data: /txt_files/20260616/
- time series file named as: SIG#_BLOCK(ch*).txt
where
#is the measurement (SIG) number reported in the action list;ch1= mono-axial reference accelerometer;ch2= triaxial accelerometer, x-axis;ch3= triaxial accelerometer, y-axis;ch4= triaxial accelerometer, z-axis.
*** WI instrumented baffle ***
- main directory: /data/prod/envmon/Instrumented_Baffles/WI_tower/
- measurement log/action list: Installation_WI_Instrumented_baffle_20260618.txt
- time-series data: /txt_files/20260618/
The same file naming convention described above applies to the WI measurements.
An example MATLAB script (ReadInstrumentedBaffleData) is attached to show how to read the time-series data.
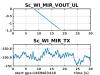
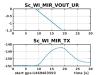
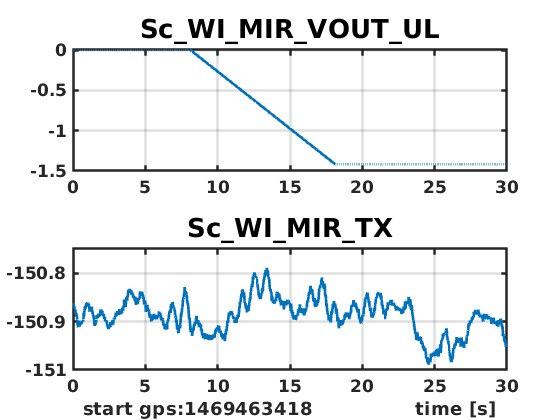
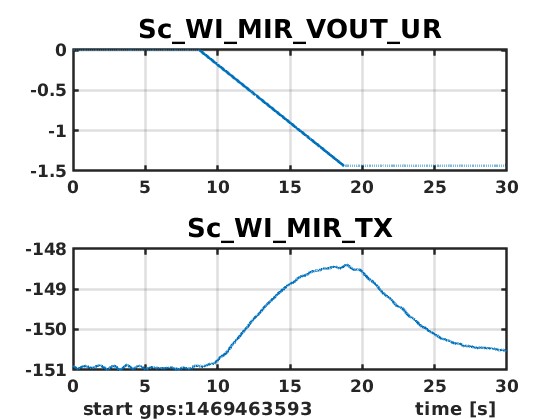
Plots showing the result of WI MIR actuation cheks are attached. If a voltage is generated by UL DAC (seen by the monitor inside the board), no effect is visible on the mirror orientation (fig 1). If the same is done with one of the other DACs, the rotation is well visible (fig 2).
Pcal NE switched on on July 31 at 7:55 utc.
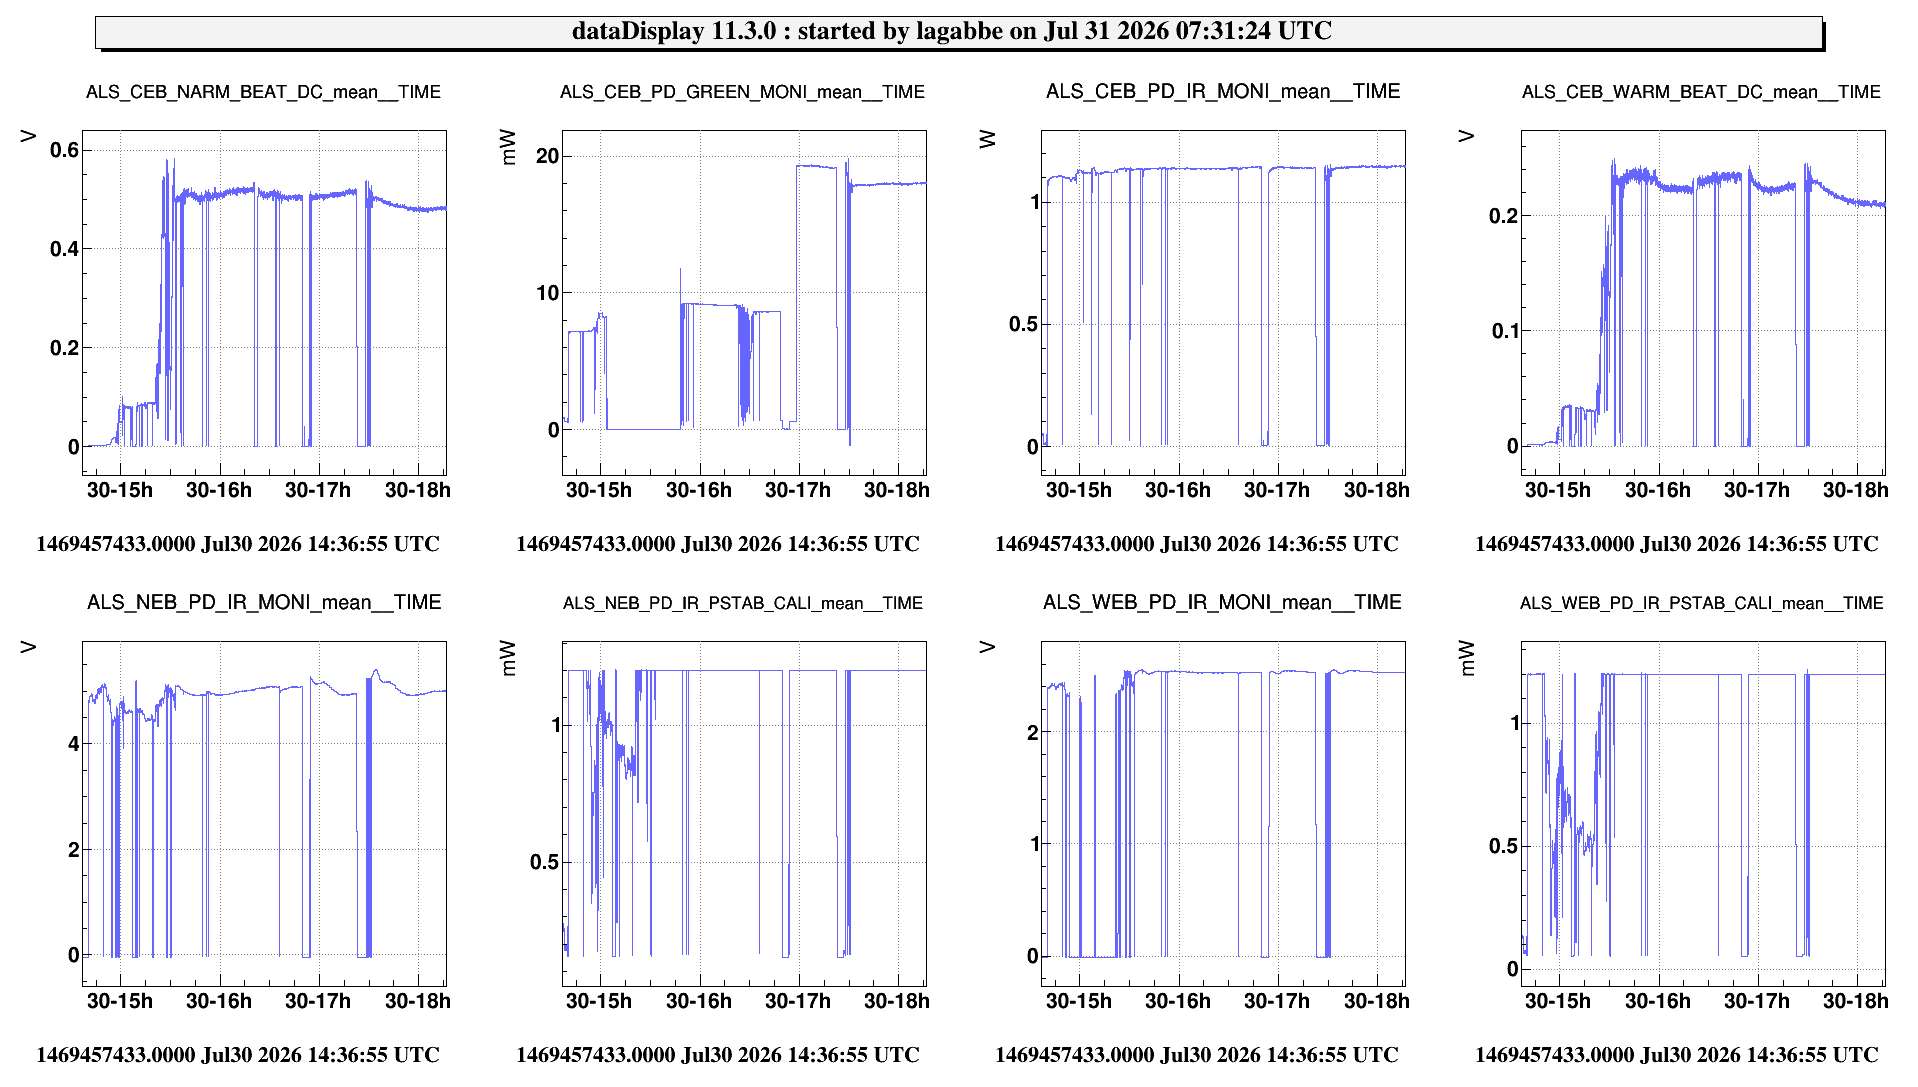
On July 30 afternoon, we went to the laser lab to realign the ALS laser beam on EIB. We used the CEB_PD_GREEN_MONI photodiode as reference for alignement. The mirrors before the green generator cristal (EIB_ALS_M4 and 5) were realigned to it maximize the power in that photodiode. Then the mirrors EIB_ALS_M6 and 7 were realigned with the IR fiber, using the IR power send to WEB and NEB as reference.
For a reason we still don't understand, CEB_PD_GREEN_MONI photodiode cease to work from 15h to 16h. But it started to work again after we disconnected and reconnected the power supply and Vbias cable.
We recalibrated the CEB_PD_GREEN_MONI photodiode gain and offset in the DAQ so it estimates the total green laser power on EIB. And we changed the threshold values on the DMS for the photodiodes CEB_PD_GREEN_MONI and CEB_PD_IR_MONI.
The green beam was also realigned with the fiber photodiodes CEB_NARM_BEAT and CEB_WARM_BEAT, but this alignment can still be improved by playing with the pico-motors EIB_ALS_pico1 and 2.
done as the last one before leaving the chamber.
The up-left coil looking from the rear side has an issue with the shielding of its cable https://logbook.virgo-gw.eu/virgo/?r=69386
Is that the same coil-magnet pair which is not responding to DAC actuation? Electrical checks should be done as a priority in any case, but if the up-left coil-magnet pair is the issue, then it makes it more likely that this is an electrical problem.
Yesterday and today we worked on the realignment and the relock of the two arms. We spent many hours in finding the alignment again, for both arms.
In the end we managed with a mix of procedures:
- moving PR X/Y to get the beam on the NE markers, then putting it in the center of the mirror; moving NE TX/TY to get the beam back to NI, using the instrumented baffles to center it on NI; move NI TX/TY to get flashes in transmission;
- starting from OpLev readings of the last good position; use the B4 and B1p camera to prealign the reflection of the input mirrors; exploration of PR position and EMs orientations.
After a pause this afternoon to allow other activities, in the evening we managed to finally get some flashes.
We then started to work on the relock:
- we revived the SUS and the [N,W]ARM_LOCK nodes (the latter in standalone, used manually);
- we checked the demodulation phases; B7_6MHz was fine, B8_6MHz needed a small tuning (+0.28 rad);
- we could relock the arms, finding then several issues that we partially fixed:
- we moved back PR to allow a better centering on the IMs and to recover smaller values of the BPC corrections;
- we rebalanced NI MAR actuators;
- we rebalanced WI MIR actuators as one coil is not responding to DAC inputs (see #69480).
We leave the two arms locked, in standalone, using the single arms lock nodes.
The up-left coil looking from the rear side has an issue with the shielding of its cable https://logbook.virgo-gw.eu/virgo/?r=69386
Is that the same coil-magnet pair which is not responding to DAC actuation? Electrical checks should be done as a priority in any case, but if the up-left coil-magnet pair is the issue, then it makes it more likely that this is an electrical problem.
done as the last one before leaving the chamber.
Plots showing the result of WI MIR actuation cheks are attached. If a voltage is generated by UL DAC (seen by the monitor inside the board), no effect is visible on the mirror orientation (fig 1). If the same is done with one of the other DACs, the rotation is well visible (fig 2).
In case of NI the SLED beam was also repositioned on the reflector under the marionette and this implied sensor and lens adjustments.
The system works but the focal plane has to be further tuned (there was not enough time, but the situation is quite clear, anyway the coupling is not so large (~1.5%).
ITF in UPGRADING - DOWN
Today's activities:
Arms recovery (Bersanetti, Boldrini, Majorana, Ruggi, Spinicelli, Was)
TCS auxiliary cooling system cabling - new data channels (Cavalieri)
ALS recovery (Lagabbe, Spinicelli)
The attached shows the excitation produced by opening and closing the doors of the SAS and piscina. The excited bump looks well matched to the 18.50 Hz one. Some small excitation of the 12Hz bump is noticeable as well.
We had a look to the effect of the sound wave pulses produced by repeated door opening and closing.
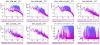
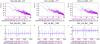
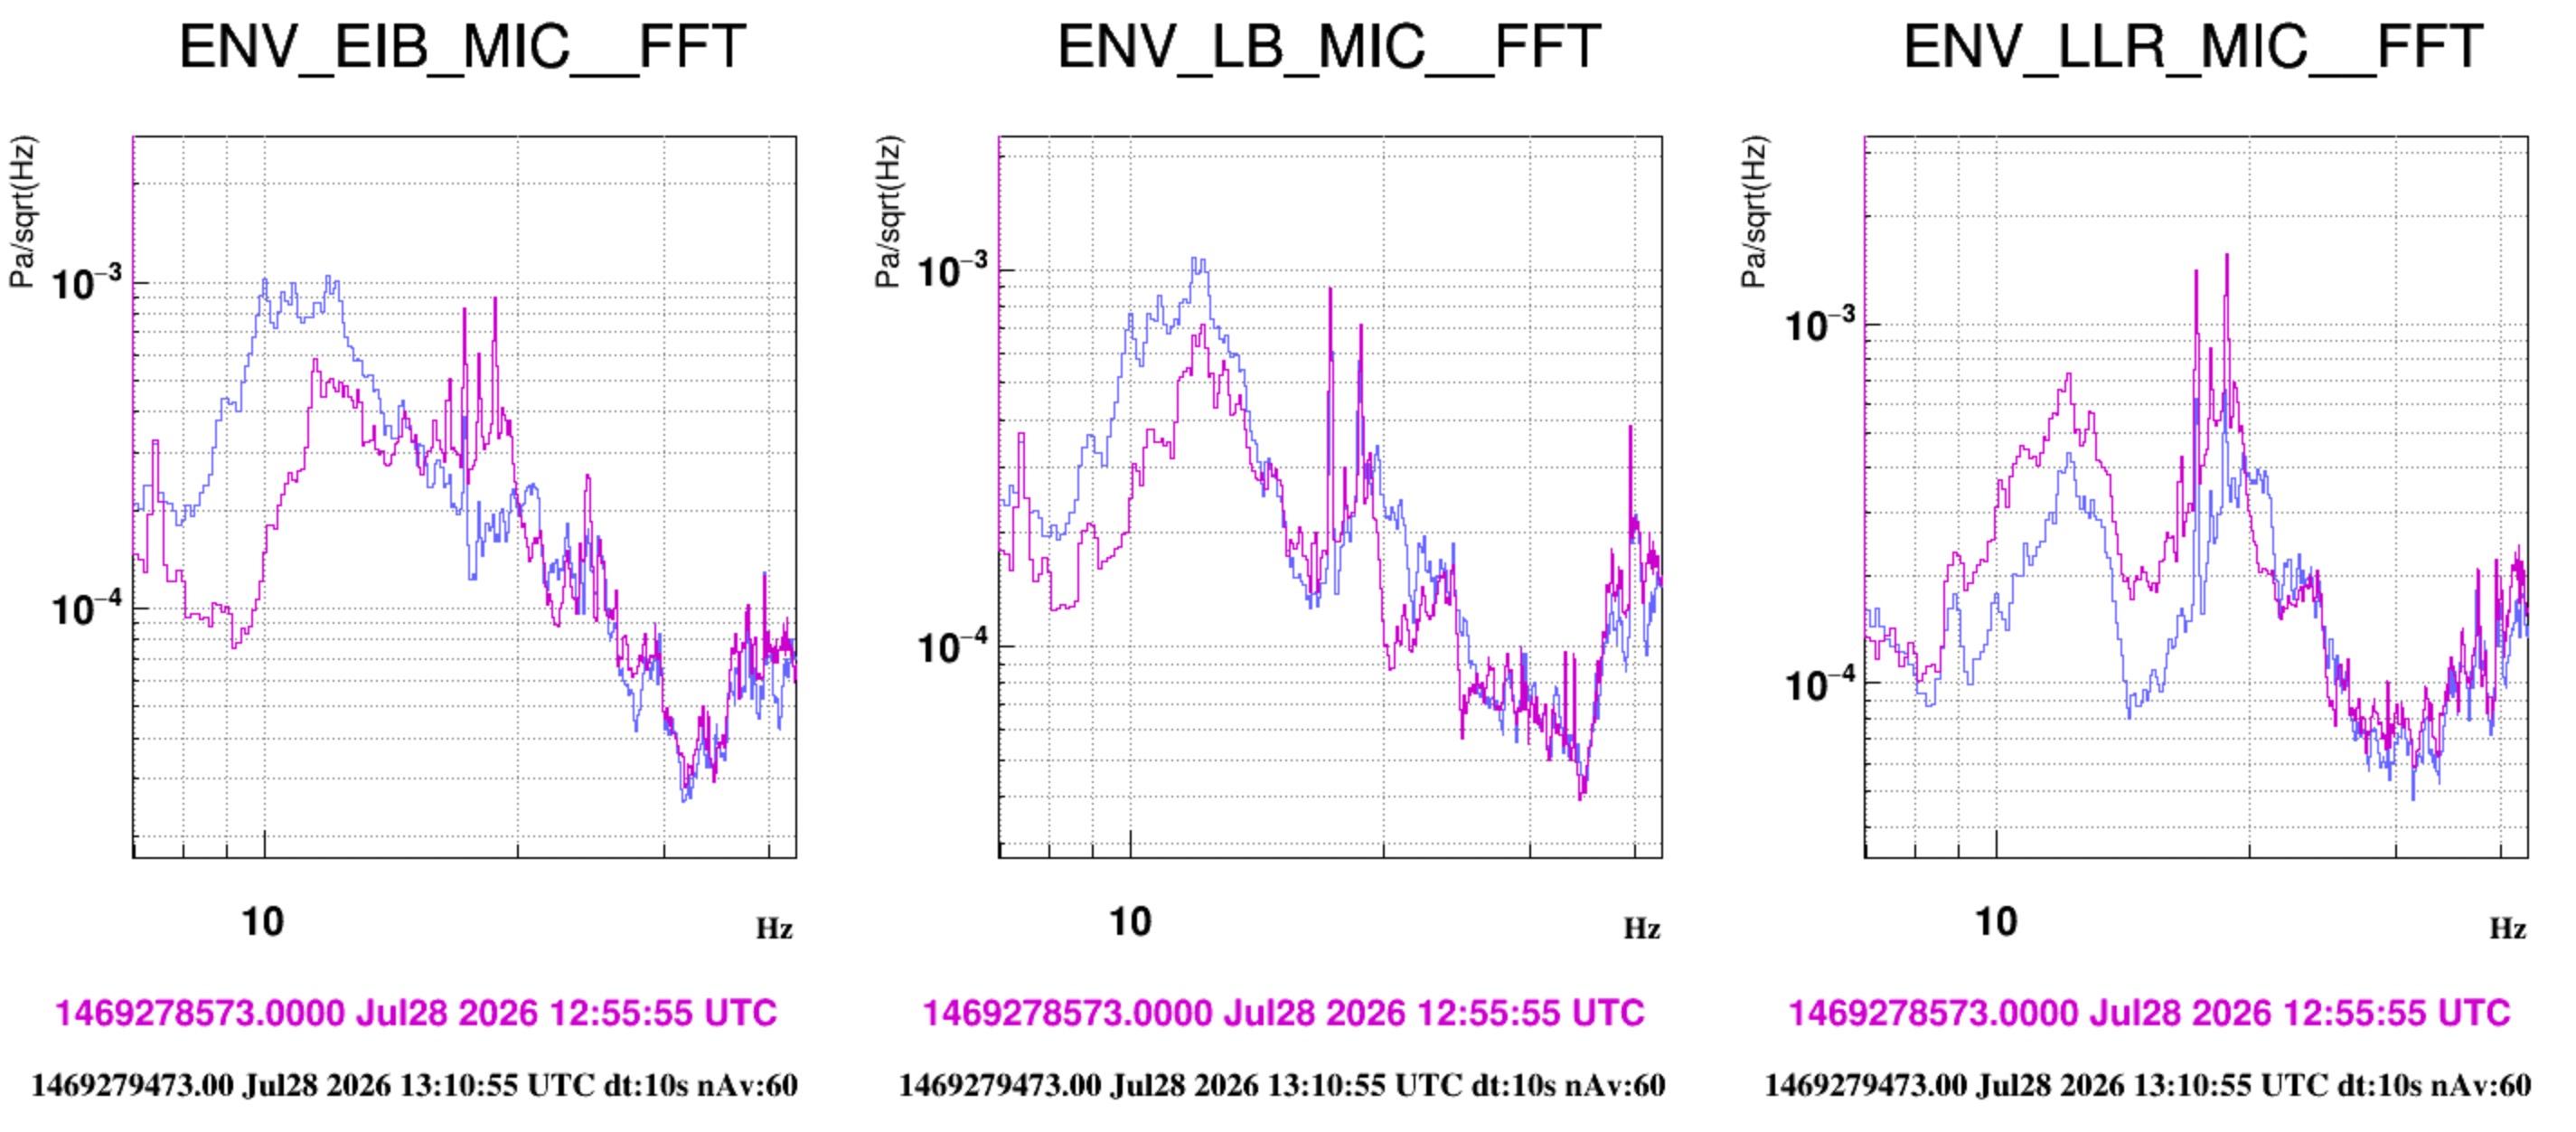
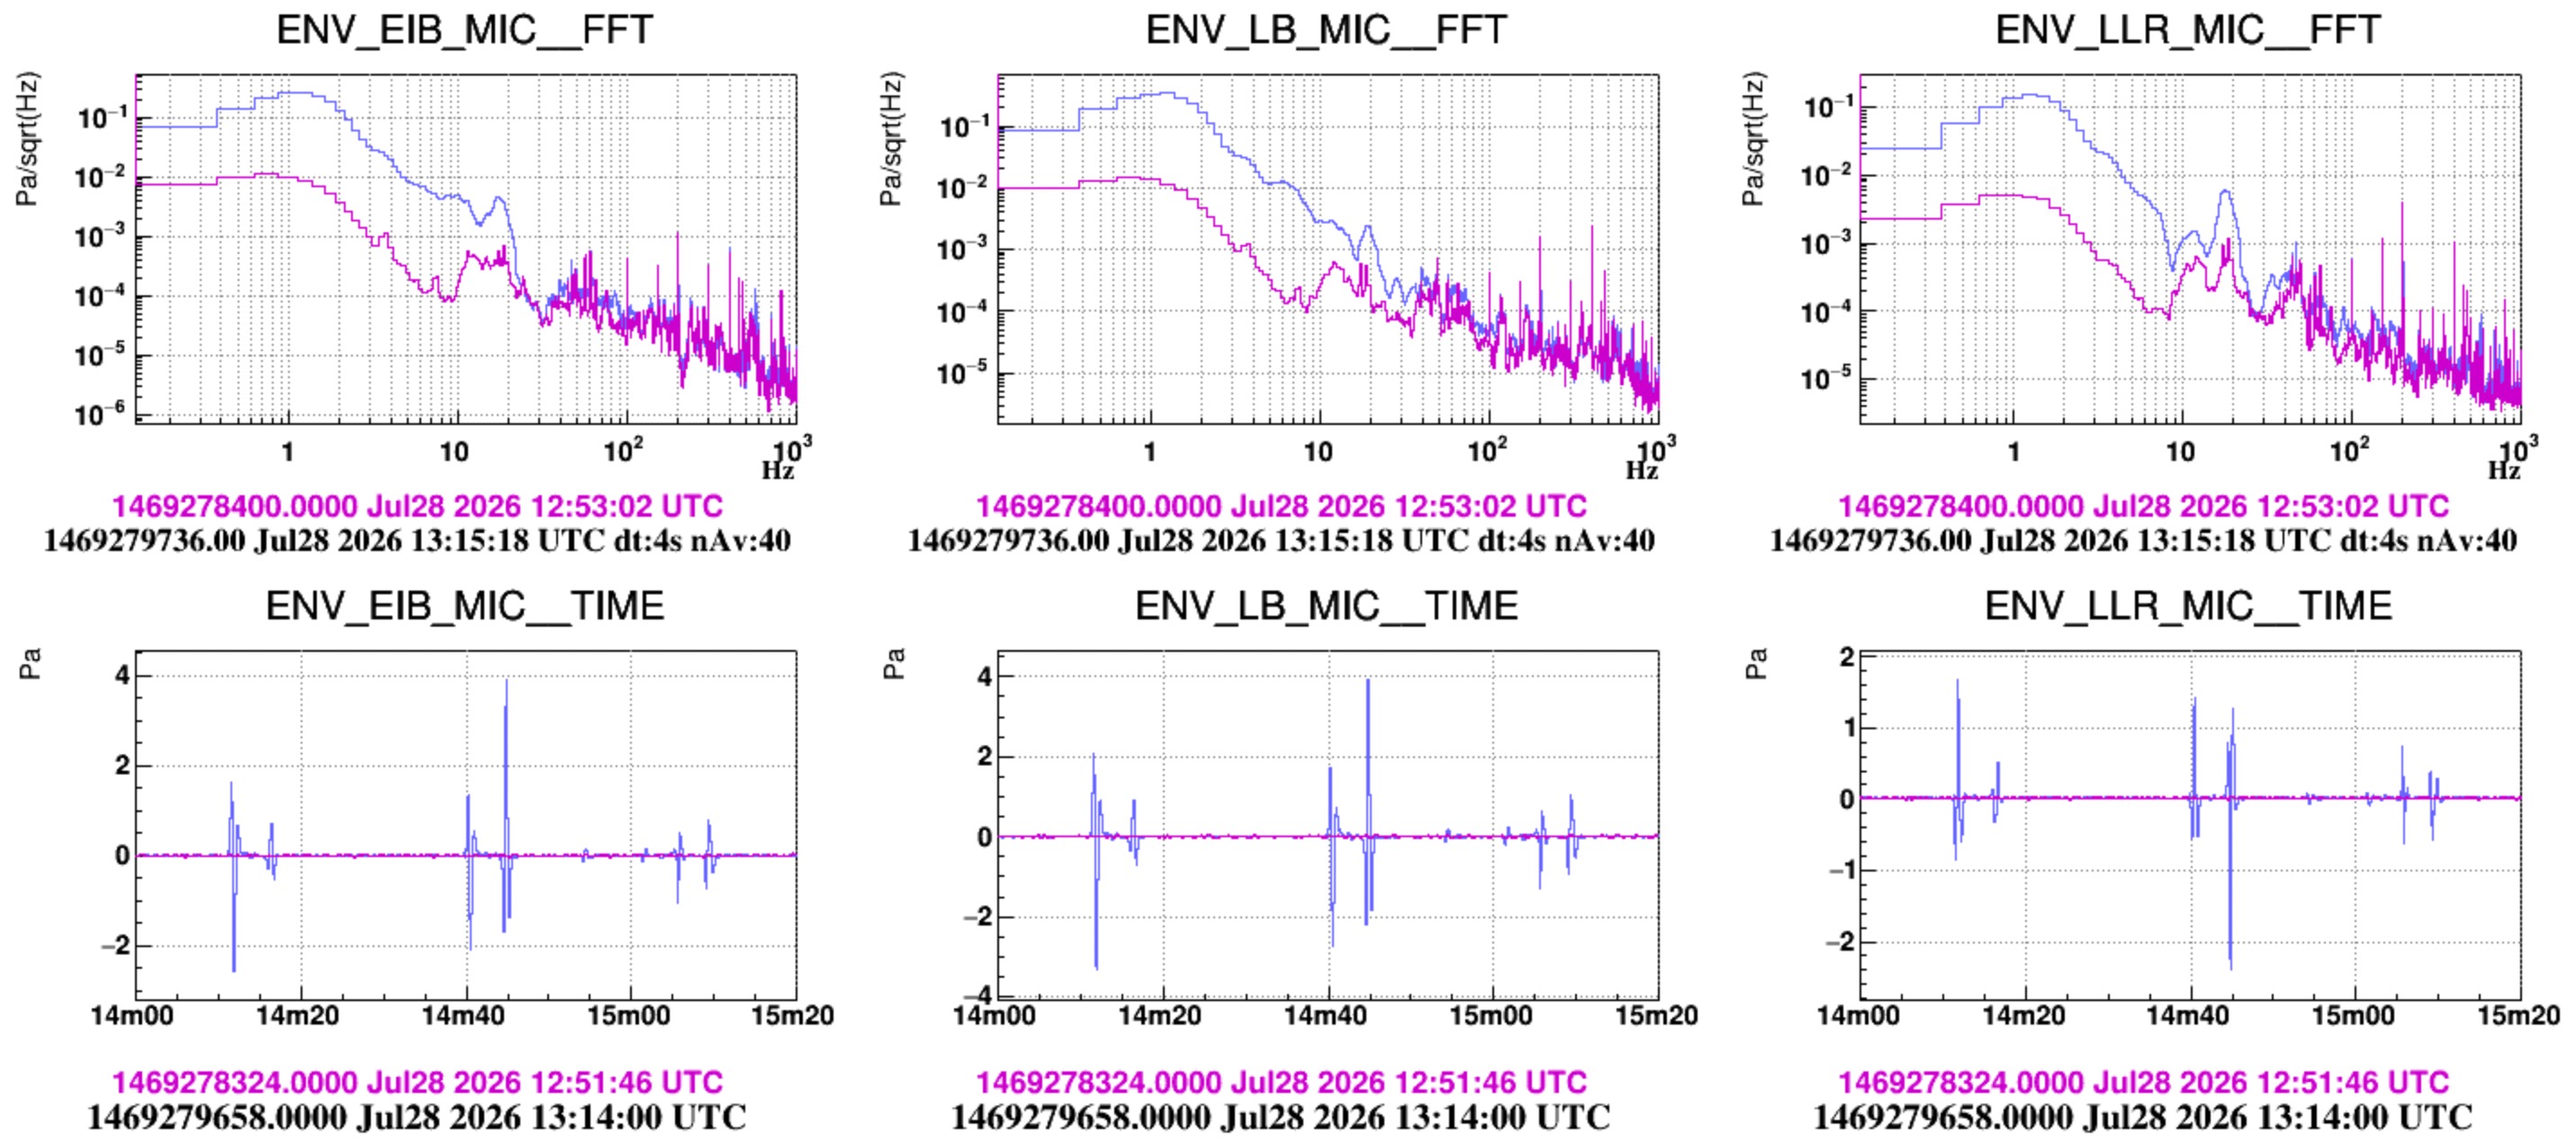
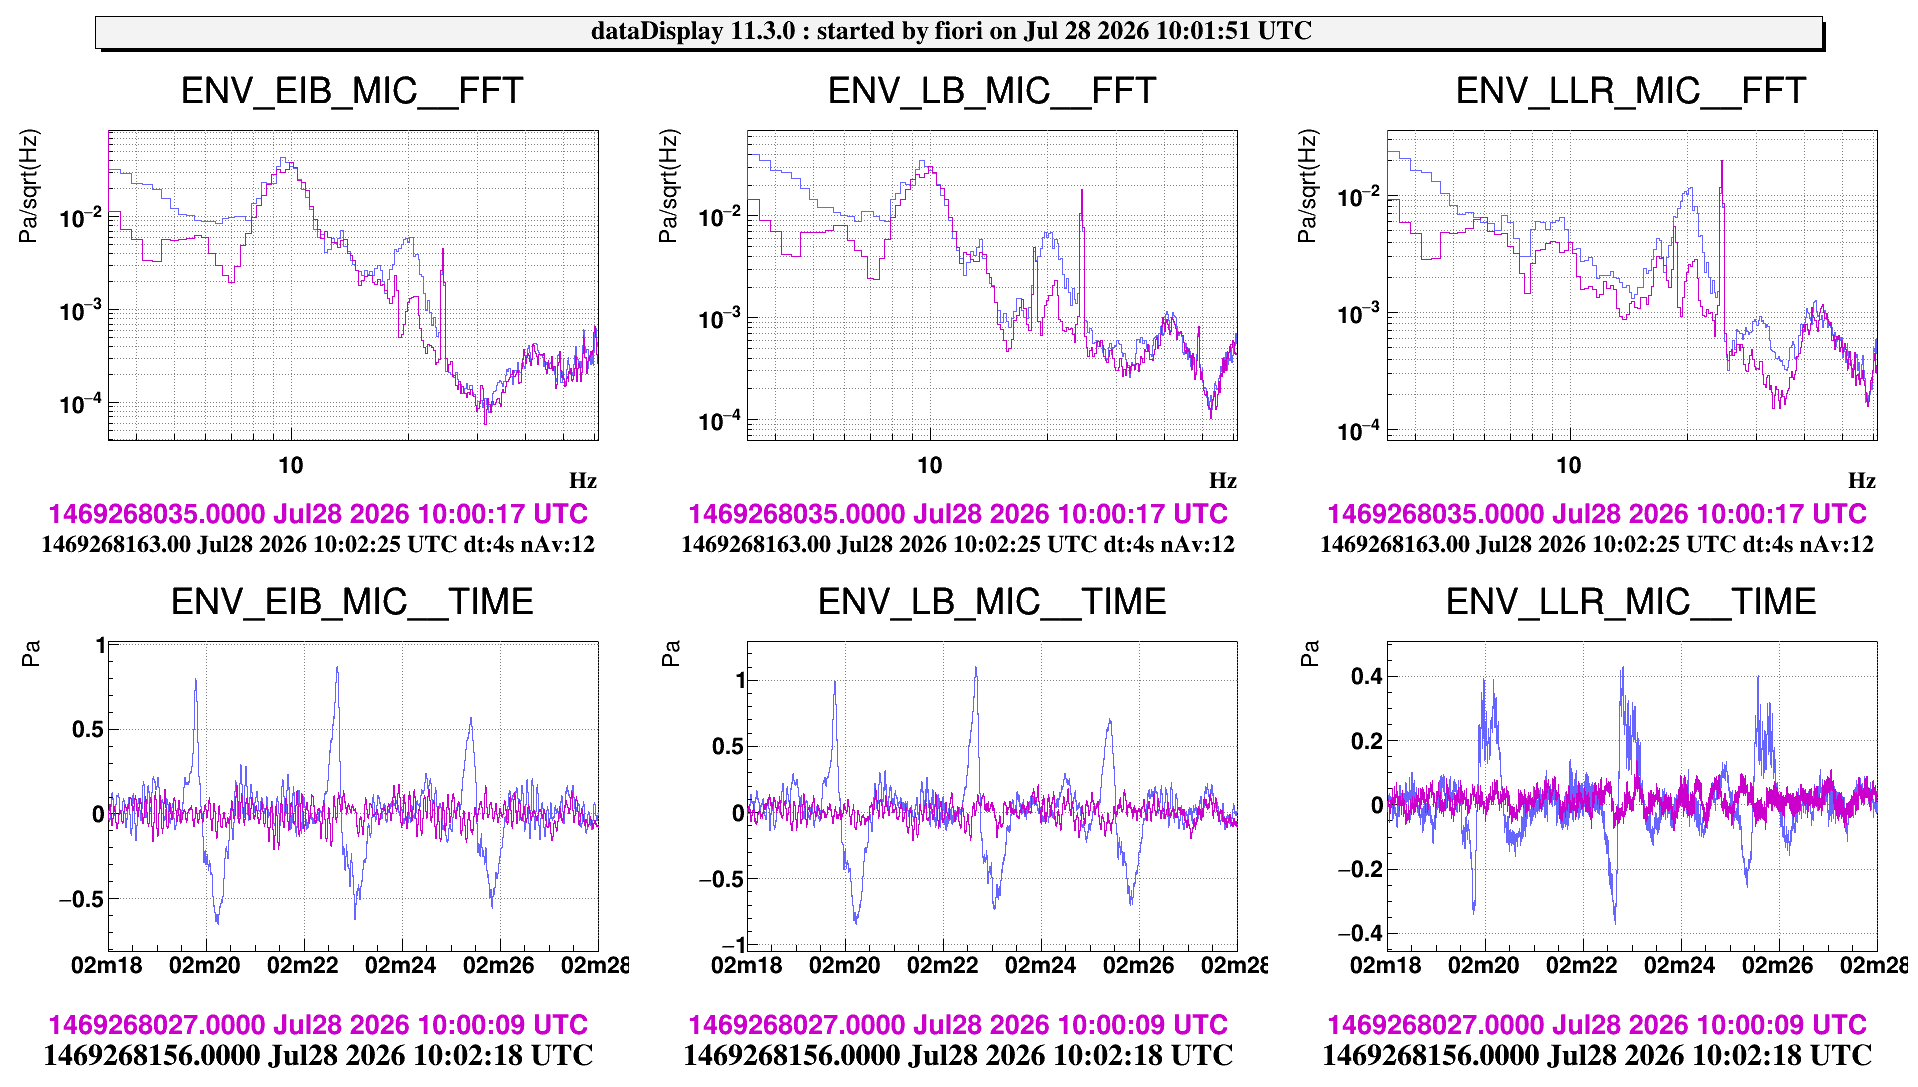
In the morning, while the HVAC was on, we performed a set of pulses with the door between the laser bench room and the minitower room. Figure 1 shows ASD of the microphones inside the laser bench room. They all see a bump at approximately 20Hz growing above the noise backround noise. We remind that the "LLR" microphone was positioned in the N-W corner of the room, at aproximately the beam height.
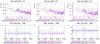
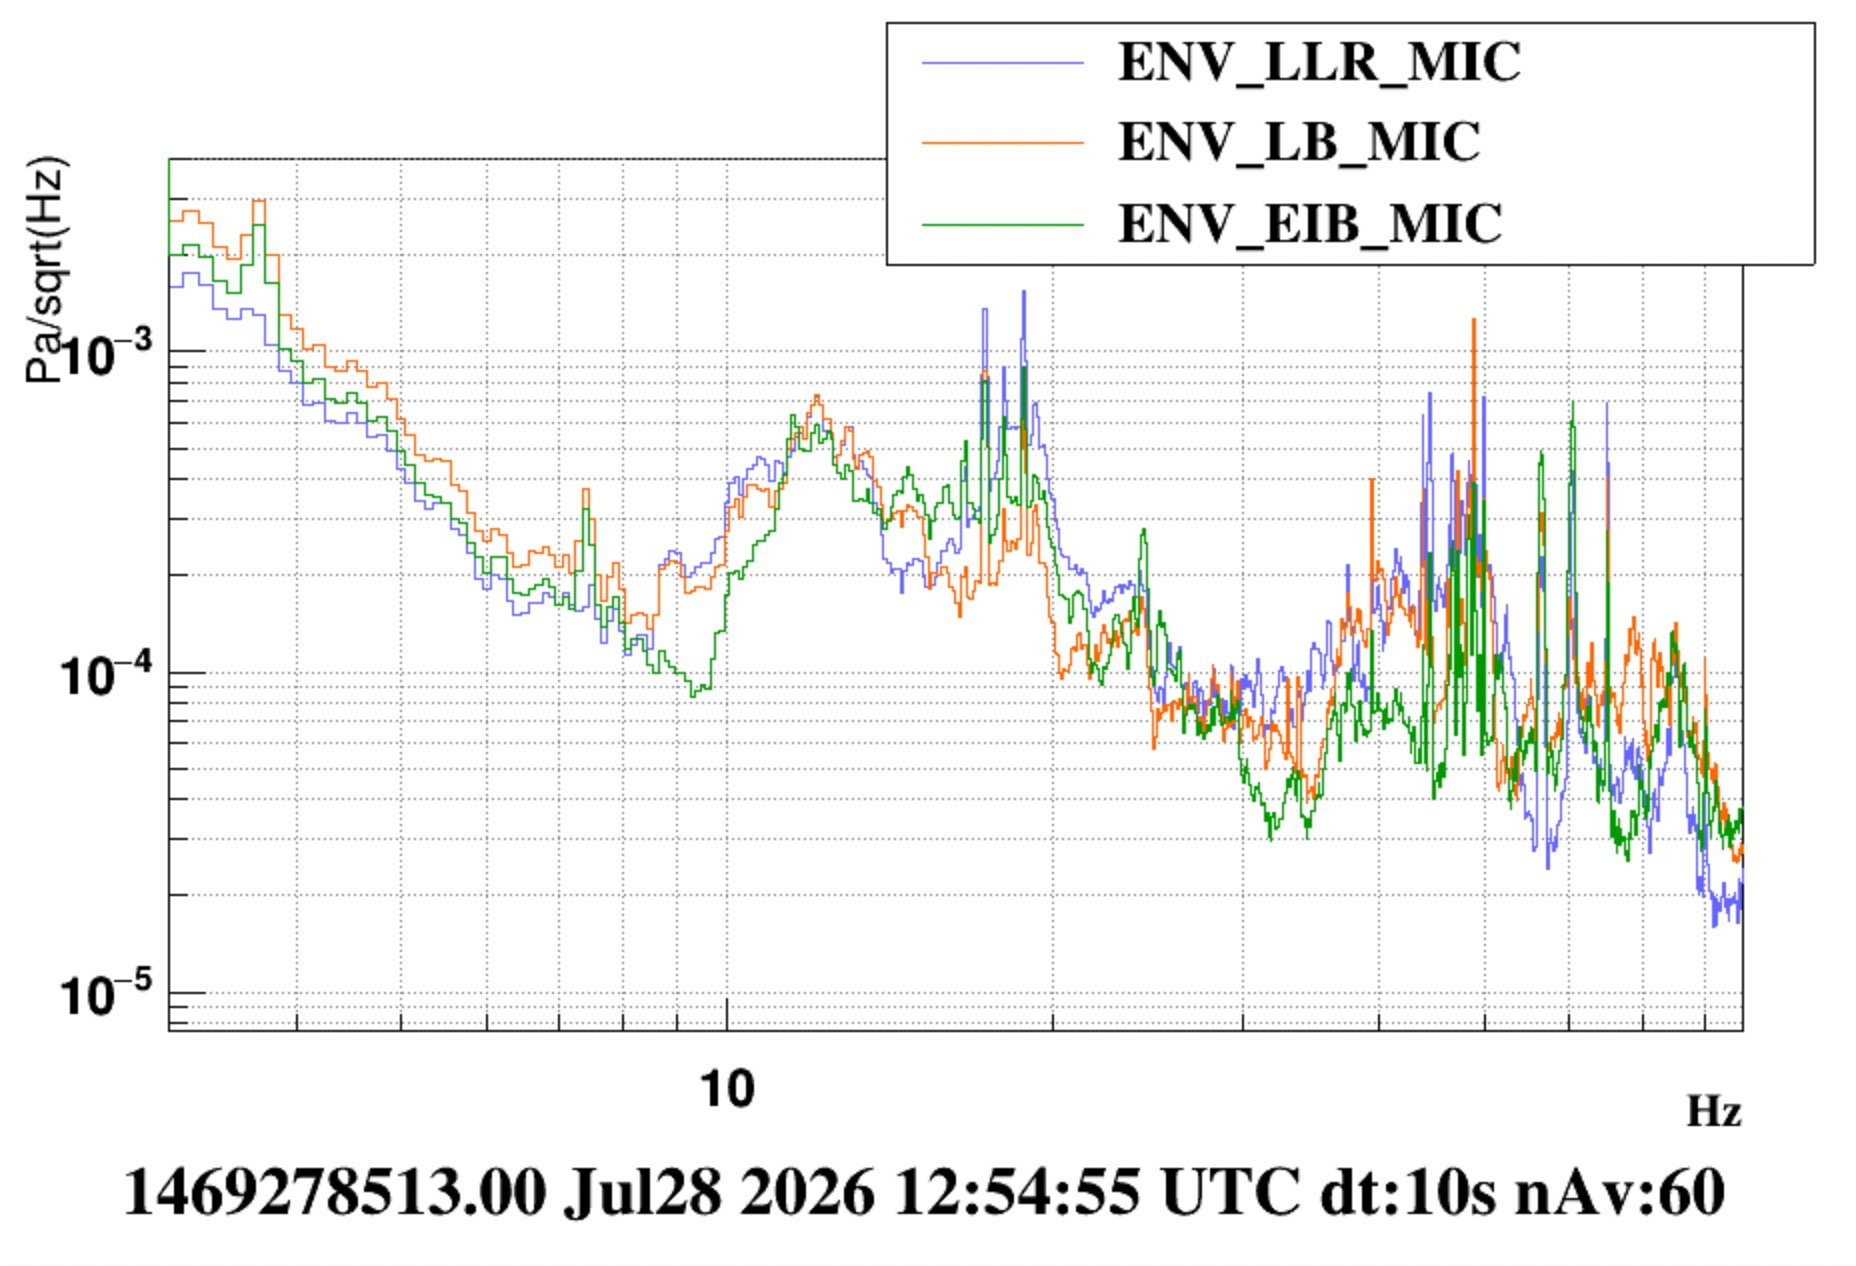
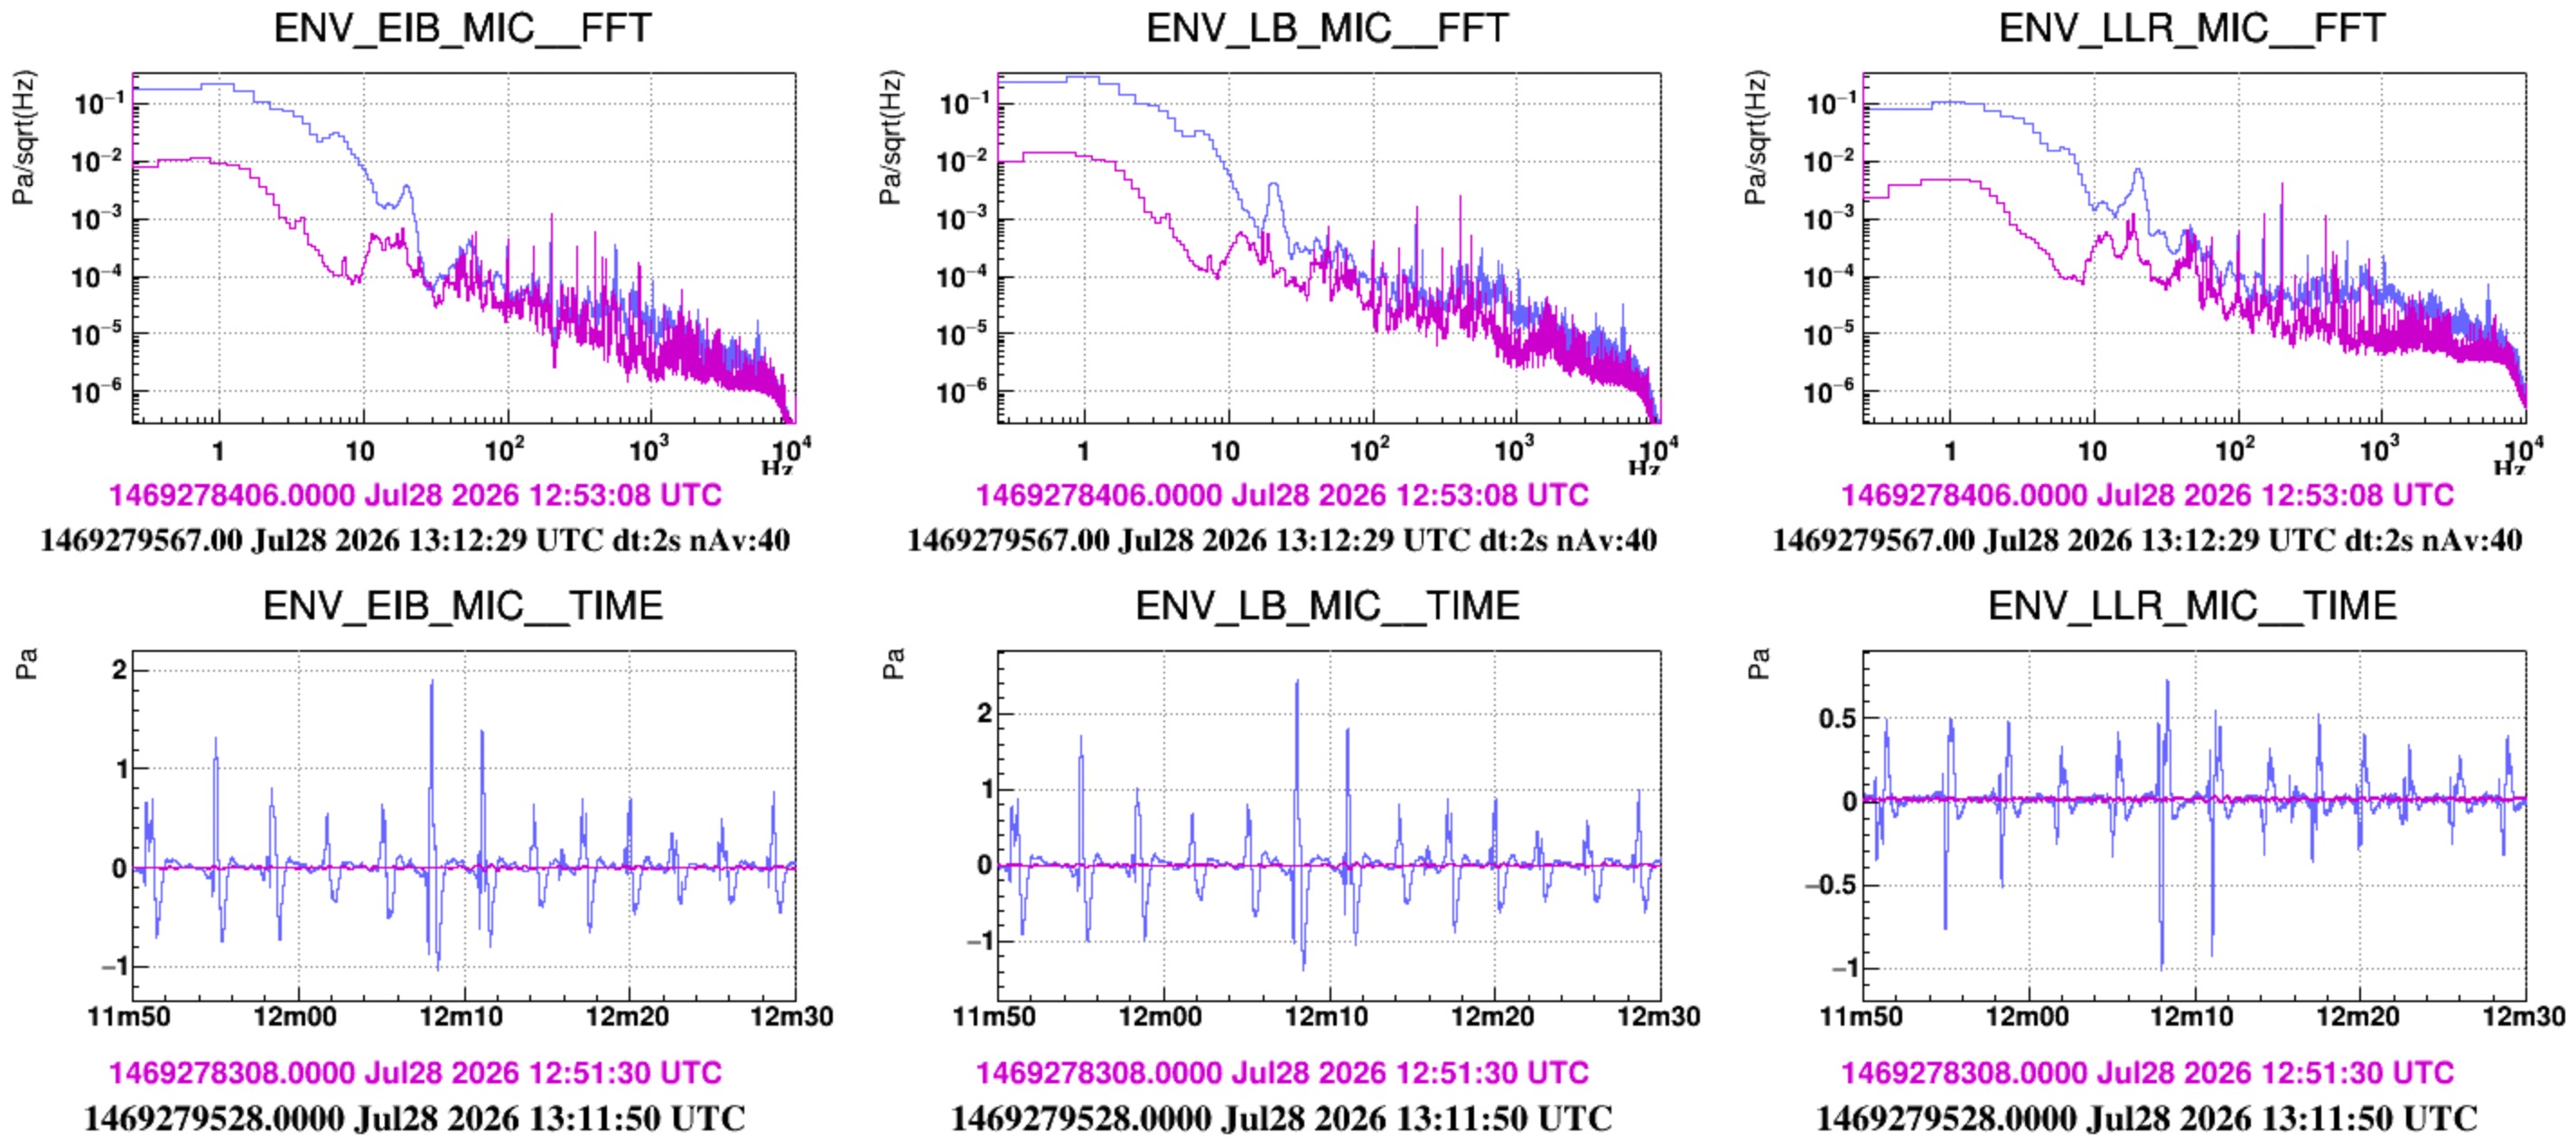
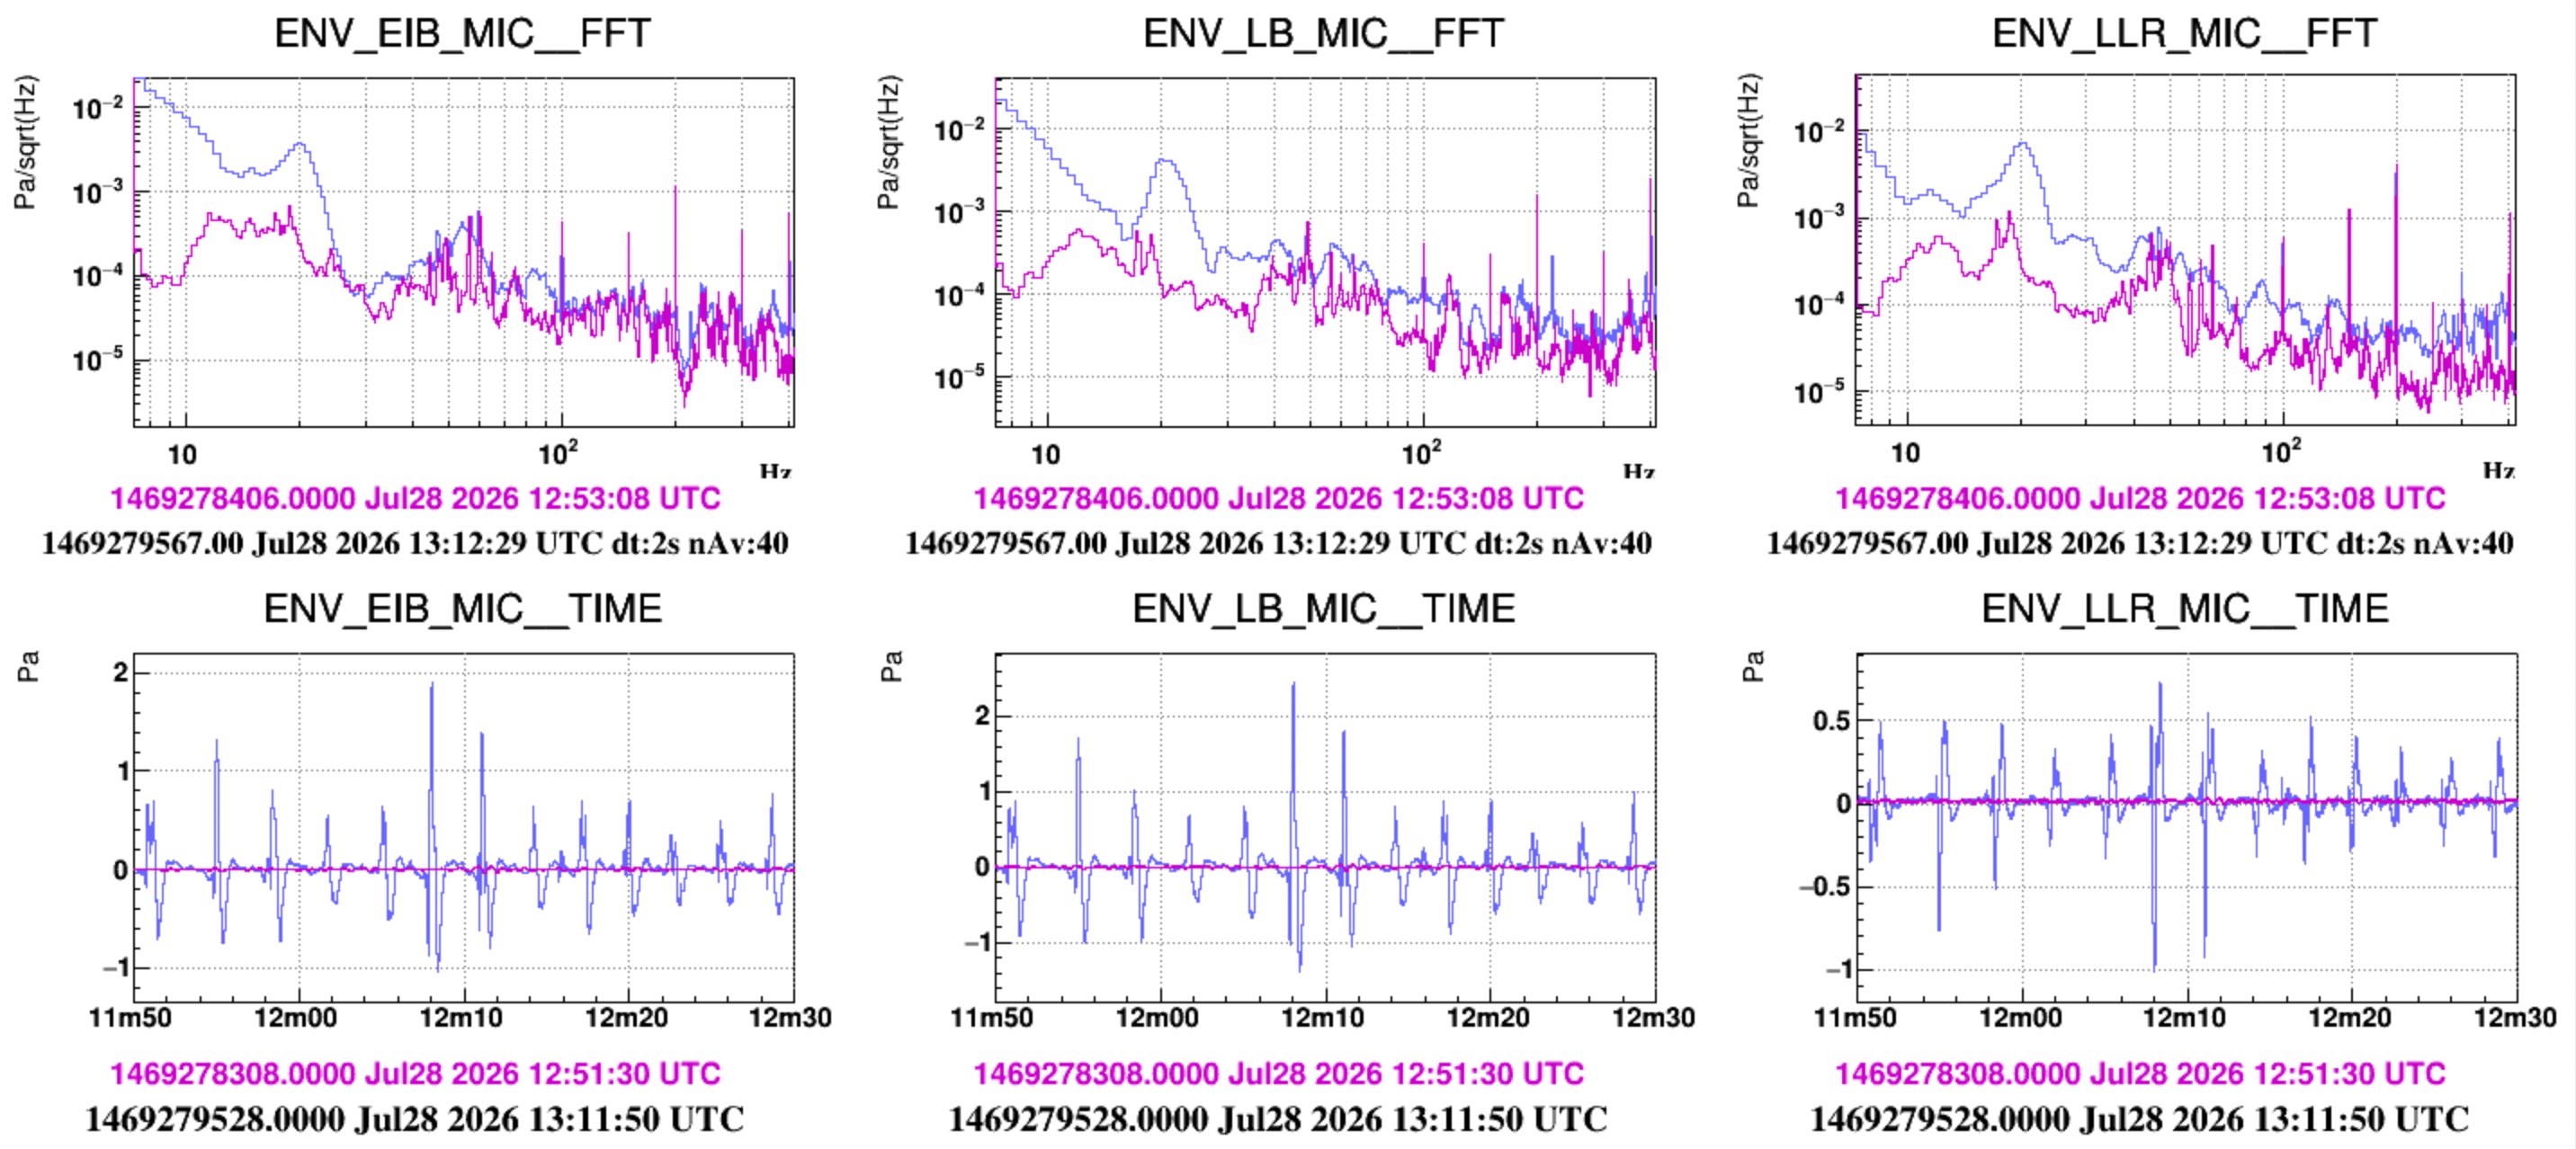
In the afternoon we repeated the same test, but the HVAC was off (also those of CEB) and we acted with the door between the Atrium and the laser bench. In Figure 2 (and Fig.3) the purple spectra correspond to the quiet condition. Two bumpy structures at approximately 12 Hz and 18.5 Hz are visible, in particular in the LLR microphone. In the excited condition (blue) microphones see again a peak at about 20Hz and also, less pronounced, growing bumps at roughly 40, 45, 55, 85,135 Hz (Figure 2).
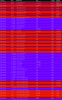
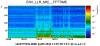
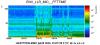
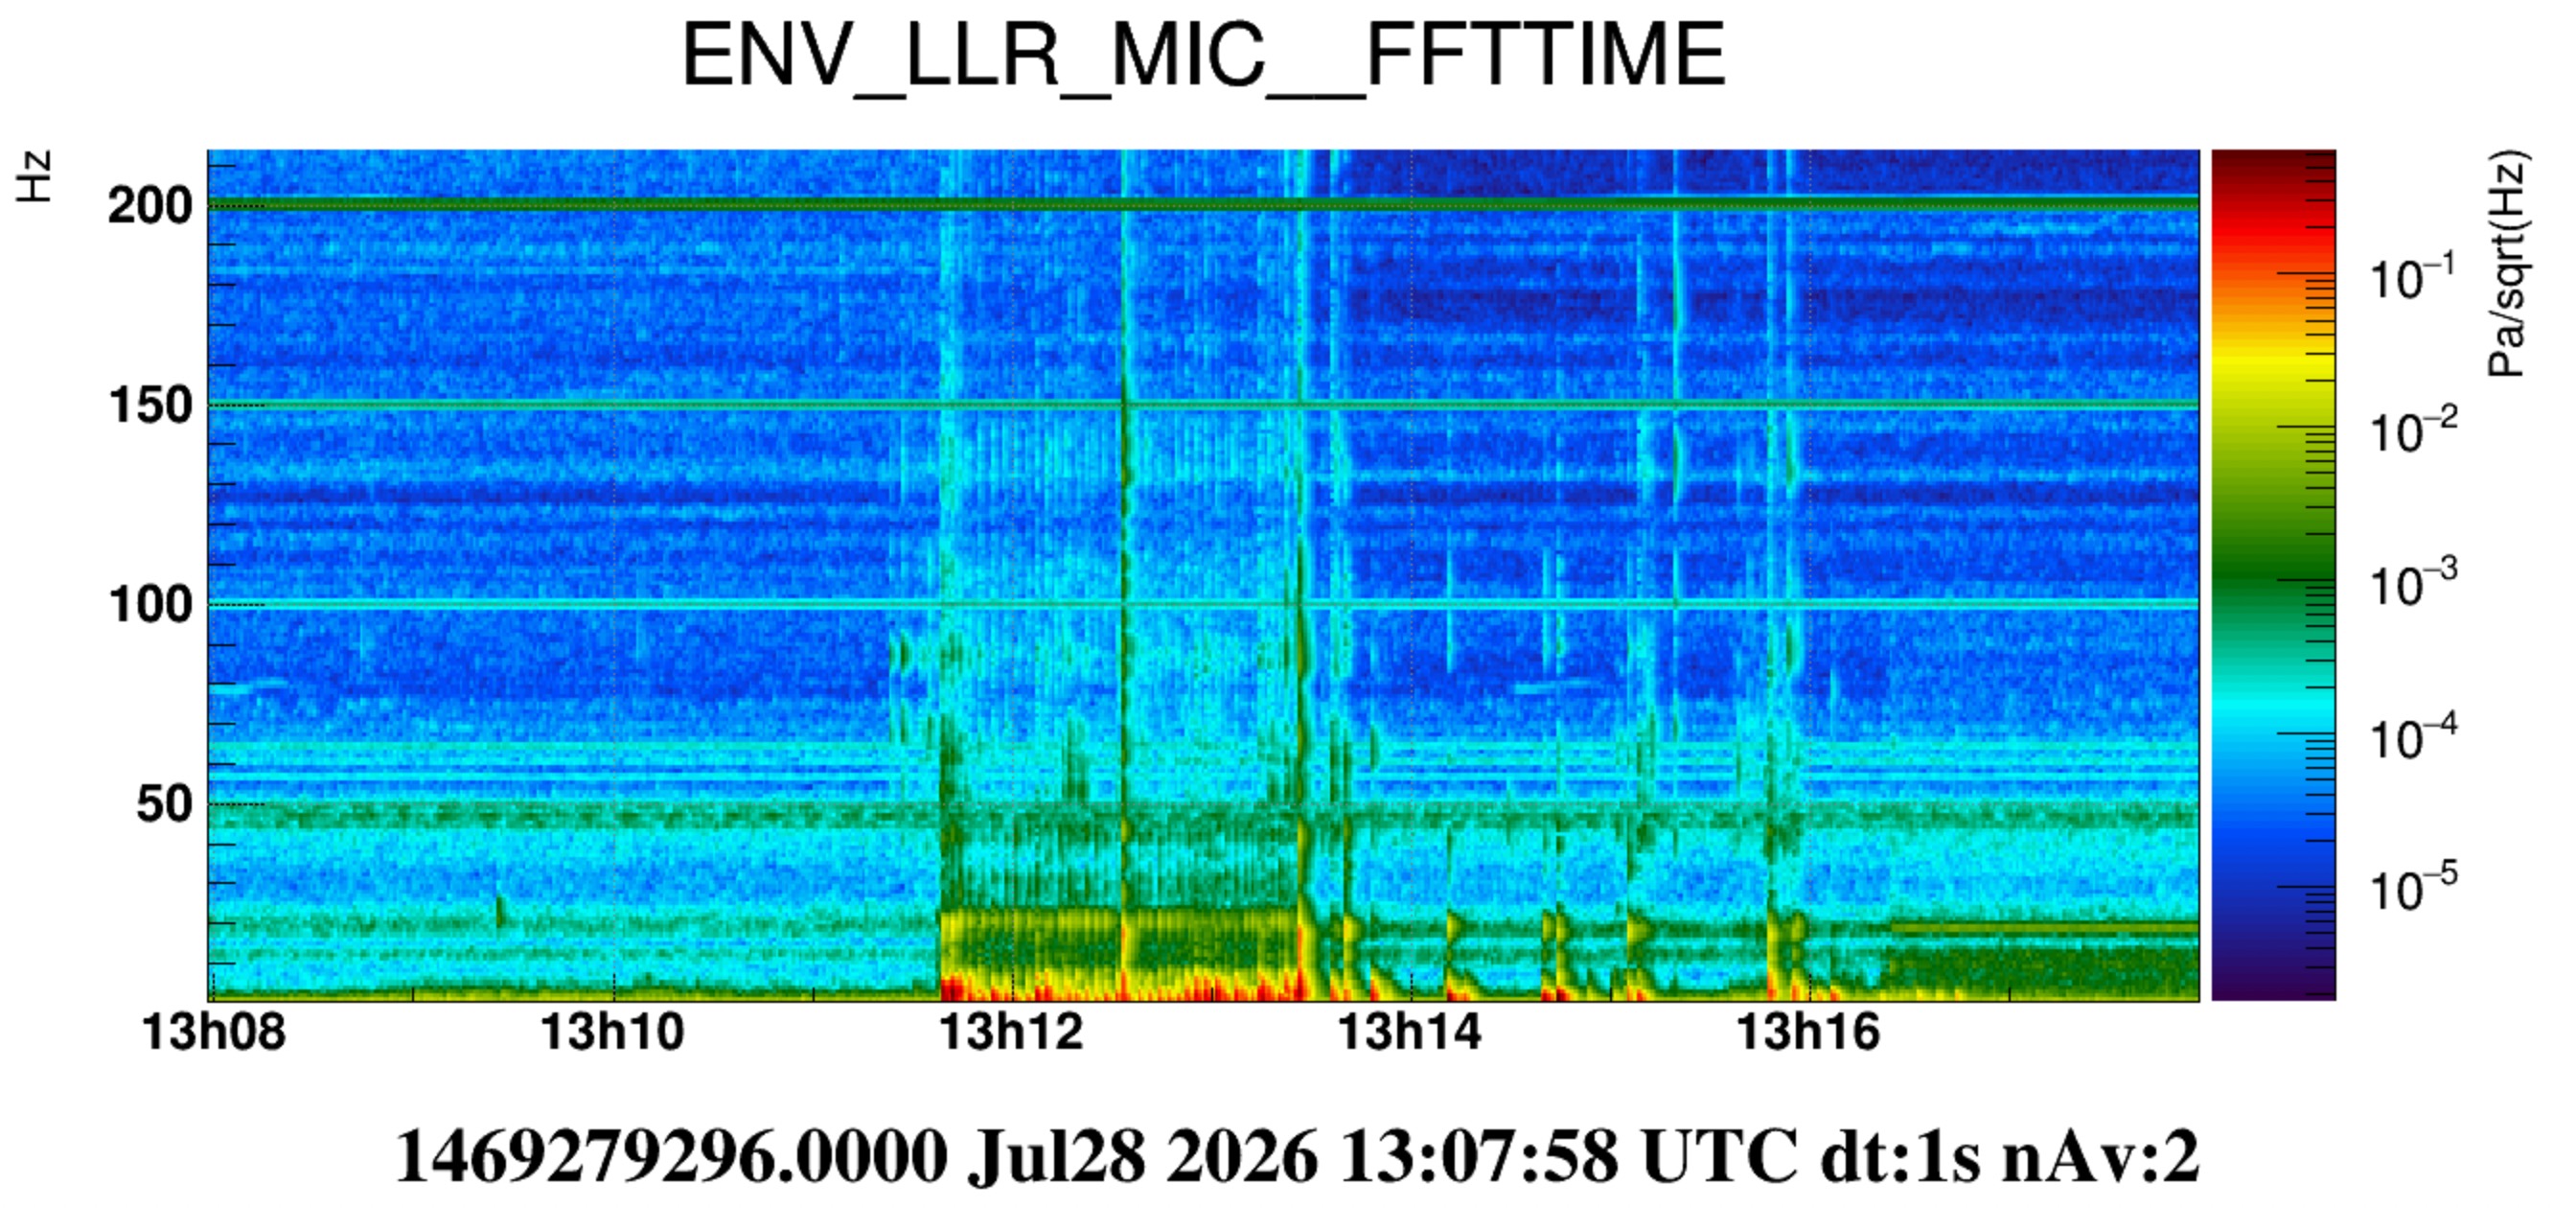
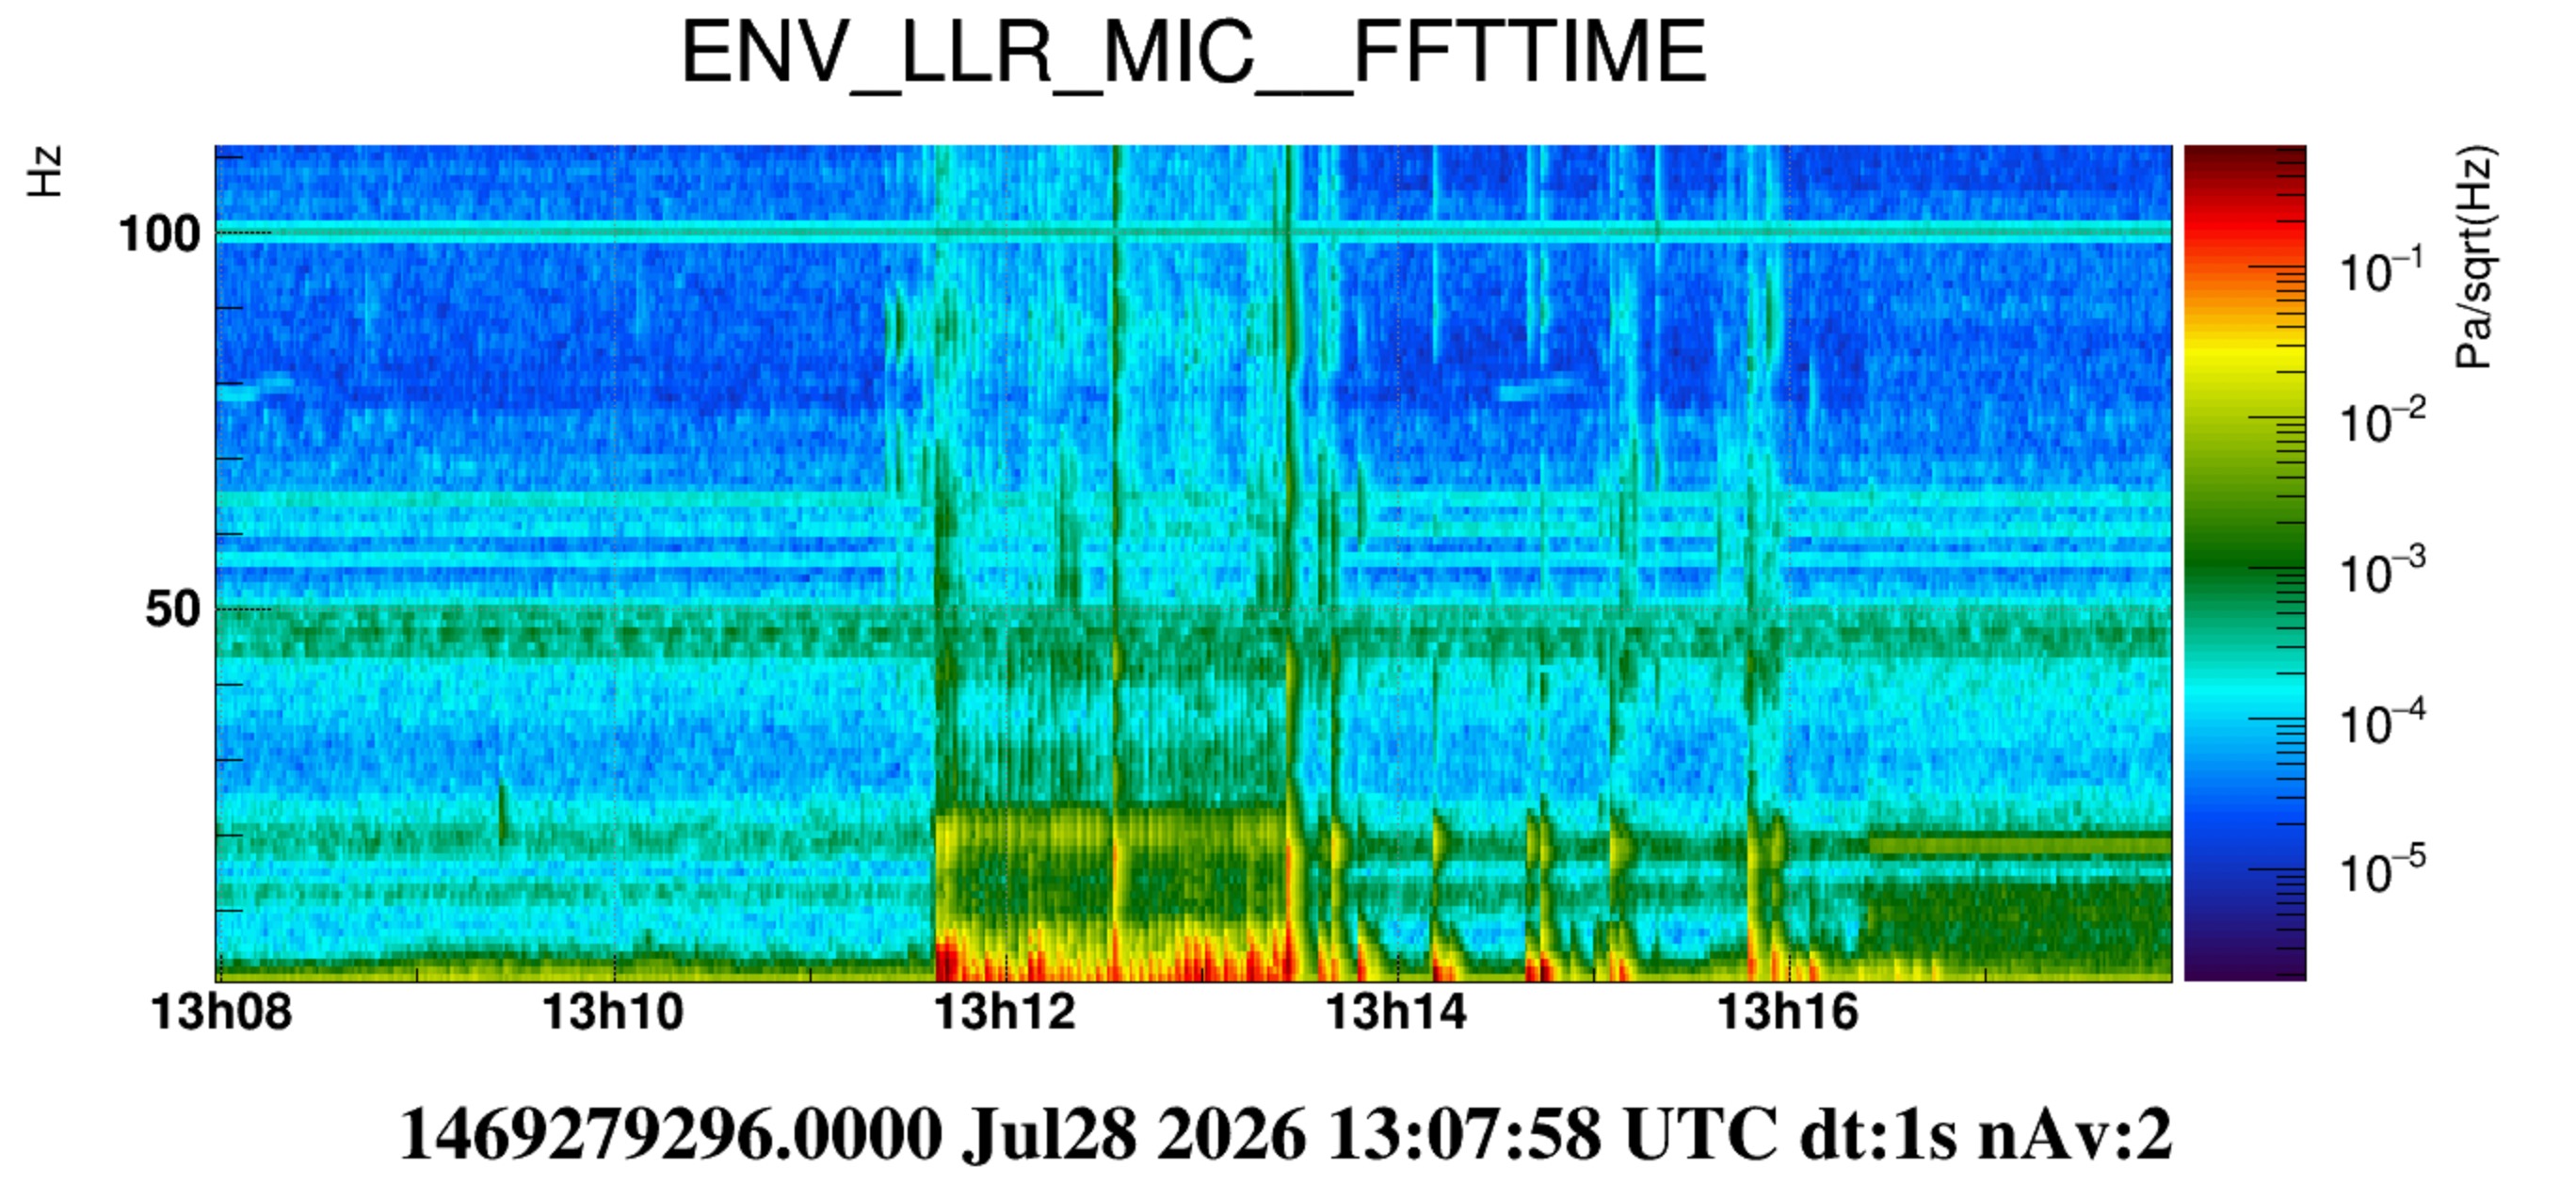
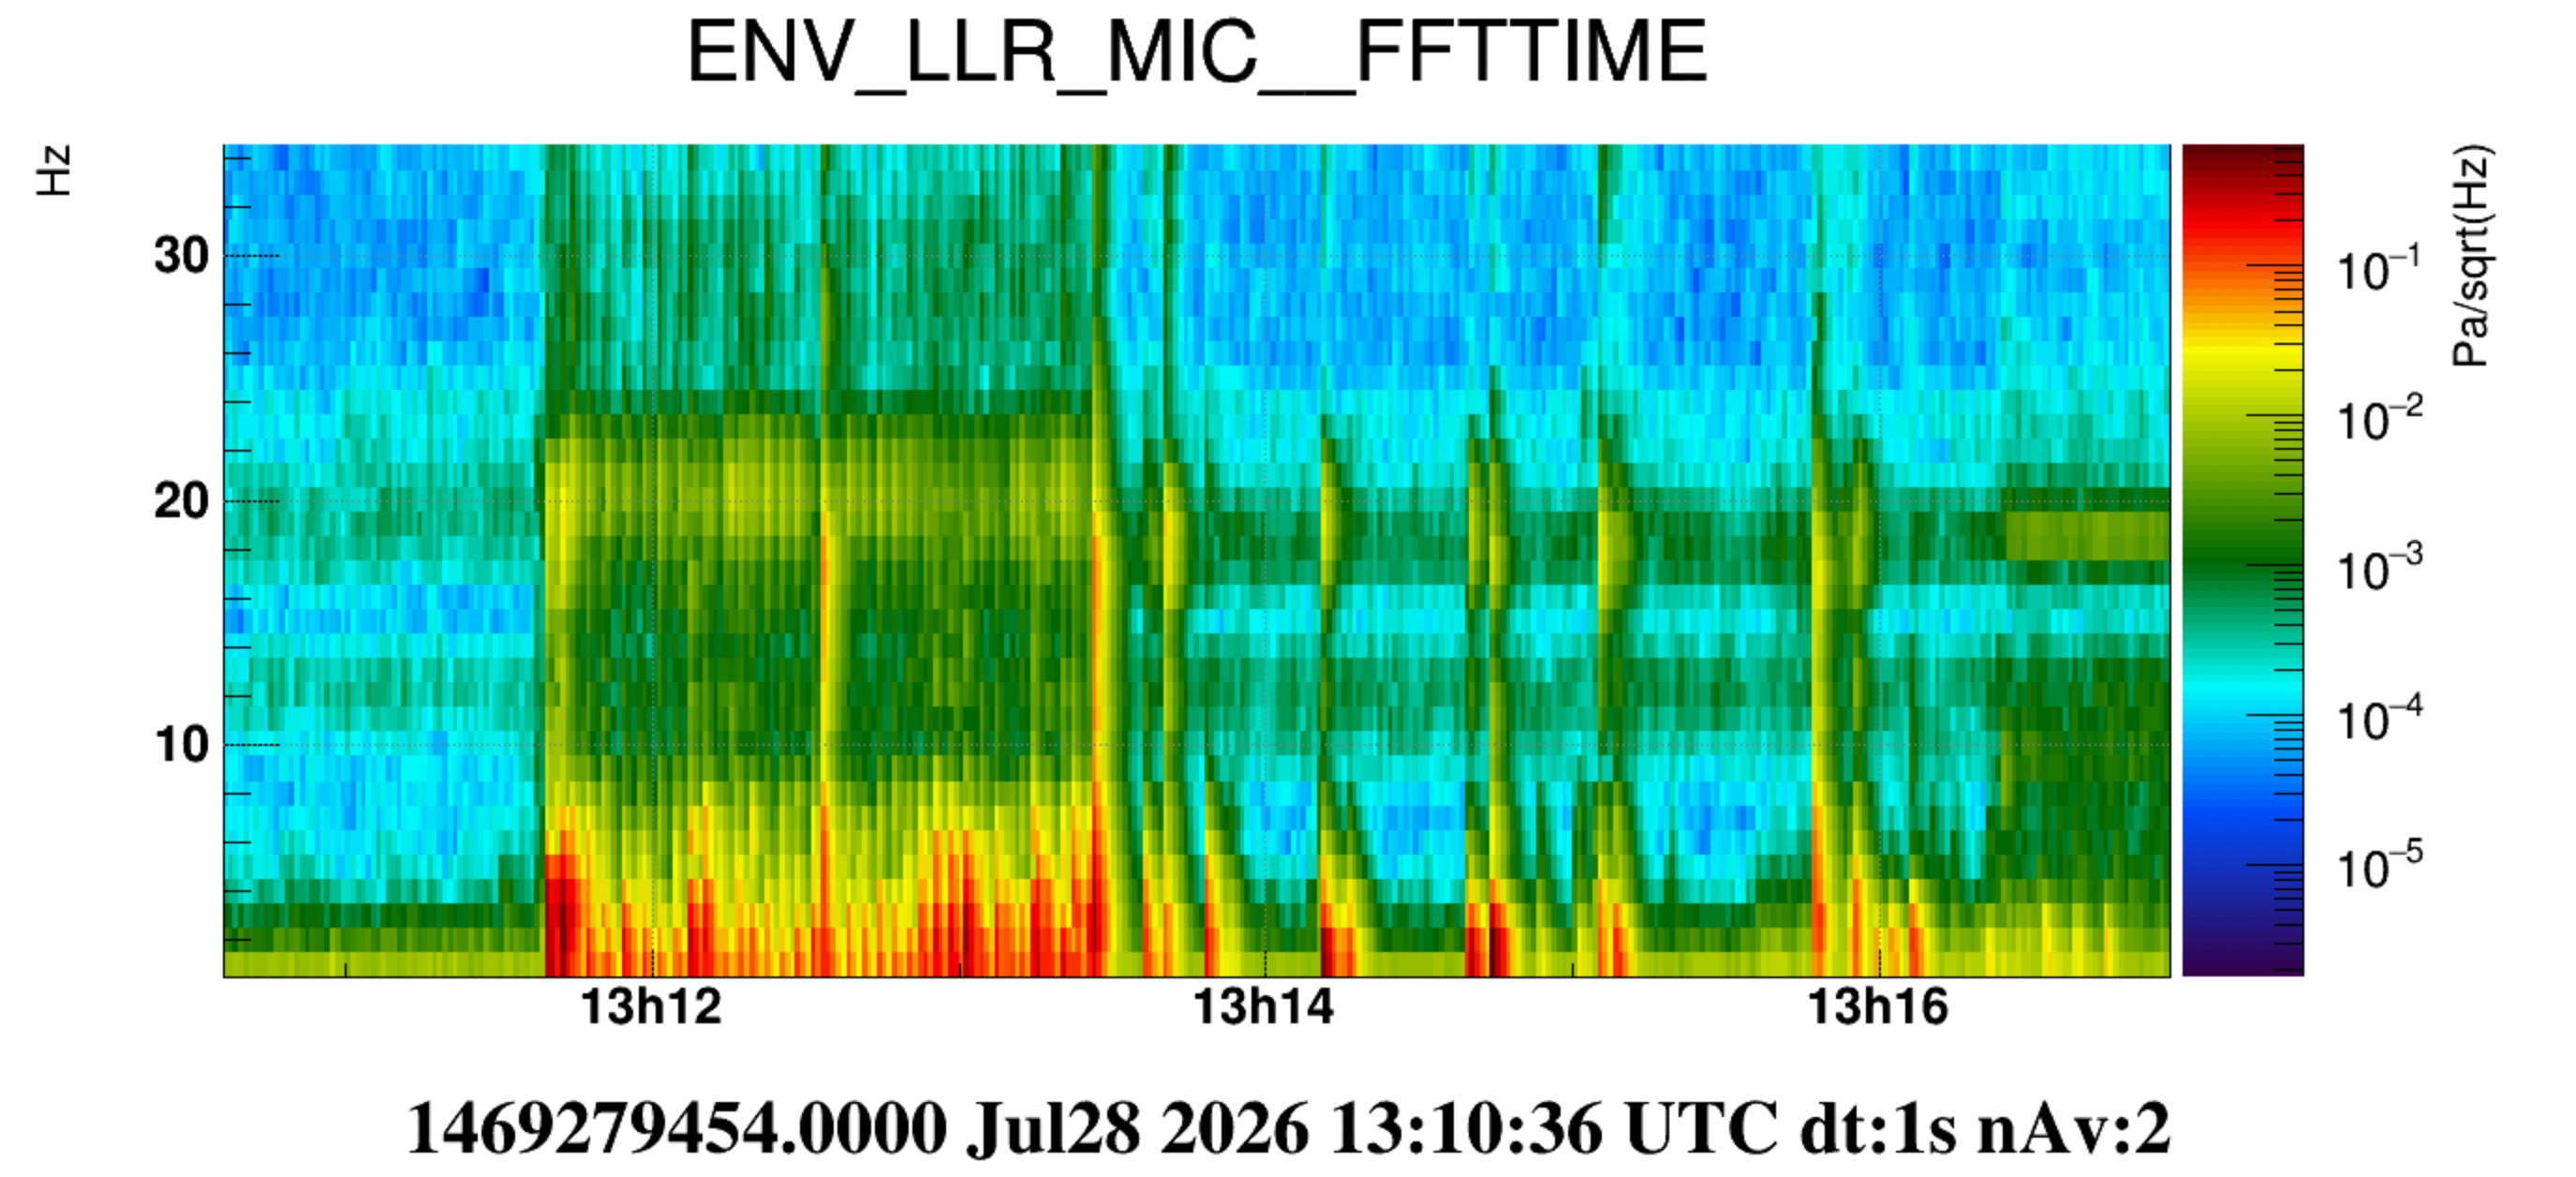
Figure 4 (also 5 and 6) is a spectrogram of LLR mic over the time of this test. After the test is finished (about 13:13:30 UTC) additional pulses around 20Hz are seen (actually here the excited frequency is a bit lower, it looks more around 18.5Hz). These are due to Irene exiting the lab and opening/closing the doors of the atrium, the SAS and the piscina.
We would interpret these frequencies as acoustic modes of the room. We are also tempted to think that the 18.5 Hz bump seen in quiet condition is the same 20Hz mode excited by the door. We have excluded already it to be a resonant mode of the air ducts ( https://logbook.virgo-gw.eu/virgo/?r=69148). The frequency mismatch (20Hz instead of 18.5Hz) however needs an explanation.
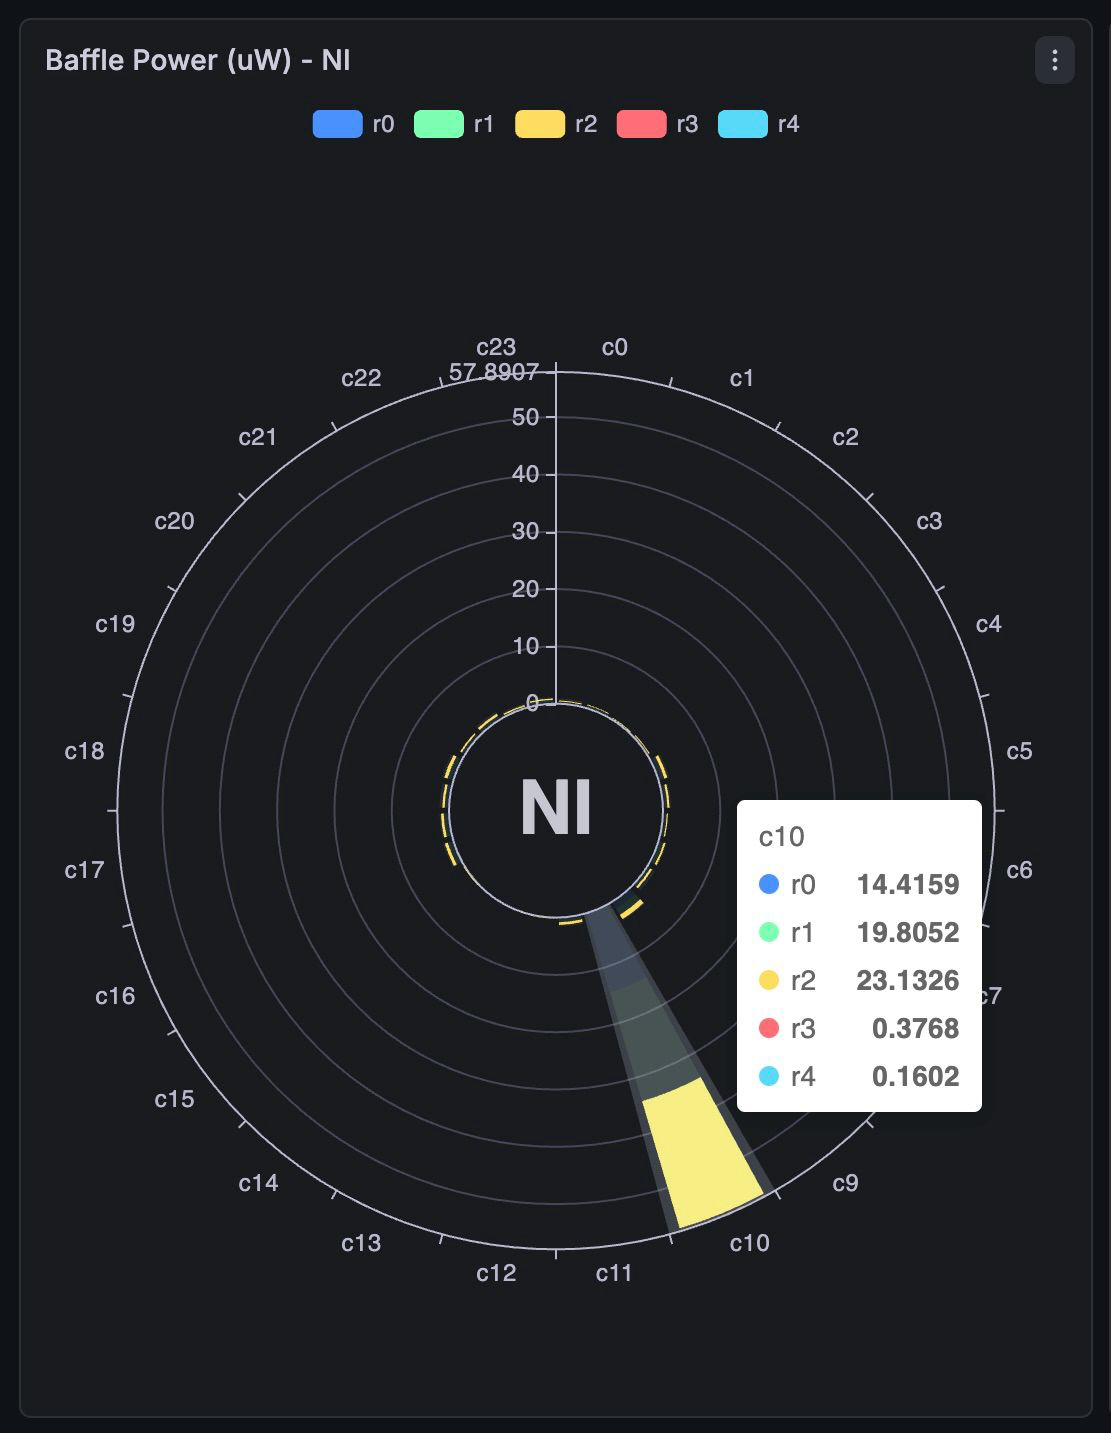
In this logbook entry we will explain how the alignment of the North End Mirror has been done, using data from the Instrumented baffle.
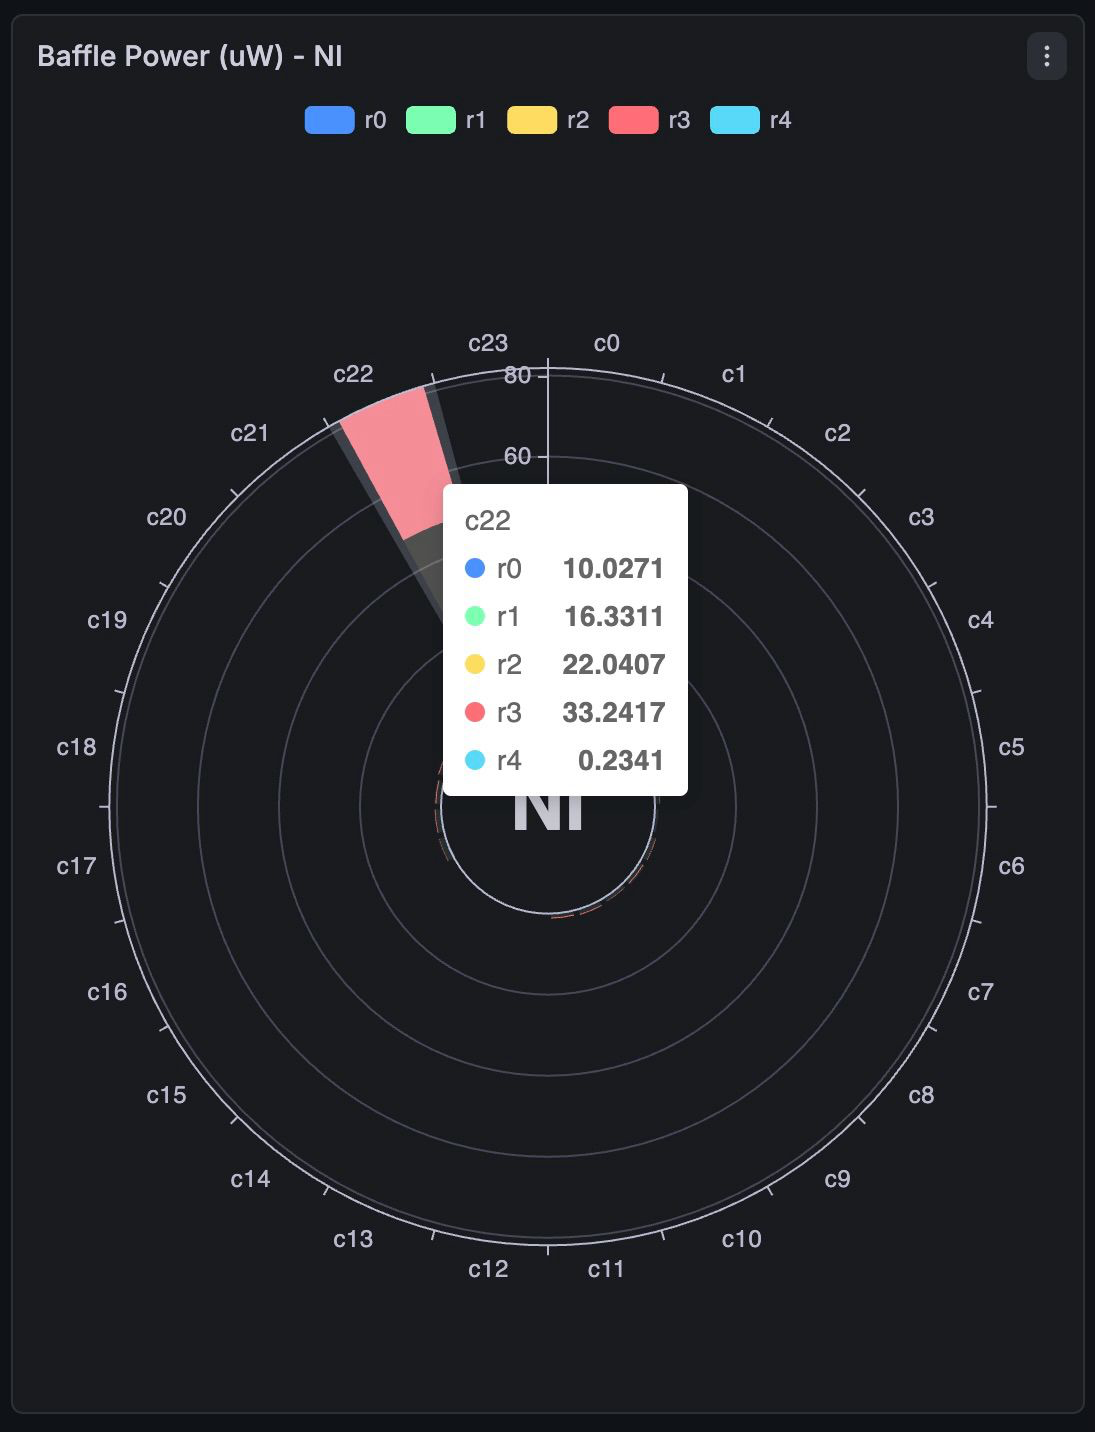
The baffle interface shows the power and radial angle positions of the 120 sensors present. The baffle has 6 different sections, each of them with 4 columns and 5 rows of sensors.
The procedure followed was to:
- Center the beam in one column of sensors and maximize the total power in that column, to make sure that the beam is directy hitting the sensors, not around them (Fig.1)
- Take note of the power of each sensor in that column, and of the note of TX and TY coordinates of the North End
- Redirect the beam into the other side of the baffle until you hit the opposite column and repeat the procedure, trying to match the detected powers to approximate the same (specular) position of the beam on the new column. Take note of the NE TX and TY coordinates
- Move the NE at the halfway points on TX and TY
Note that the power when you are above a sensor is of approximately 30 micro watts.


The current reference NTP time for some linux machines, including RTPCs, is taken from the local windows domain servers, backed by standard ntp references on the Internet.
It turns out that their pace when the remote references are unreachable is misbehaving.
There is no need to add yet another GPS receiver, for the purposes of the standard linux machines clock time (not the Virgo data frames time) It should be enough to use properly local hardware clocks.
We are going to check the windows domain servers time synchronization configuration in order to handle this corner case correctly.
This morning we continued the sanity check of the ALS beam at the ends. We started checking the status of the ALS fibers at the WE,without finding any particular issue. However, the IR power coming from the fiber was still too low to seed the amplifier.
We then went in the DAQ room were the pickoff fiber arriving from EIB is then 50:50 splitted in two beam for north and west end. At the input of the splitter, there was another fiber splitter (90:10, see fig. 1), used in the past to reduce the power without affecting the phase camera and squeezing pickoffs. As the ALS pickoff is now indipendent from the others, we decided to remove it. As a result, the infrared beam was powerfull enough to close both WARM and NARM pstab and to seed both amplifier.
Moreover, we noticed that the ALS CEB green power was also quite low (<10mW), indicating a misalignment of the beam on EIB, most probably due to the work on the BPL/BPC loops of the last weeks.
A realignment of the green beam on EIB will be done in the next days.