Reports 1-1 of 1 Clear search Modify search
AdV-TCS (Point Absorbers Mitigation)
melo, spinicelli, nardecchia - 21:21 Tuesday 09 September 2025 (67670) Print this report
IPATSiA: continuing measurements in LN2

This afternoon, we continued the shift that started on 25 July 2025 (entry 67367).

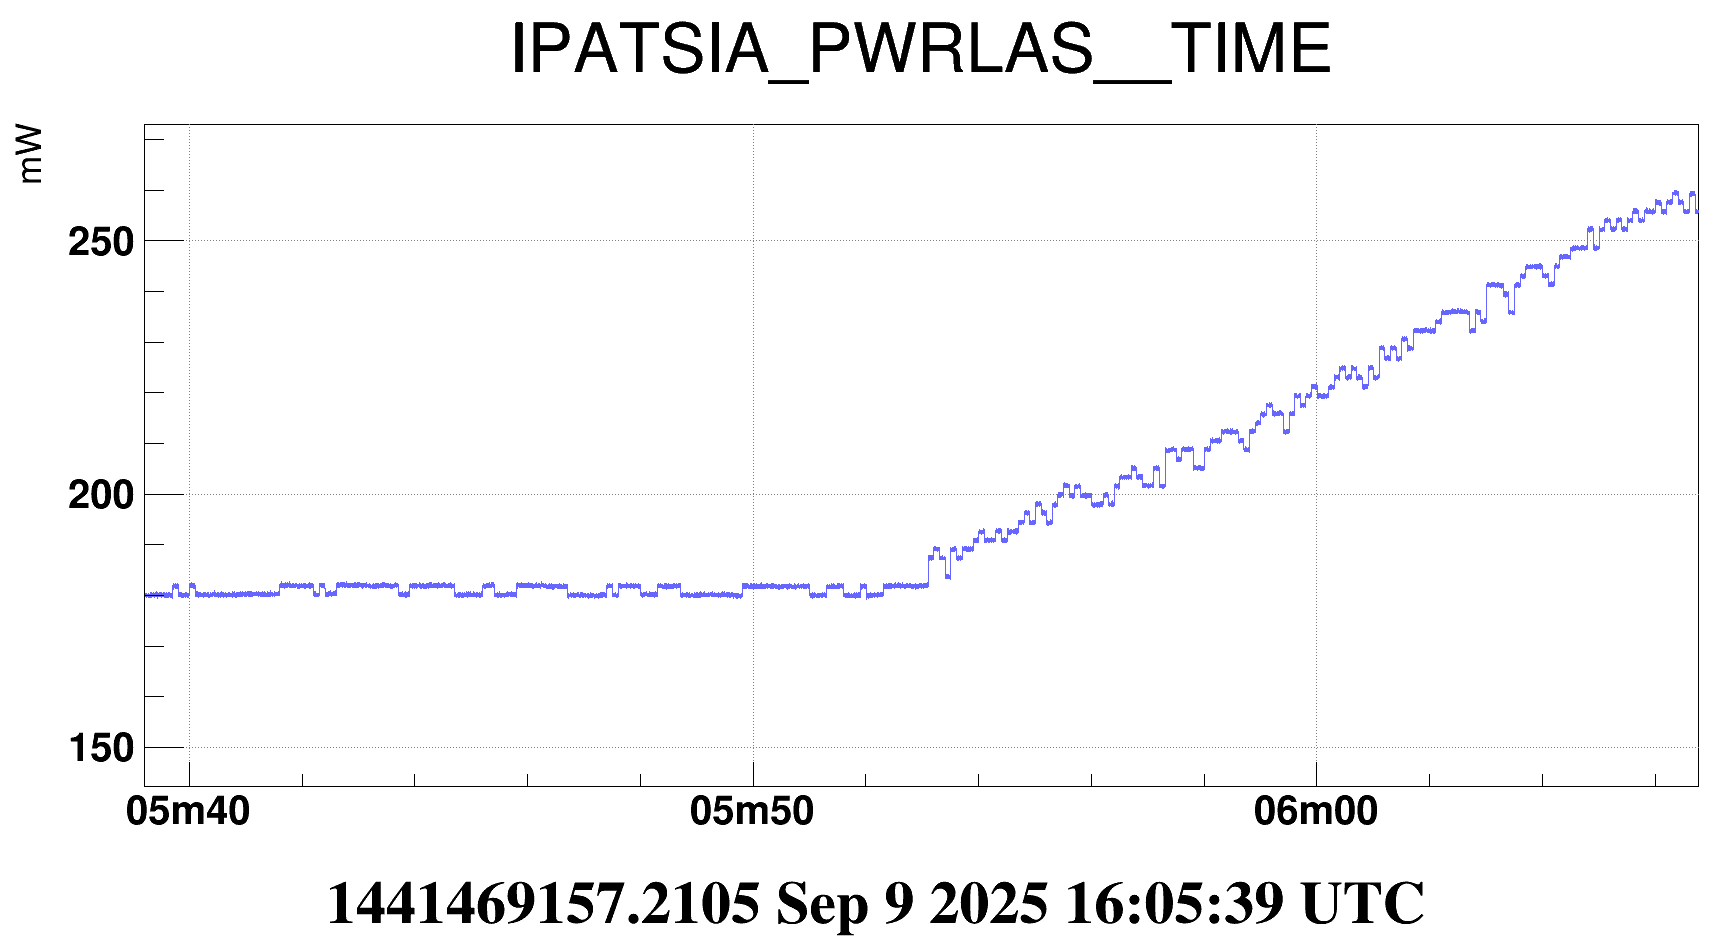
The CO2 PA was projected onto three different points on the HR surface along the horizontal direction. We started with a position slitghly different from the last point of July 25, with the same nominal injected power (~40mW). However, the temperature (and thus the power) of the laser wasn't quite stable, similarly to what we observed last time. A new chiller has been brought to WE and will be used for the next shift in order to better stabilize the temperature.

Summary of actions:

- LN2 since 14.49 UTC;

- Switch on CHILLER 10.53 UTC;

- Switch on laser at max power 10.55.35 UTC;

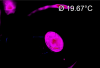
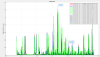
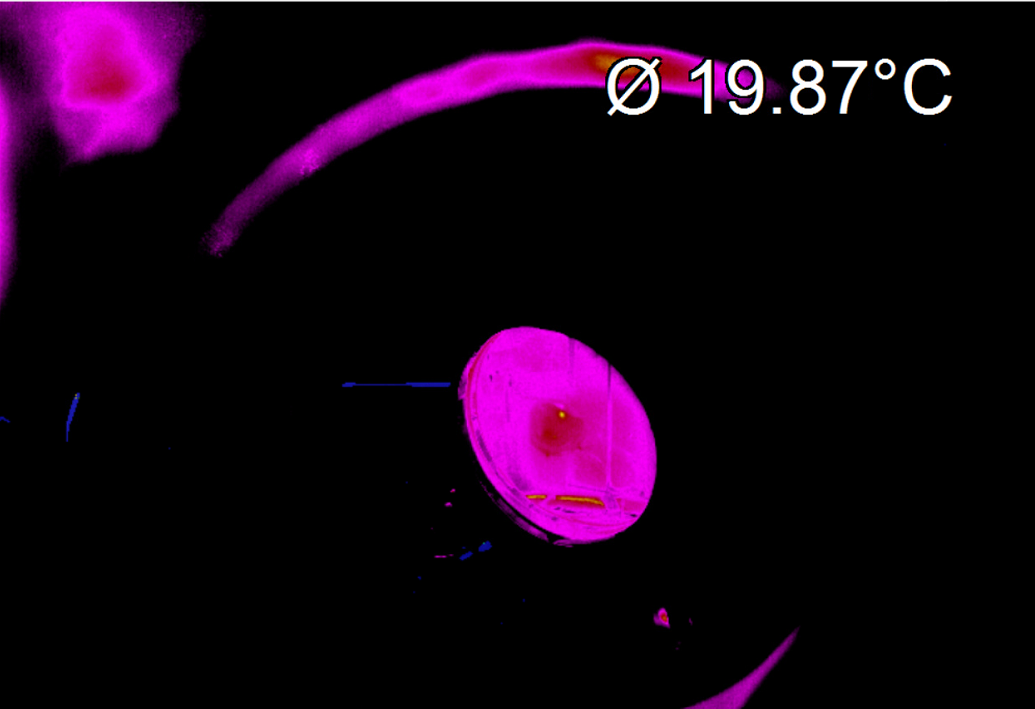
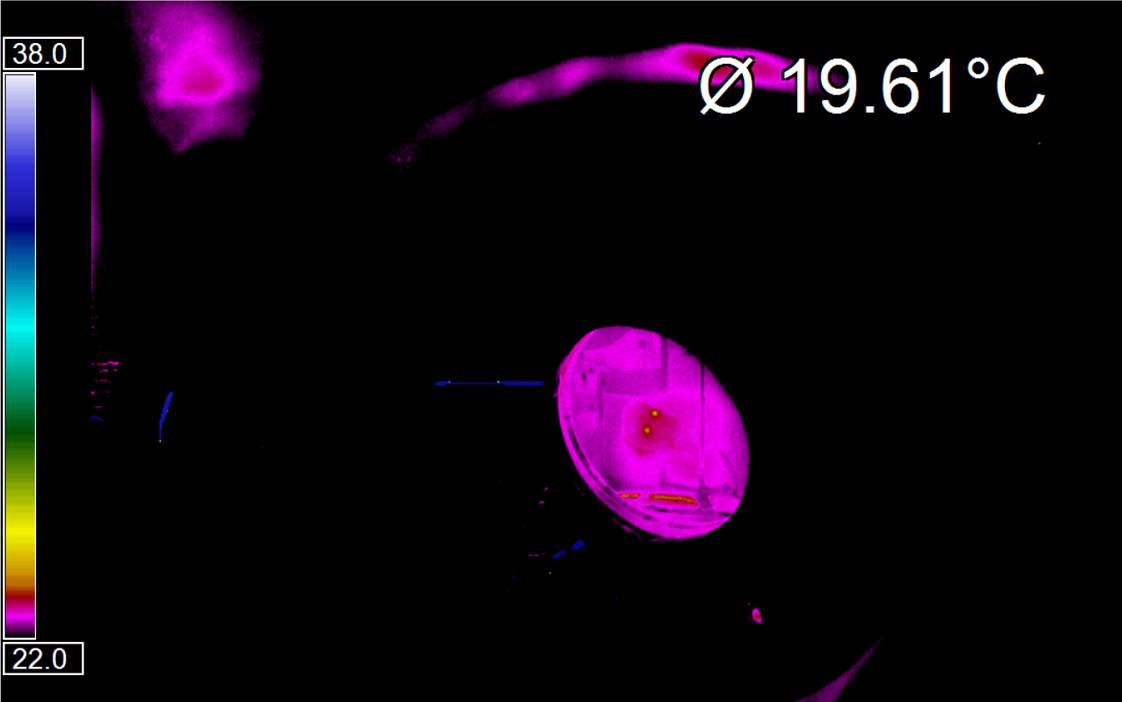
The reference image of the thermal camera without NO CO2 PA is shown in Fig.1.

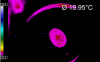
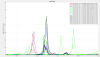
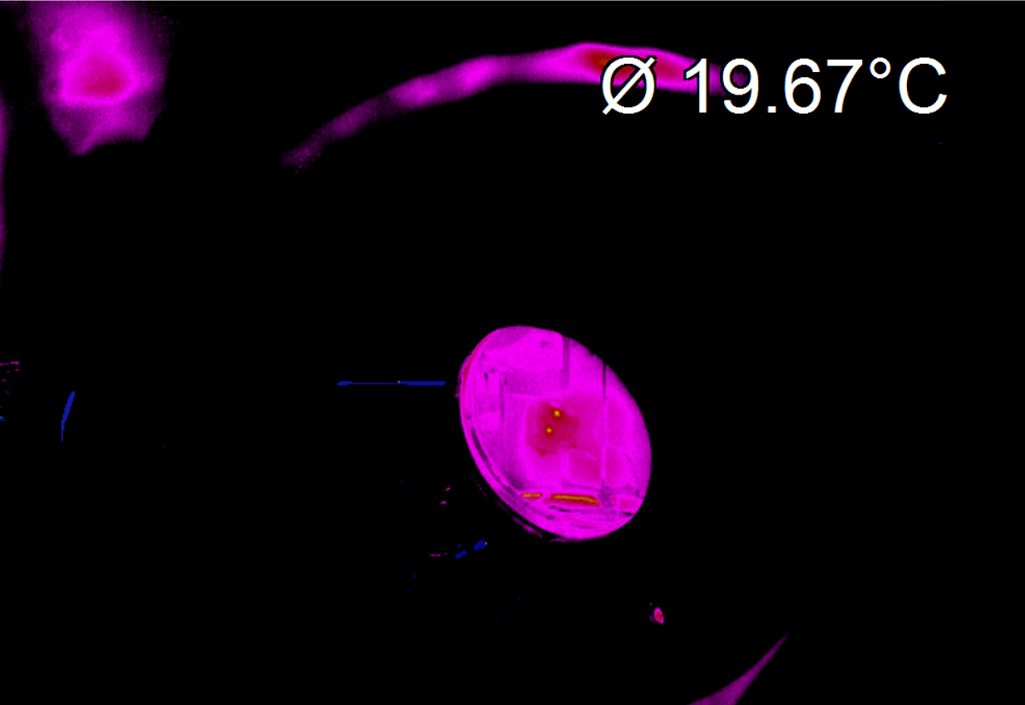
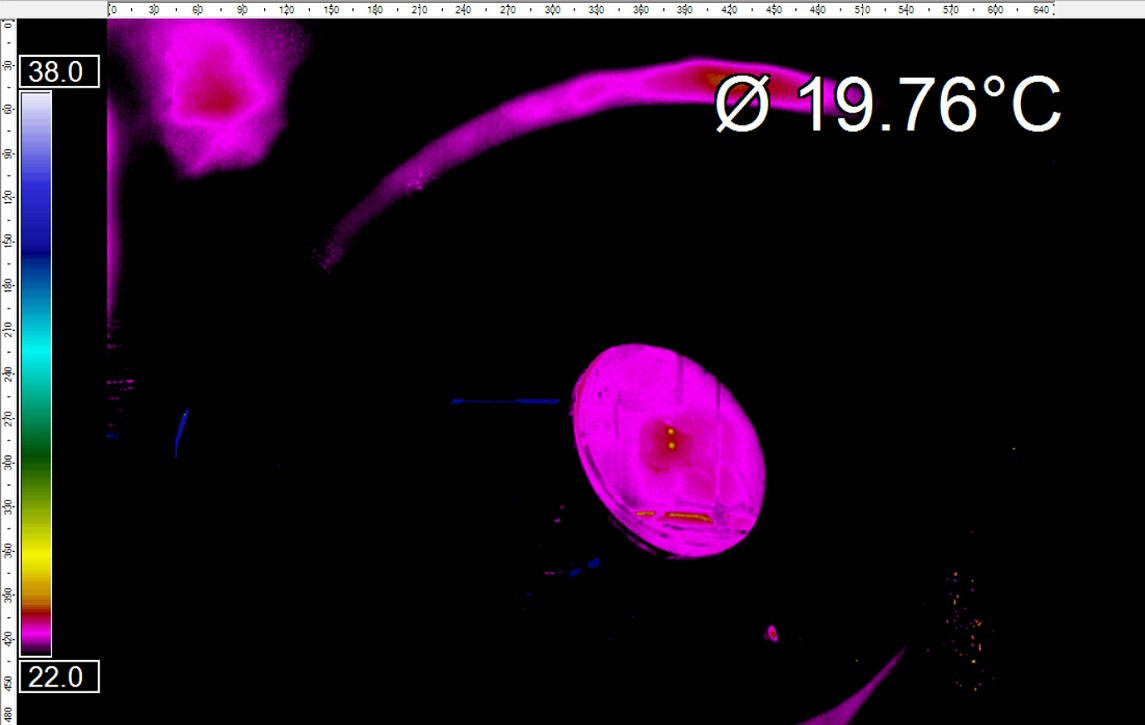
  1. CO2 PA applied in POSITION 1 (see Fig. 2). 
    • 15h17m57 UTC -> start shining 
    • 16.21 UTC ->  stop shining
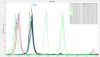
  2. CO2 PA applied in POSITION 2 (see Fig. 3).
    • 16h34m02 UTC -> Start shining
    • 17:34UTC -> stop shining
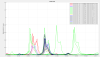
  3. CO2 PA applied in POSITION 3 (see Fig. 4, in this position, as can be seen in the figure, a new bright point can be seen to the left of the CO2-PA. We don't know the origin of this new point absorber).
    • 17:49UTC -> start shining
    •  18:39UTC -> stop shining

- Laser OFF at 18.40UTC

- Chiller OFF at 18.42UTC

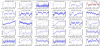
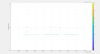
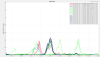
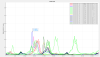
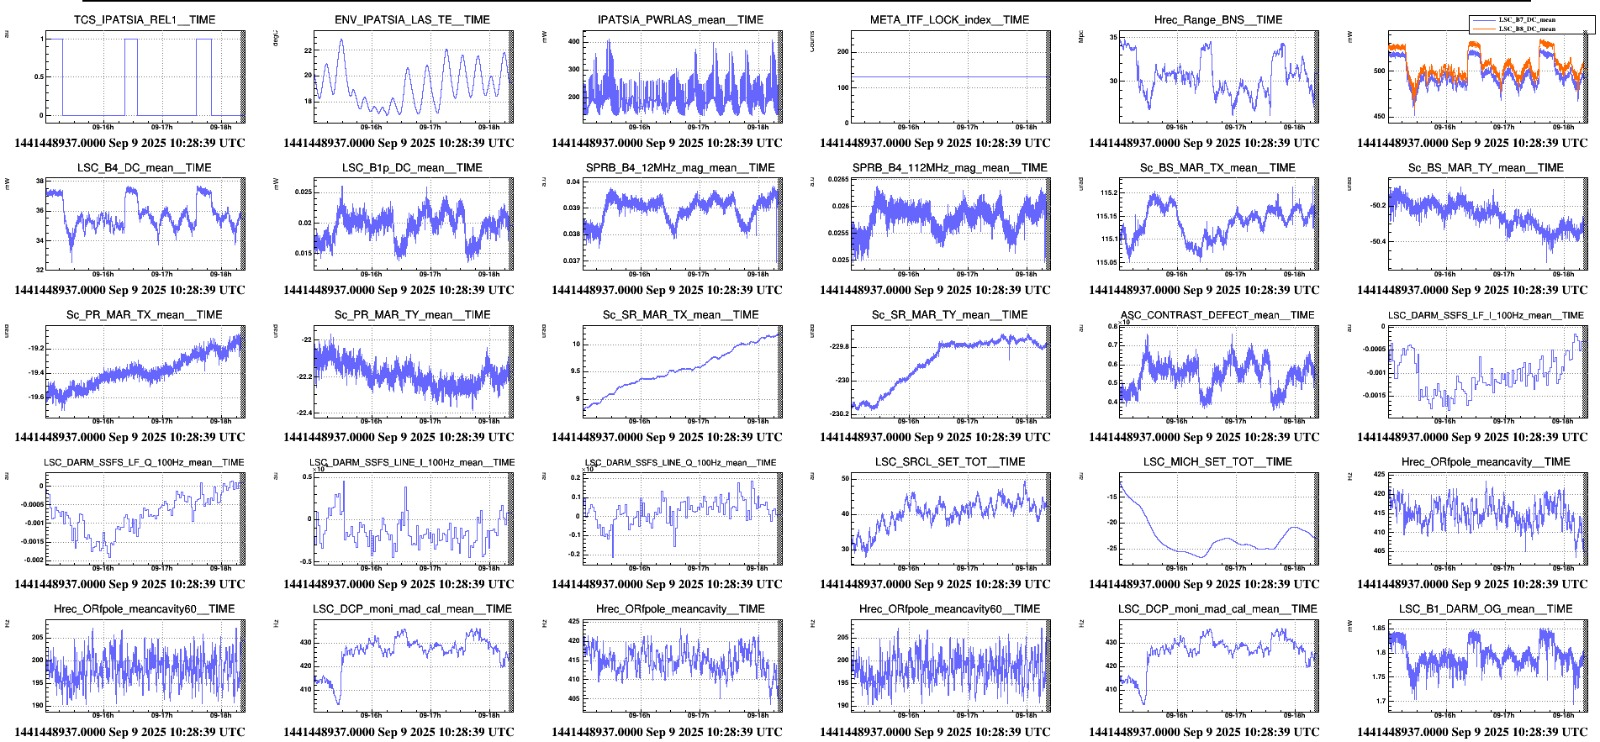
On Fig. 5 there is a summary of the main signals during the actions performed. The effect on B7/B8 of the CO2-PA in the three position is close to a ~6% of absorption. A similar effect is visible on both BNS range and B1 Optical Gain. To be noted that we reached an almost stable condition ~30' after start shining.

Further analysis will follow.

Images attached to this report
Comments to this report:
melo - 10:55 Wednesday 10 September 2025 (67674) Print this report

Figure 2 was wrong in the previous entry, it also refers to POSITION 2 (same as Fig. 3). The image of the CO2-PA in the POSITION 1 is the attached one here.

Images attached to this comment
mwas - 21:35 Thursday 11 September 2025 (67683) Print this report

Figure 1. There are glitches that appear in the sensitivity curve whenever IPATSIA shines on the mirror, and disappear when the beam is blocked. The increases in the noise level we measure when IPATSIA is shinning may be due to power fluctuations of the CO2 laser.

Figure 2. The monitoring of IPATSIA is coarse, with clearly discrete steps. This doesn't show any coherence with h(t), but also one wouldn't expect it, as the steps are not present on the light, they just represent the resolution in power measurement of the power meter.

To check if CO2 laser power fluctuations are causing excess noise in h(t) one would need a measurement of the CO2 laser power with a higher resolution. The photodiode that were designe for CO2 laser intensity stabilization would be a good candidate for this type of measurement.

Images attached to this comment
mwas - 9:21 Monday 15 September 2025 (67703) Print this report

During the IPATSiA measurement I had started the EDB OMC scan halfway through the measurement of the first point. The scan was started at 15:47 UTC and stopped at 19:37 UTC.

Figure 1. Looking at the spectrum measured by the OMC the mode distribution is at similar temperatures compared to what it was back in July . Also the height of the 56MHz LSB/USB TEM00 is the same within 10%, so the EDB OMC alignment remained reasonably good. For reference the tick marks show the position of the order 3 and order 6 mode of the carrier. The red, light green and black lines correspond to scans during the three position of IPATSiA on the mirror, magenta, yellow and dark green, correspond to the times when IPATSiA was off during measurements, and the blue are transition states where a scan straddles two different states of IPATSiA.

The results are similar to the previous test.

Figure 2. The order 2 mode doesn't show any clear relation with the IPATSiA test, and changes by a factor few.

Figure 3. The order 3 mode remains the highest mode, and is unchanged by the state of IPATSiA. This was the case also in July

Figure 4. The order 4 mode has a clear correlation with IPATSiA, as it did in July. The mode is higher by a factor ~3.5 when IPATSiA shines on position 2, by a factor ~2.5 on position 1 and 3, compared to height on when IPATSiA is off in the three different points when it is off. 

Figure 5. The order 5 mode is not affected by IPATSiA. This was the case also in July. 

Figure 6. The order 6 mode is the same for all states of IPATSiA, with the exception of position 3, where it appears to be 2 times lower than for the other points or the IPATSiA off states.

Mode 7, 8 and 9 don't show any changes regardless of the IPATSiA state.

The odd scans give comparable results. however for order 6 mode the position 3 is not an exception it has comparable power to the other two position and to the IPATSiA off states.

/users/mwas/OMC/EDB_OMC_fast_scan_20250909/EDB_OMC_fast_scan.m


Images attached to this comment
Search Help
×

Warning

Error

The present report has been modified outside this window. Please check for its integrity in the main page.

Refreshing this page will move this report into drafts.

×