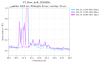
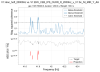
Figure 1. There is a bump in the spectrum at 42Hz. I had initially thought it was due to the Ncal line, but it stayed exactly the same when the Pcal/Ncal lines around 41Hz were switched off for one night on Feb 12. Does anyone has an explanation for that bump? It seems to be centered at 42Hz with two side lobes of almost the same amplitude at +/-400mHz around it.
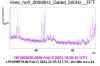
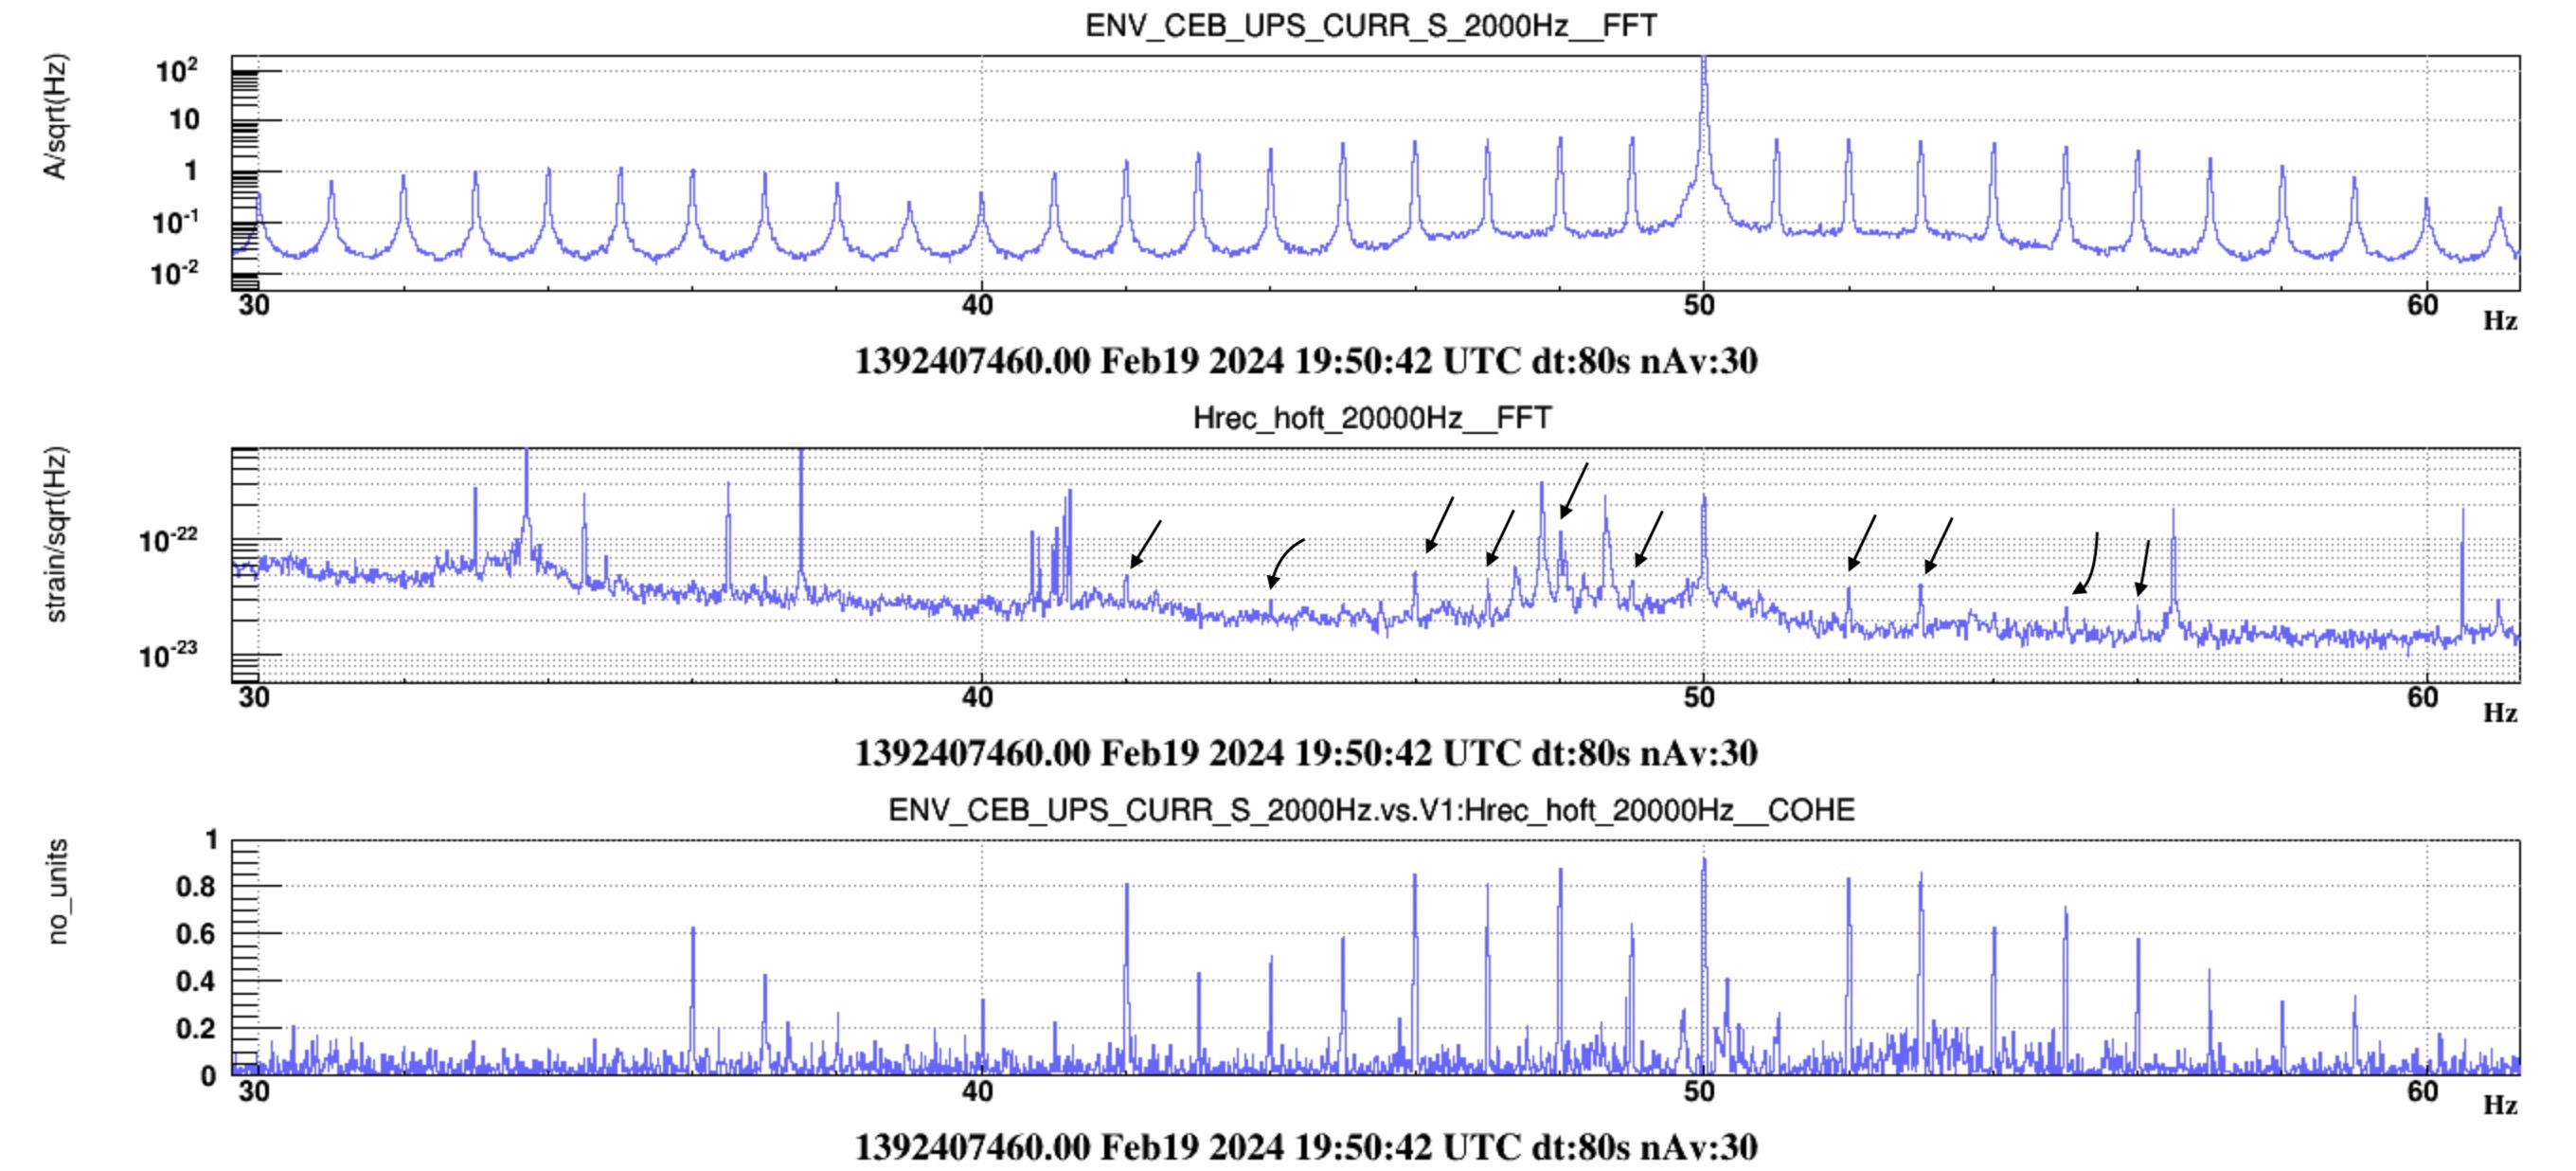
This spectral noise structure seems to be electric in origin. I have run a Bruco on the data from February 12 at 19:00 UTC: link to results. A non-negligible coherence is present at 42 Hz with ENV_CEB_{UPS,IPS}_{CURR,VOLT}_..., and with various magnetometers on the BS, DT, IB, etc. No coherence has been highlighted on the "sidebands" at +-400 mHz from 42 Hz. Interestingly, other small coherences are present at integer frequencies between ~30 and 50 Hz. These might be related to the noisy chiller described by Alain in this entry and its comments: #63274.
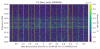
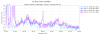
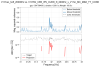
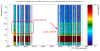
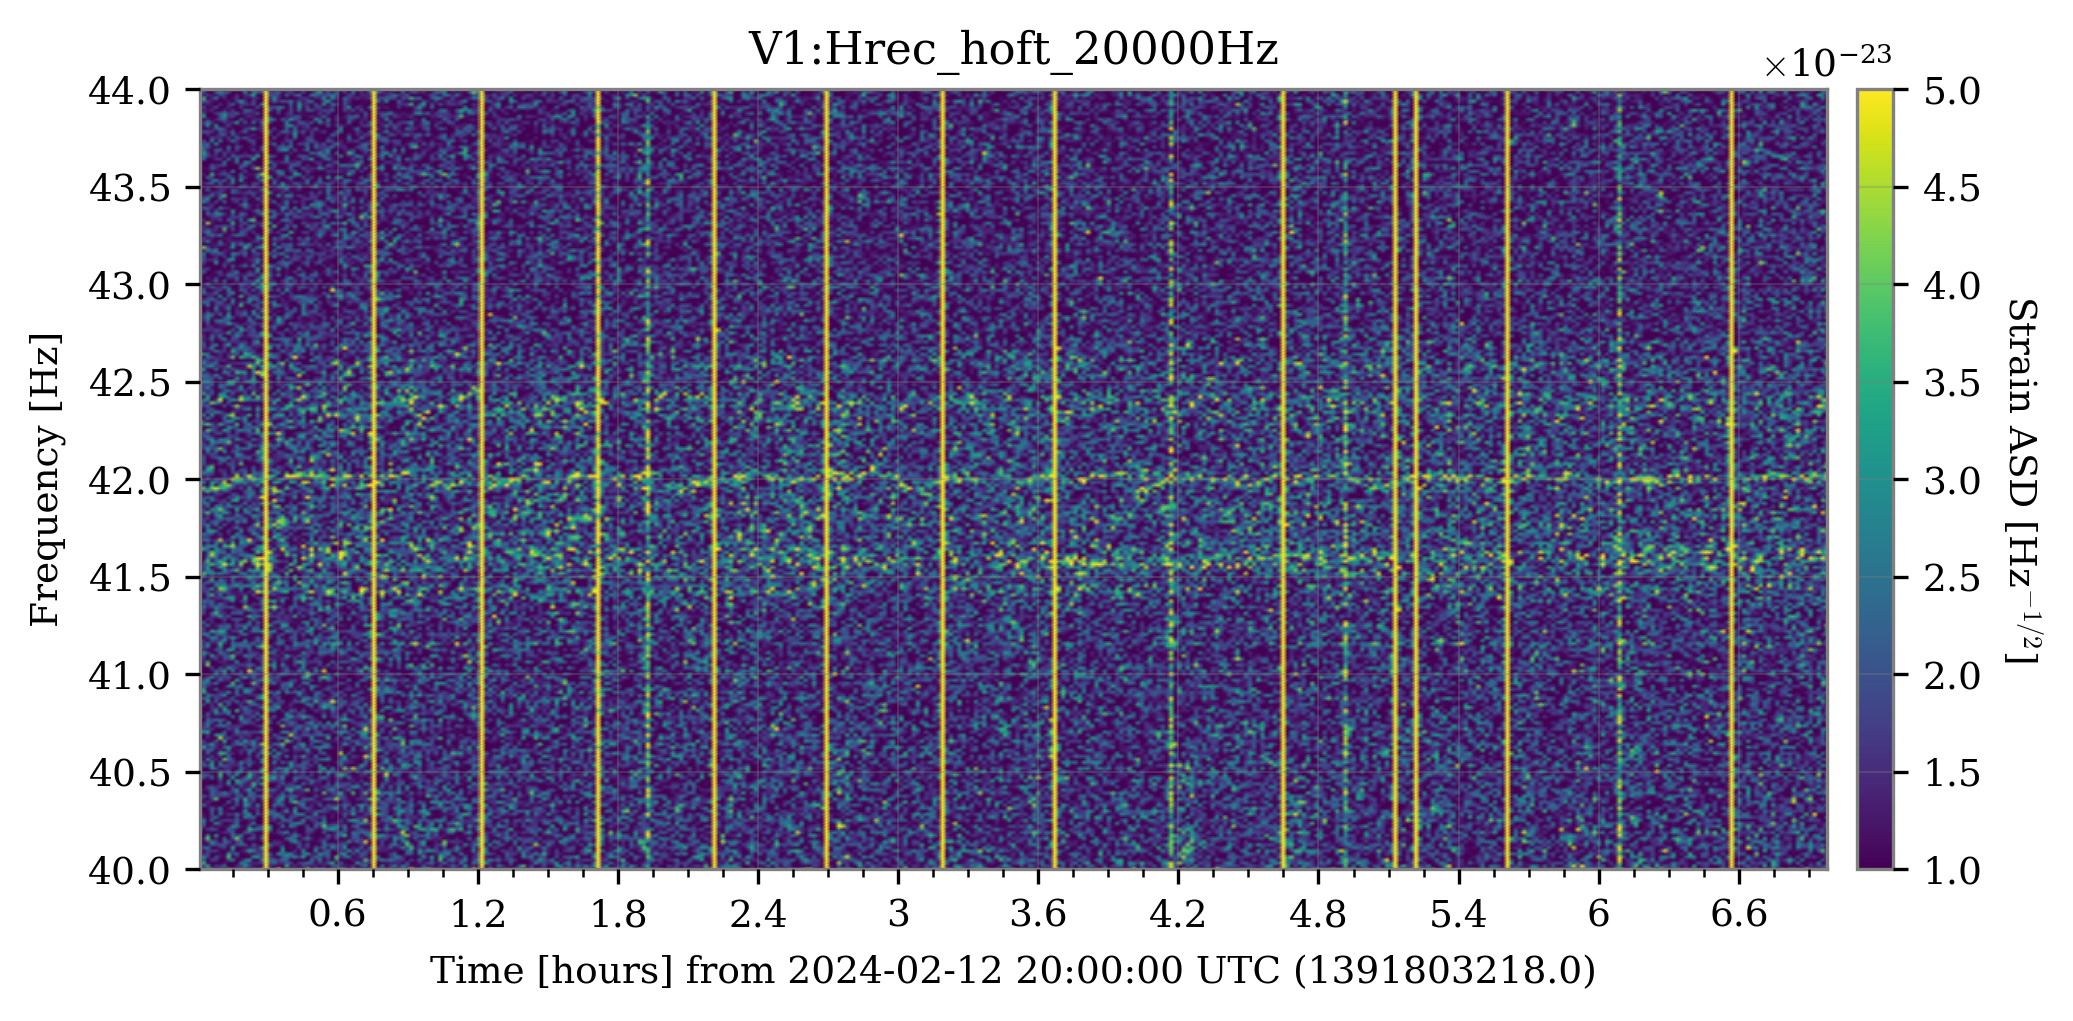
Figure 1: spectrogram of Hrec over 7 hours of data around the region of the 42 Hz structure. In fact, two sidebands are visible at approximately +-400 mHz. These may be due to some non-linear coupling, which is why they have not been caught by a coherence analysis. The 42 Hz line seems to move a little bit in frequency, as typical of the 50 Hz electric mains.
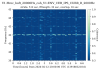
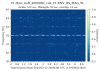
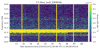
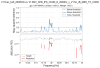
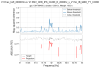
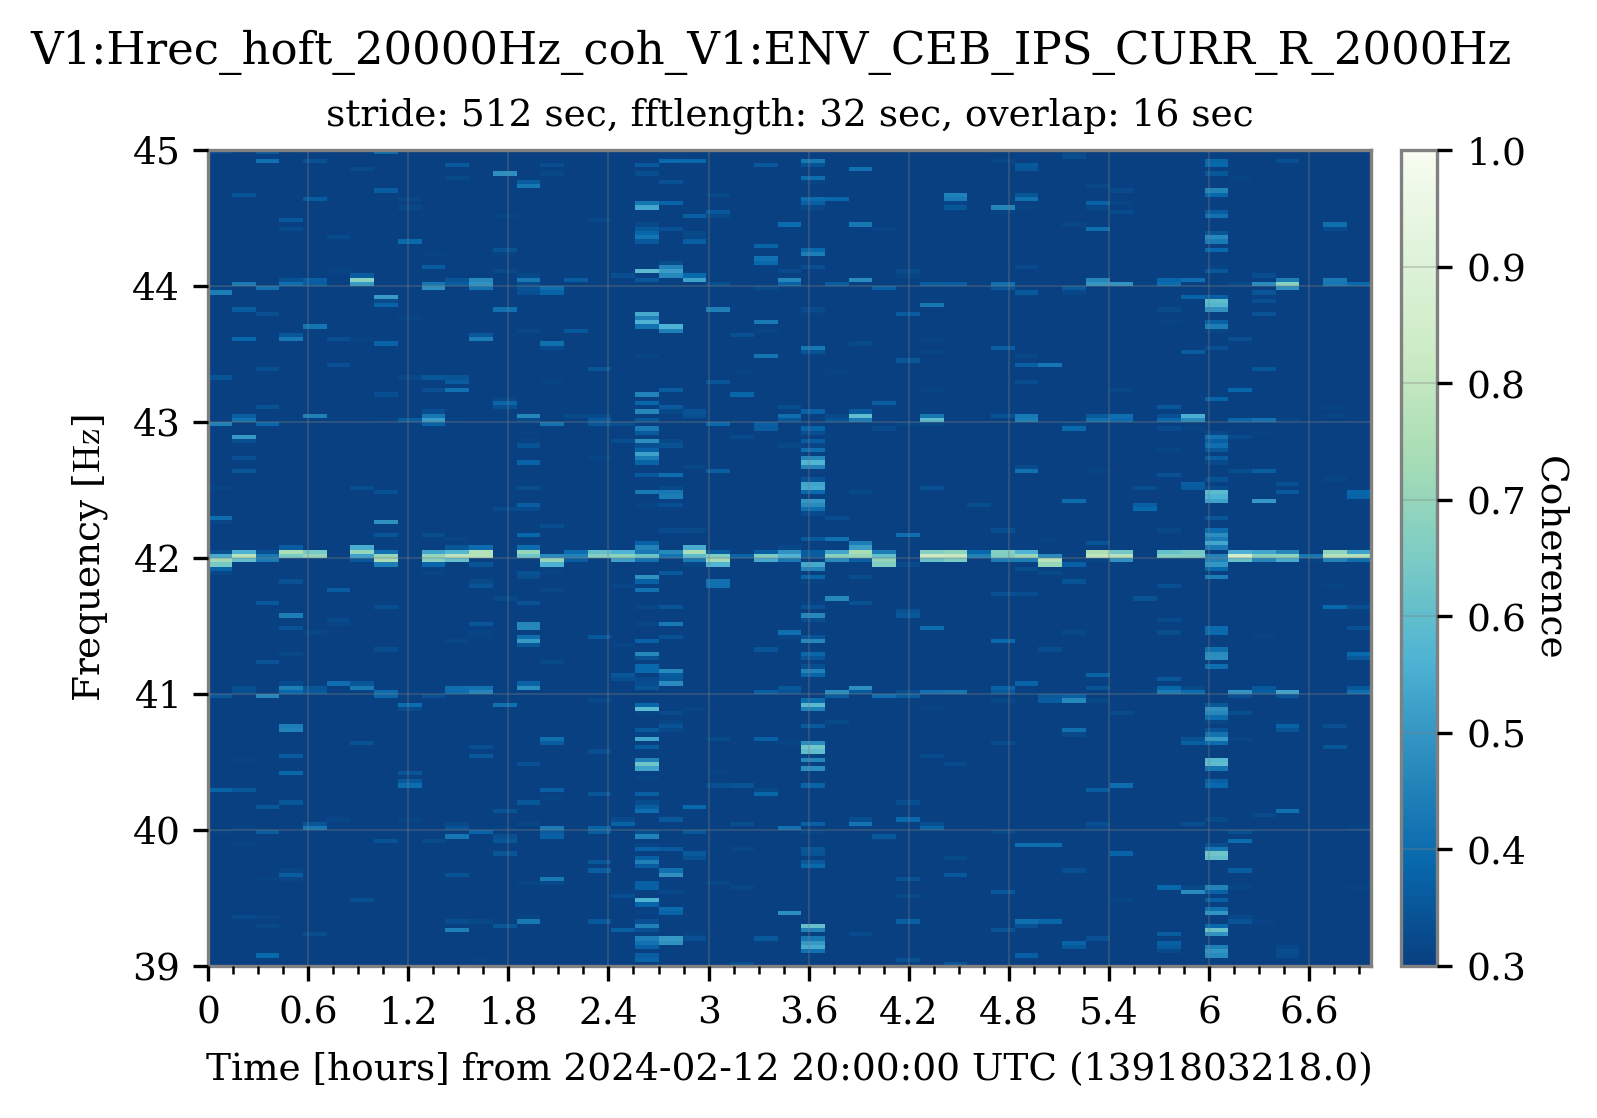
Figures 2 and 3 are coherence spectrograms between Hrec and ENV_CEB_IPS_CURR_R_2000Hz and ENV_BS_MAG_W, respectively. In these colormaps, some coherence is clearly visible at 42 Hz and, fainter, at 41, 43 and 44 Hz.
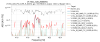
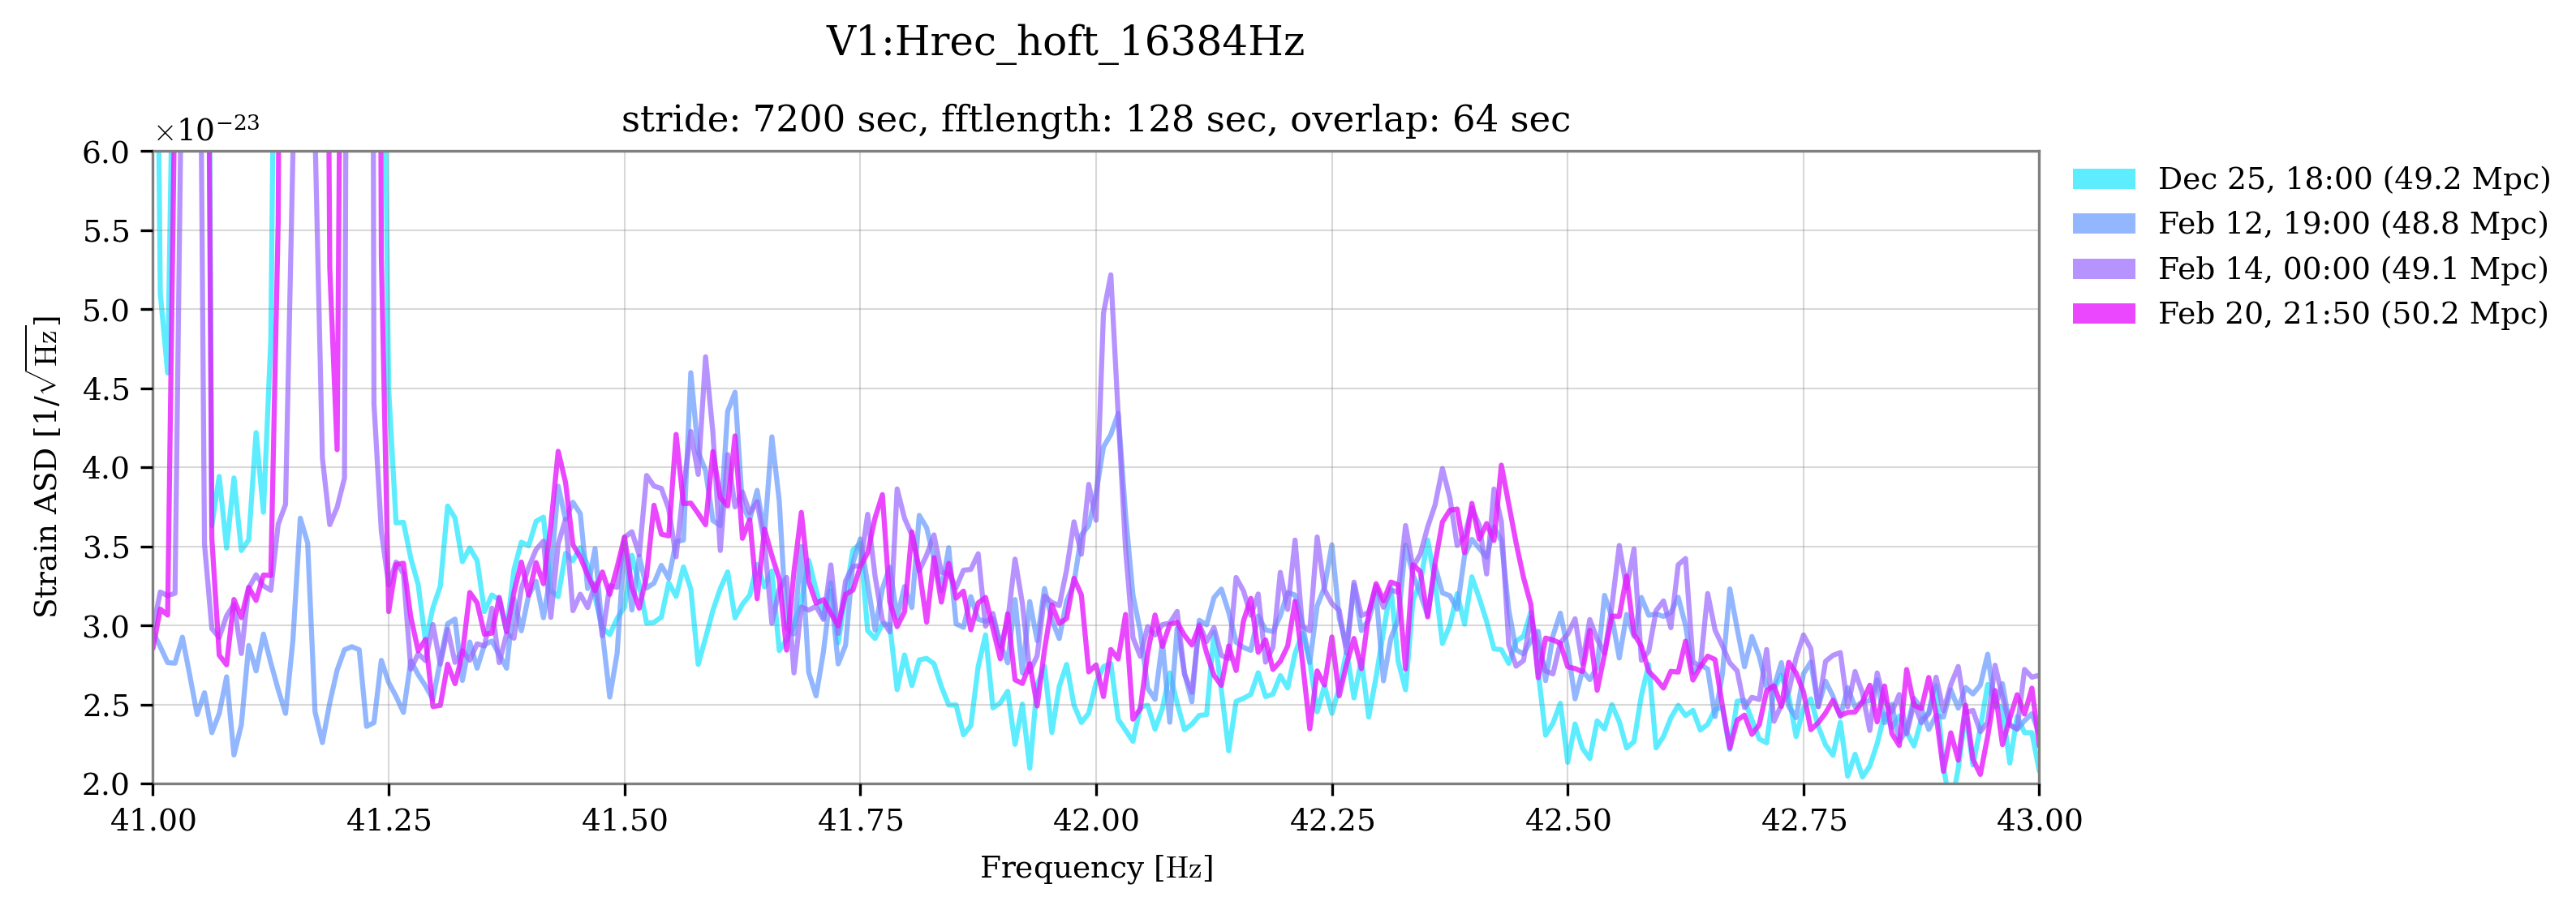
Figure 4: examining three different periods, Dec 25, Feb 12 (no Ncal), and Feb 14 (Ncal back), it seems that this excess noise at 42 Hz was not present during the mini-Engineering Run. Still, some structures are visible at 42.4 Hz (but not at 41.6 Hz). Concurrently, as shown by daily BruCo results for the ENV channels, no coherence with the above CURR and MAG channels was present during the days of the mini-Engineering Run at integer frequencies. This seems to confirm that the comb has appeared late (following the hint in #63274).
It seems that the chiller swap (#63338) removed the line at 42 Hz, as well as the comb of 1 Hz lines identified by BruCo and in the logbook entry #63339, but not the sideband structure at 400 mHz around the 42 Hz line.
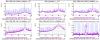
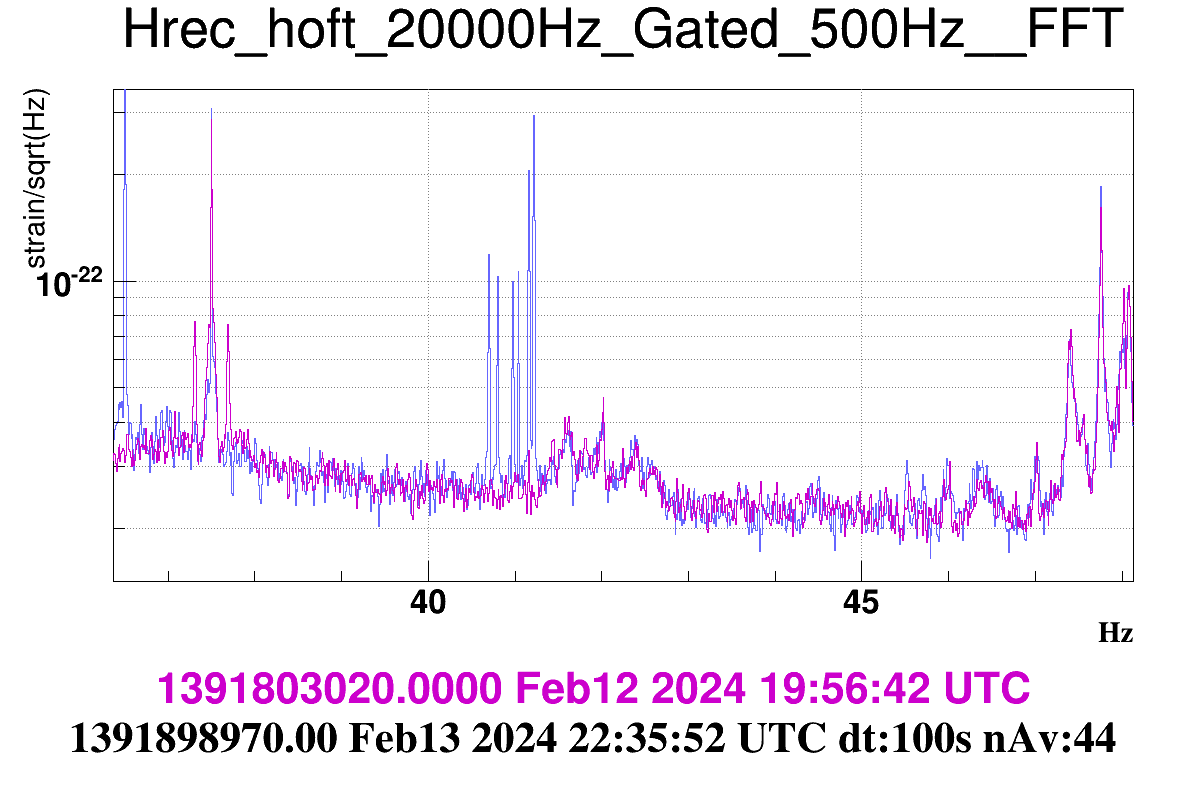
Figure 1 shows the comparison of the ASDs estimated at four different times. Dec 25: no line at 42 Hz, small structure at 42.4 and probably nothing at 41.6 Hz. Feb 12: no Ncal lines but both the 42 Hz line and its sidebands are visible. Feb 14: Ncal on, 42 Hz line and sidebands visible. Feb 20: no 42 Hz line but the surrounding structure is still present.
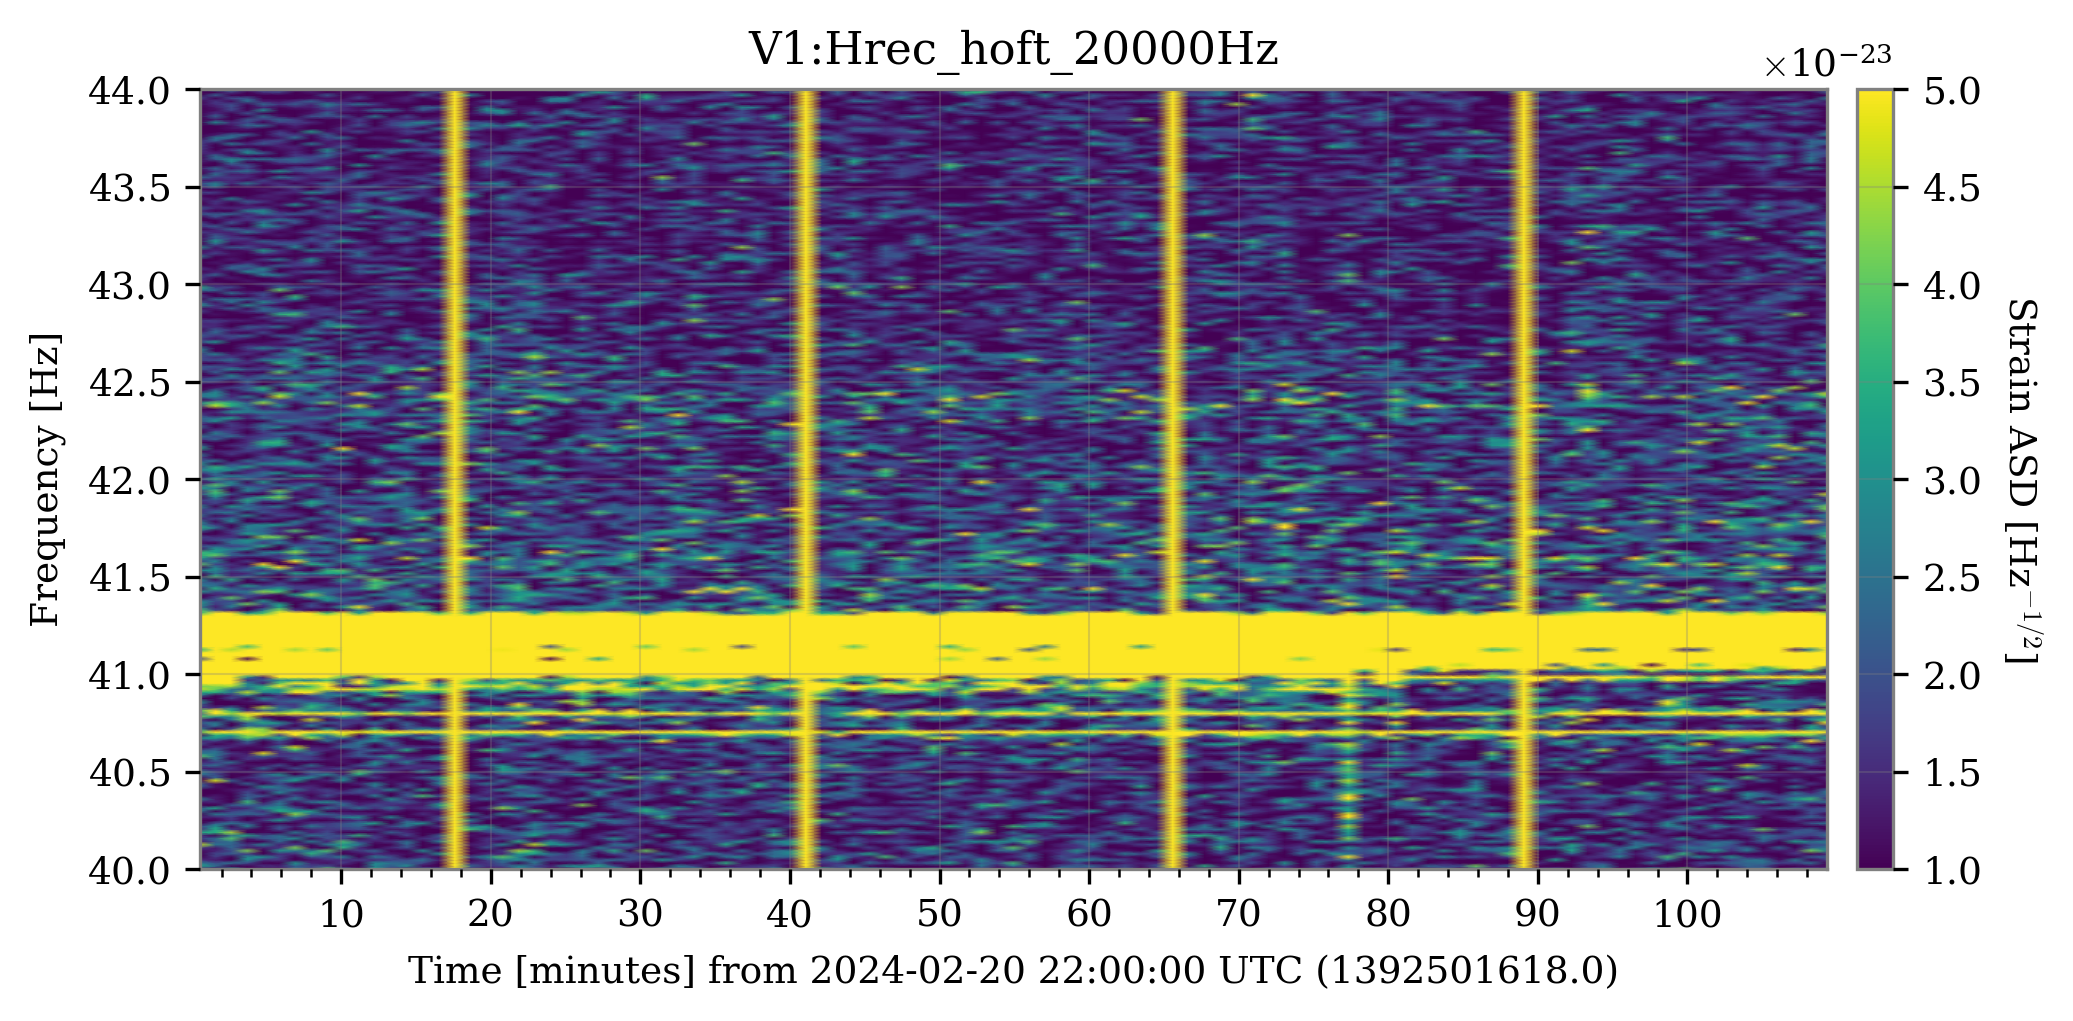
Figure 2: spectrogram of Hrec data from Feb 20 in the region around 42 Hz. The 42 line is not visible anymore but some excess of noise over the baseline is visible at ~42.4 Hz. The vertical yellow lines are the well known 25-minute glitches, while the horizontal lines between 40.5 and 41.5 Hz are the Ncal lines.
At this link, you can find the results of a BruCo run on the data from February 20, after the chiller swap. The coherence at 42 Hz is greatly diminished, as well as at the other integer frequencies between 30 and 49 Hz (the 50 Hz is excluded, of course).
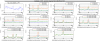
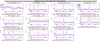
To understand the origin of the structures around the 42 Hz line, I ran a bilinear noise coupling analysis with MONET on the data from February 12, using ENV_CEB_IPS_CURR_R as the carrier. The results are summarized in the attached text file and, partially, in Figure 3. The structures below 42 Hz are not well caught by the model and angular modulators used, with the possible exception of the structure around 41.8 Hz, predicted with Sc_NI_MIR_Y_AA as a modulator: Figure 4. The sideband at 42.4 Hz instead seems to be correlated with Sc_MC_MAR_TY_CORR as a modulator: Figure 5. Other interesting modulators, appearing all over the 42-43 Hz band are the Sc_IB_MAR_T{X,Y,Z}_CORR channels: Figures 6 and 7.
Further comments:
- Figure 1: looking at Hrec spectrogram, the noise structure seems to be present in Hrec since Jan 20 becoming more persistent by Jan 25 (after the increase of the power to 15 W).
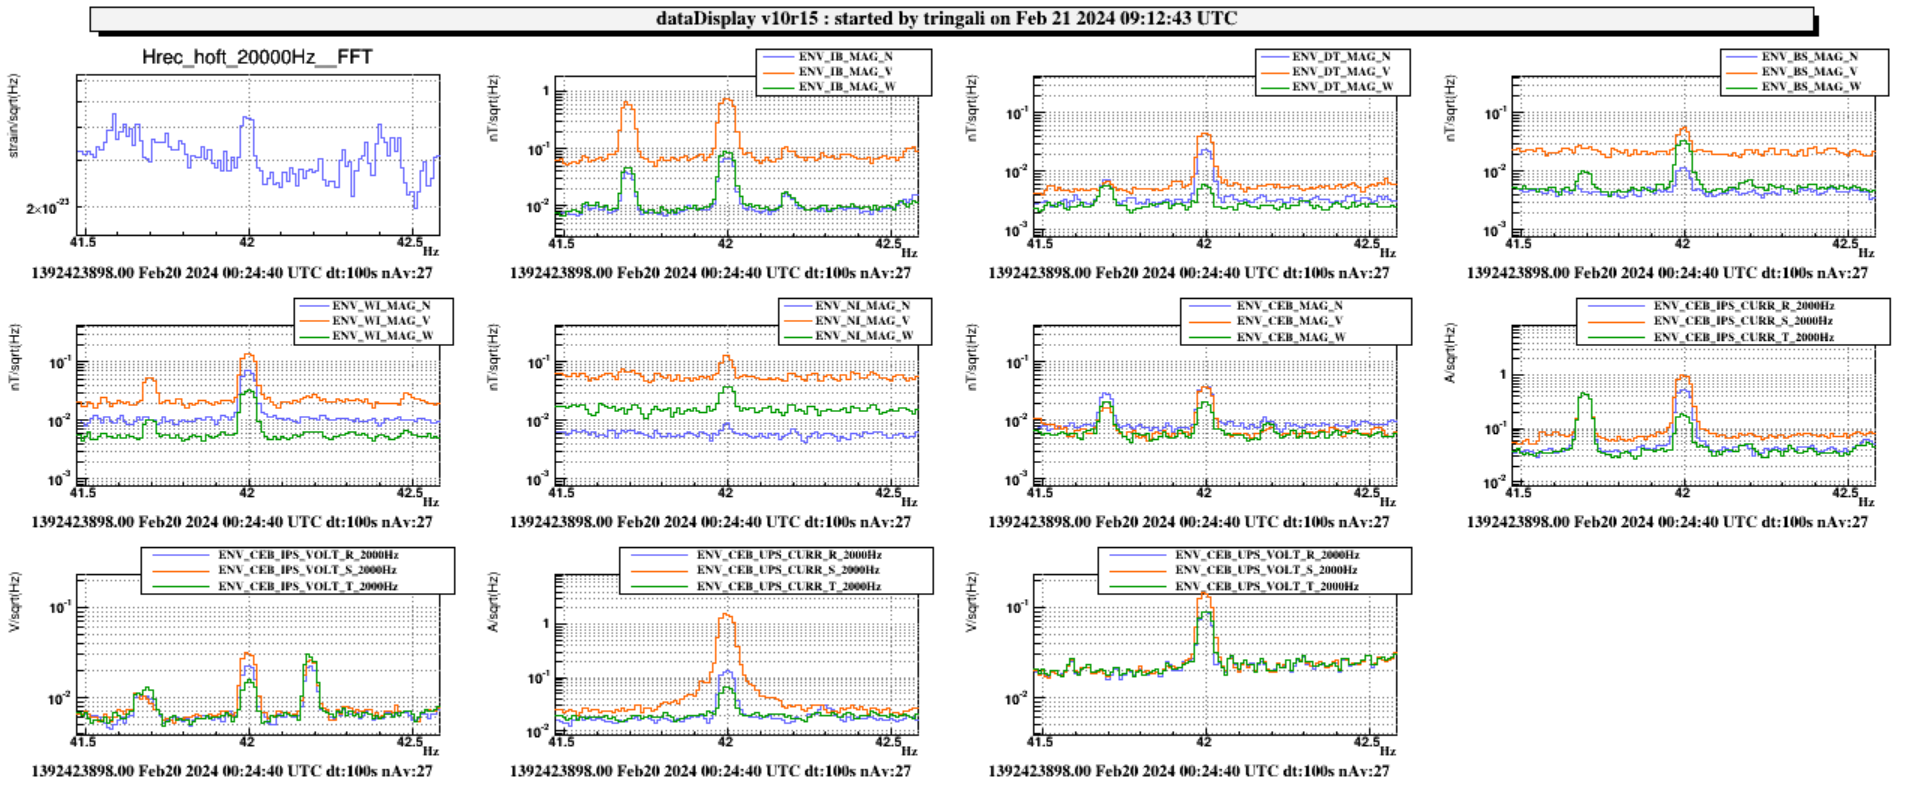
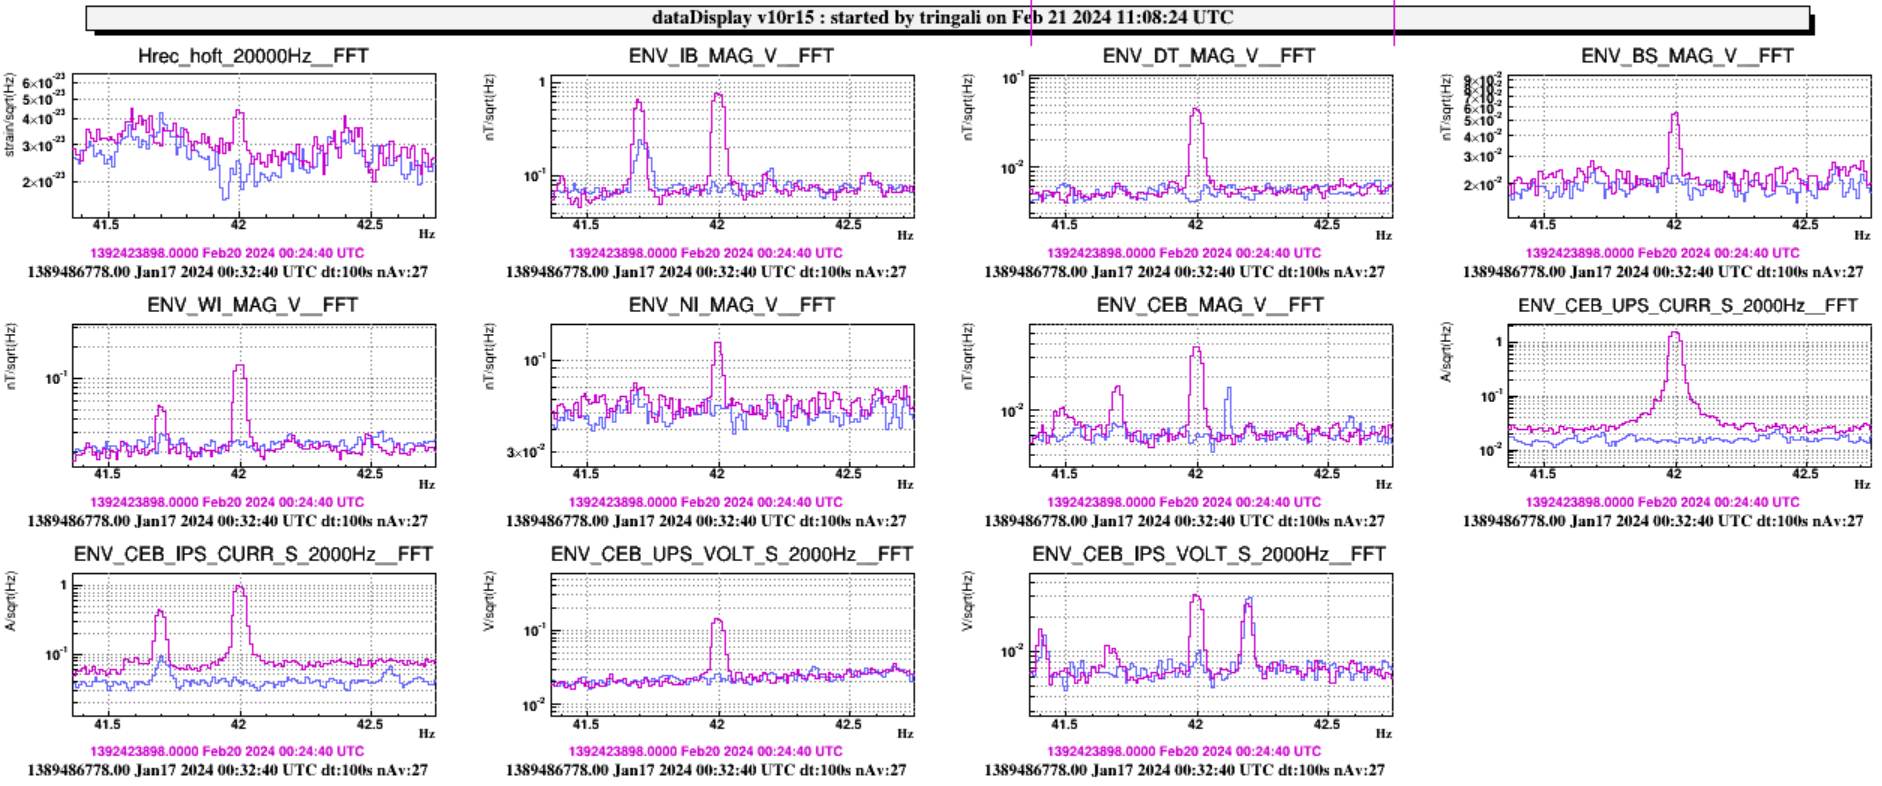
- Figure 2: looking at the spectra of the CEB magnetometers and CEB UPS/IPS current and voltage monitors
- the amplitude of the structure at 42 Hz seems to be higher in the magnetometer (ENV_IB_MAG*) on the west side of the INJ tower ;
- it is more visible in the S phase of the UPS/IPS current and voltage monitors.
- Figure 3: this structure arose in Hrec and the environmental sensors during the same period.
In the past, we observed a magnetic line at 42 Hz associated with the 7th harmonic of the return fan of clean room AHU.
We will perform further investigation.
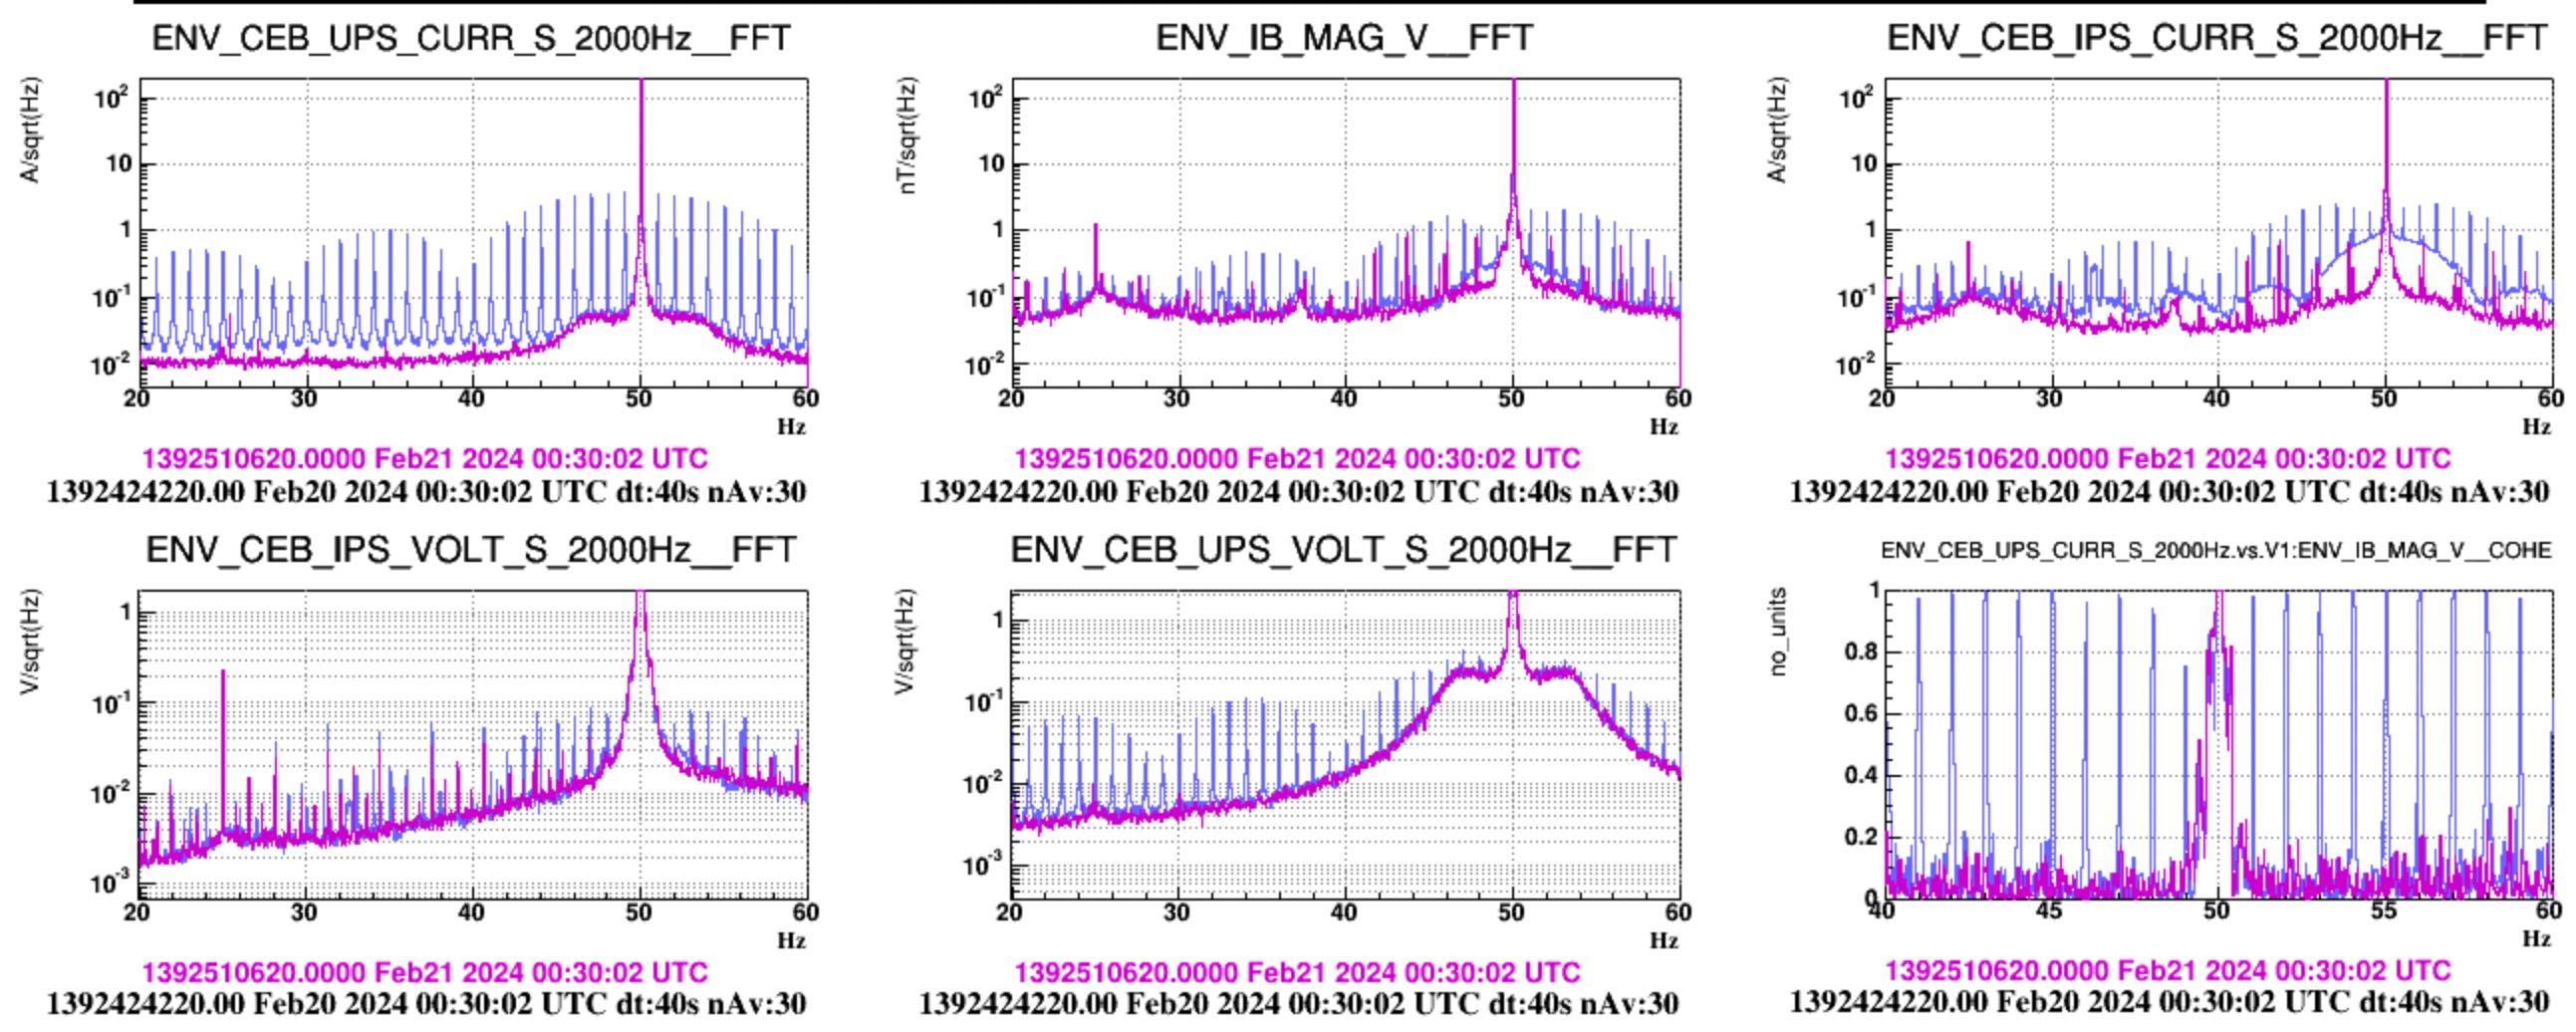
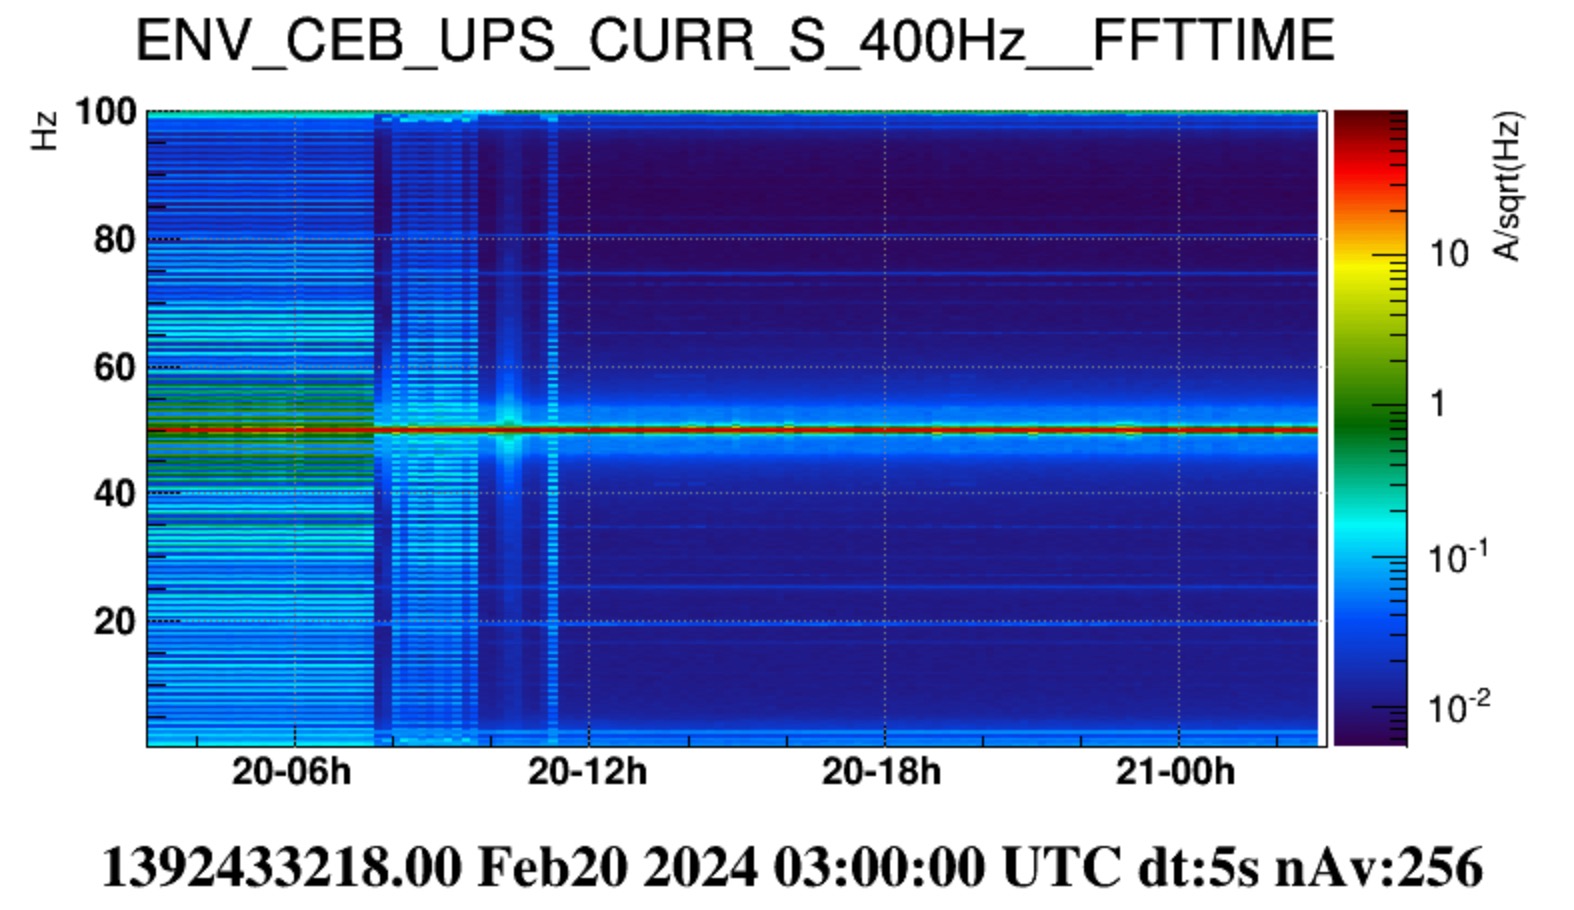
The 42 Hz peak looks to be part of a comb of 1 Hz spaced lines which is well visible in CEB UPS current voltage monitors. The noise has disappeared now. From past investigations (https://logbook.virgo-gw.eu/virgo/?r=40113) a possible source of this comb are the TCS laser chillers. In a study performed at that time with the TCS team we found that when setting the chiller in "power save" mode the comb disappeared.
The second figure shows that the comb diasppeared yesterday morning (maintenance time). It has to be better checked if some operation with the TCS chillers occurred at that time
It looks that the same noise that was causing the 42 Hz peak in Hrec indeed produced a comb of narrow peaks, visible in Hrec from about 40 Hz to 60 Hz.
The attached plot shows hrec data of 55 Mpc, with 80s resolution. It is interesting to investigate better the coupling path.
It seems like a lot of thigs are going on in this small frequency interval just after the Ncal lines. To better understand the structures at around 42 Hz, we made several high resolution ASDs across January and February. The attached GIF image and the associated (static) PDF file describe the evolution of the line and bump structures over this period. This is a summary with some observations:
Jan 15: no line at 42 Hz but some structures are already visible at 42.4 Hz, as well as a small peak at 42.4 Hz. What I initially thought were sidebands of the 42 Hz line (ref. #63340) seem in fact to be not.
Jan 17: Another small peak at 41.65 Hz.
Jan 18: Increased noise baseline and new structure between 41.7 and 41.9 Hz.
Jan 19: The structure that just appeared seems to have moved to around 42 Hz. This structure appears to drift until Jan 22, as visible in this spectrogram.
Jan 20:: Sharper peak at 42 Hz.
Jan 21: New peak at 41.8 Hz, and structure centered at 42.1 Hz.
Jan 22 3:00: Peak at 42 Hz. This seems to come before the installation of the new chiller happened on Jan 23: #63062. The previous structure has now drifted to 42.2 Hz, and is different than the 42.4 Hz structure already documented.
Jan 22 11:40: the peak at 42 Hz is not visible but the structure at 42.2 Hz is now larger.
Jan 25: The 42 Hz peak is clearly visible. The structure at 42.2 Hz is either disappeared or merged with that at 42.4 Hz. The noise baseline is low.
Jan 26: Increased noise baseline.
Jan 27: The peak at 41.8 Hz is back...
Jan 28: ...and gone.
Feb 6: Increased peak at 41.6 Hz. The structure at 42.4 Hz seems wider.
Feb 9 and 11:New structure at 42.6? Is that part of what constituted the 42.4 Hz bump?
Feb 16: Dtructures at 41.4, 41.6, 42.4 and 42.6 Hz, in addition to the peak slightly before 42 Hz.
Feb 20: 42 Hz line disappeared after the chiller replacement: #63338. Structures at 41.4 Hz, 41.6 Hz, 42.4 Hz and slightly before 42.6 Hz are still visible but are likely not related to the 42 Hz line: they are no sidebands.
Some high resolution BruCo analysis should be done to understand the origin of the residual structures. The argument --medianpsdestimation , new to version 3.2, should provide handy to avoid the spectral estimations being spoiled by the 25-minute glitches. Additionally, this analysis proves that we need a tool that automatically performs periodic comparisons between spectra.