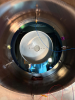
Today we enter the WI tower to clean it with nitrogen top gun
*** Mechanical Transfer Function Measurement of the WI Instrumented Baffle ***
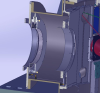
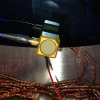
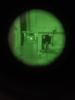
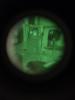
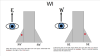
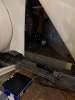
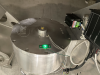
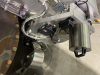
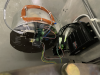
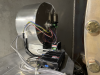
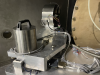
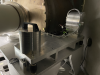
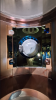
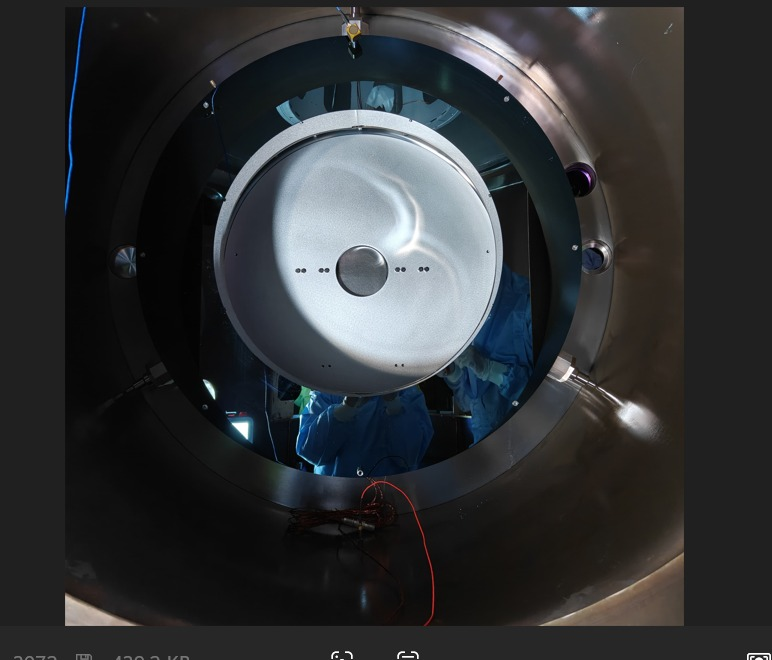
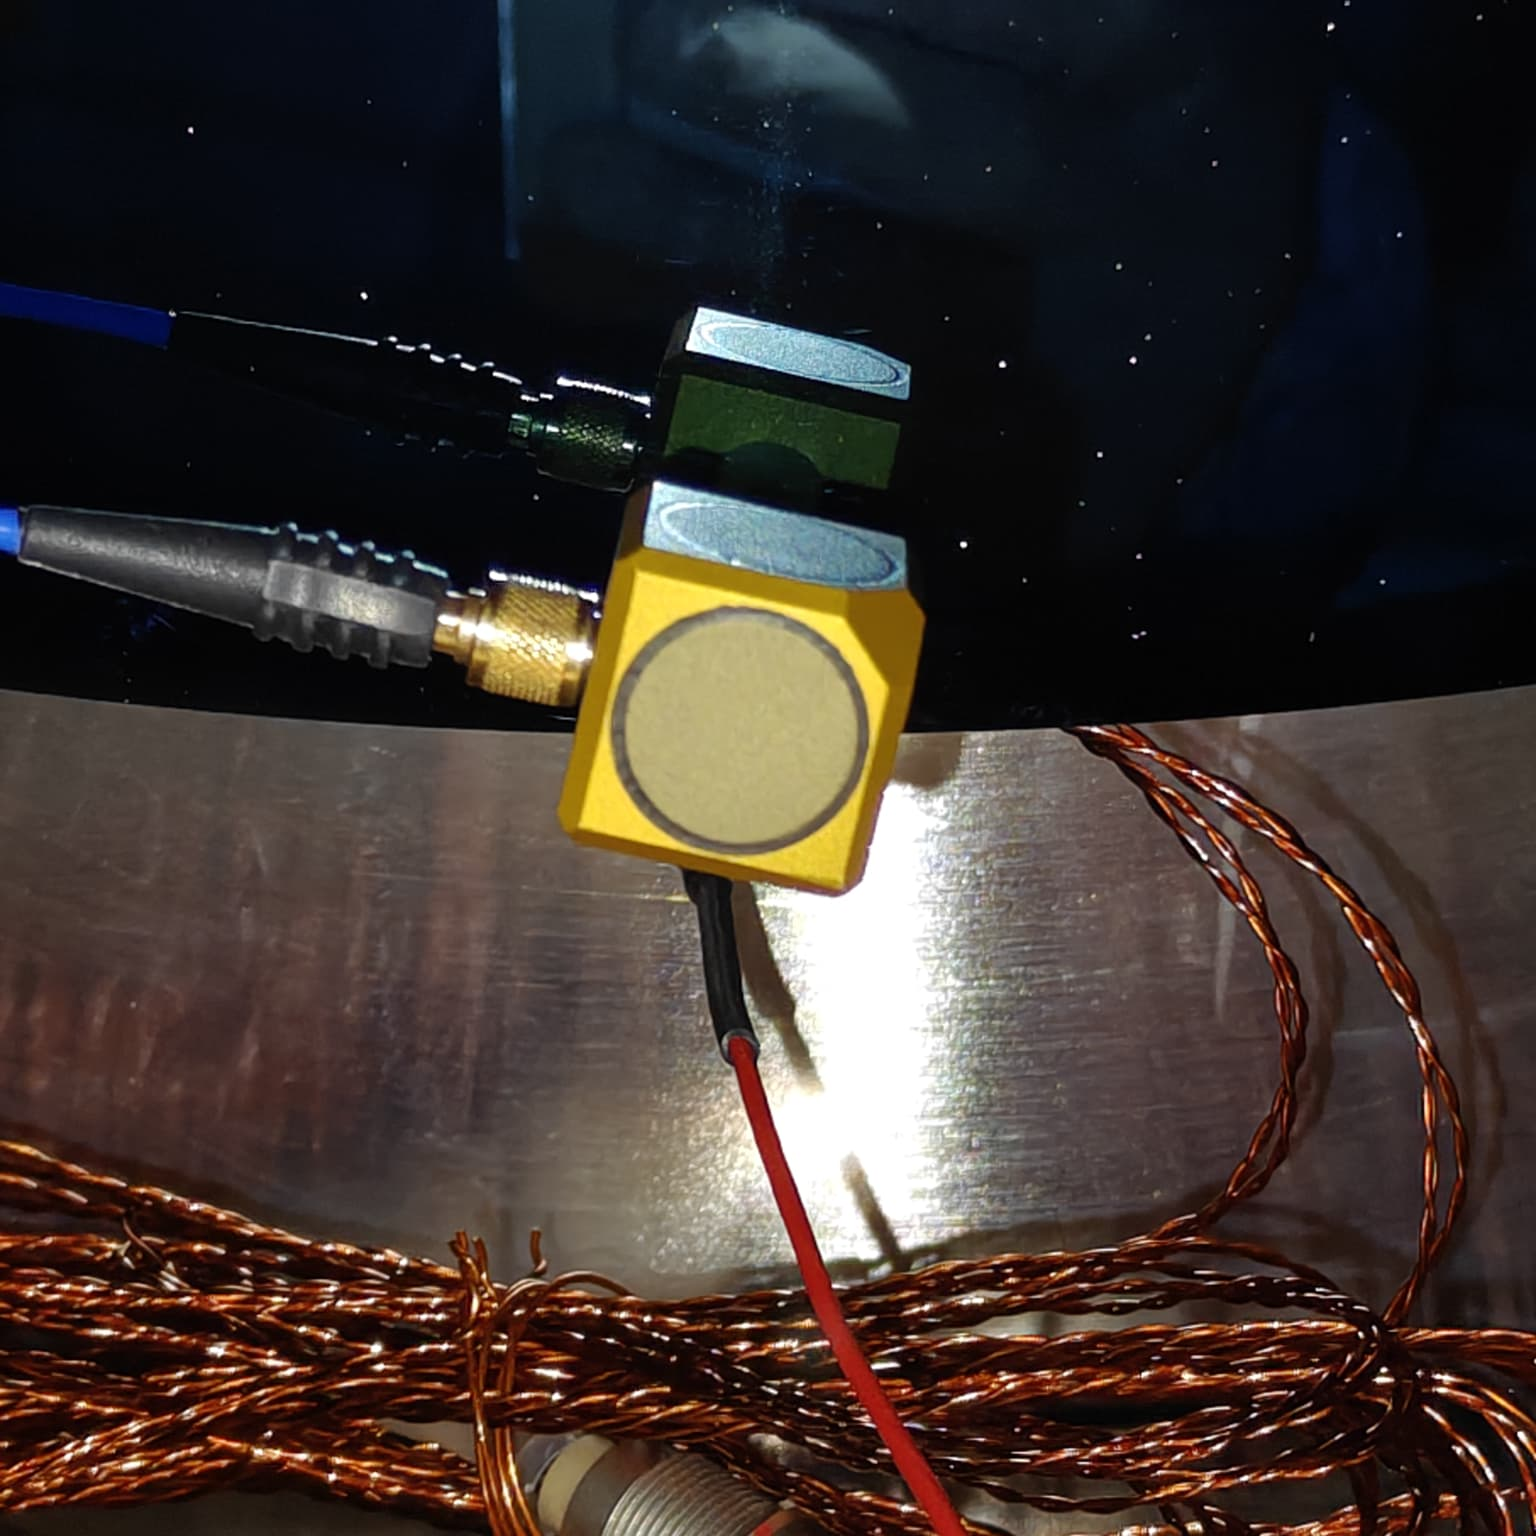
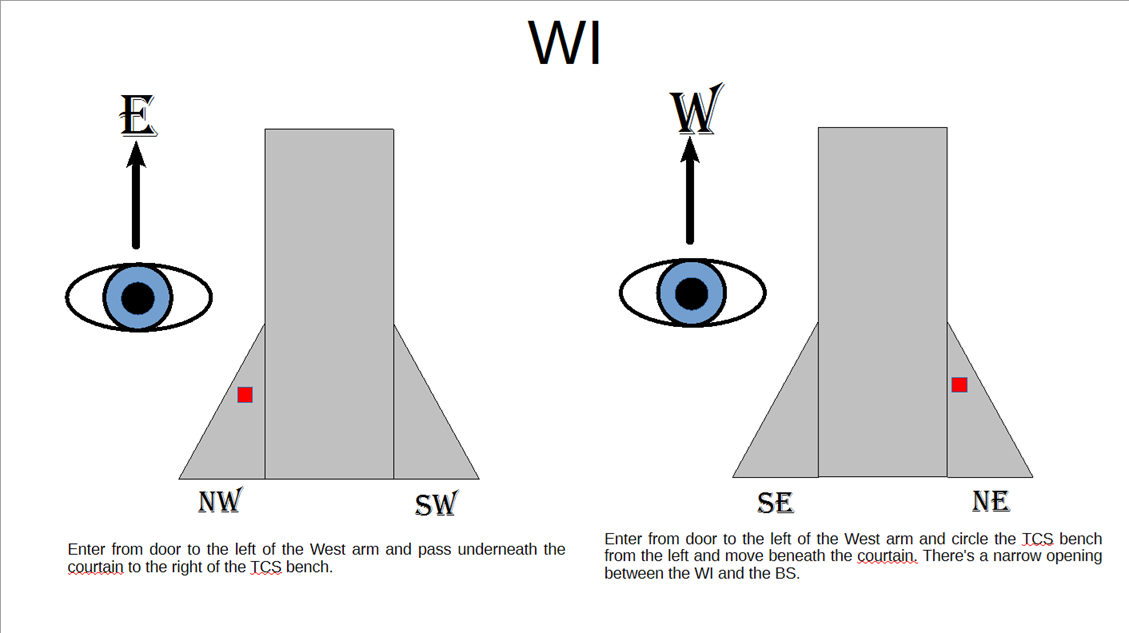
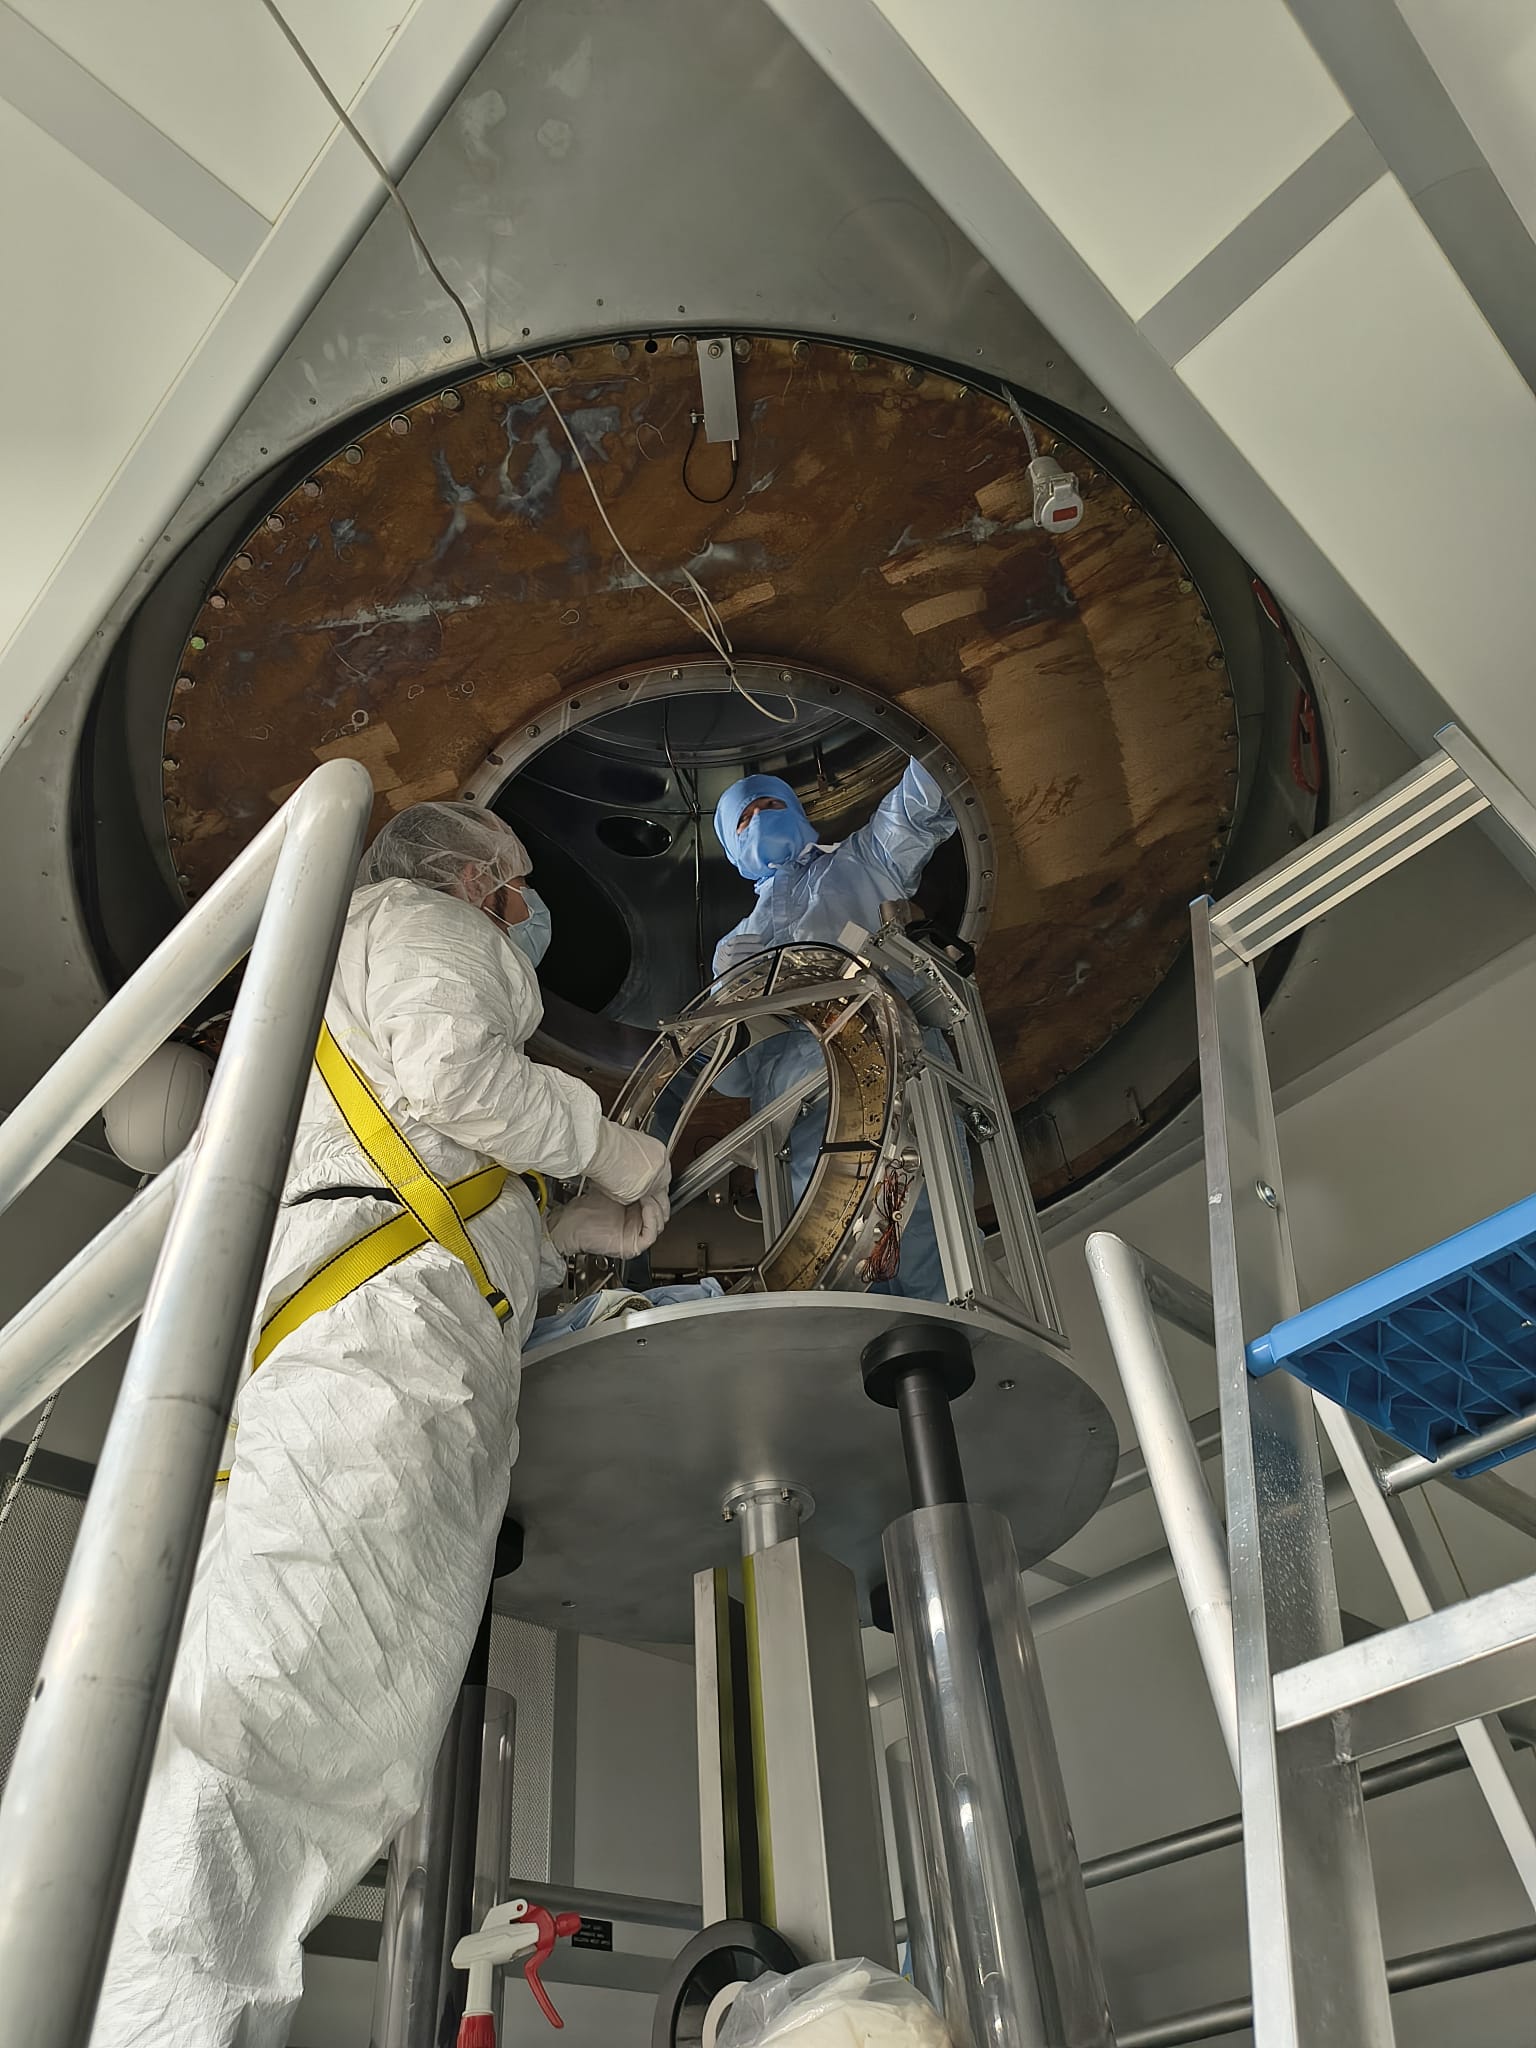
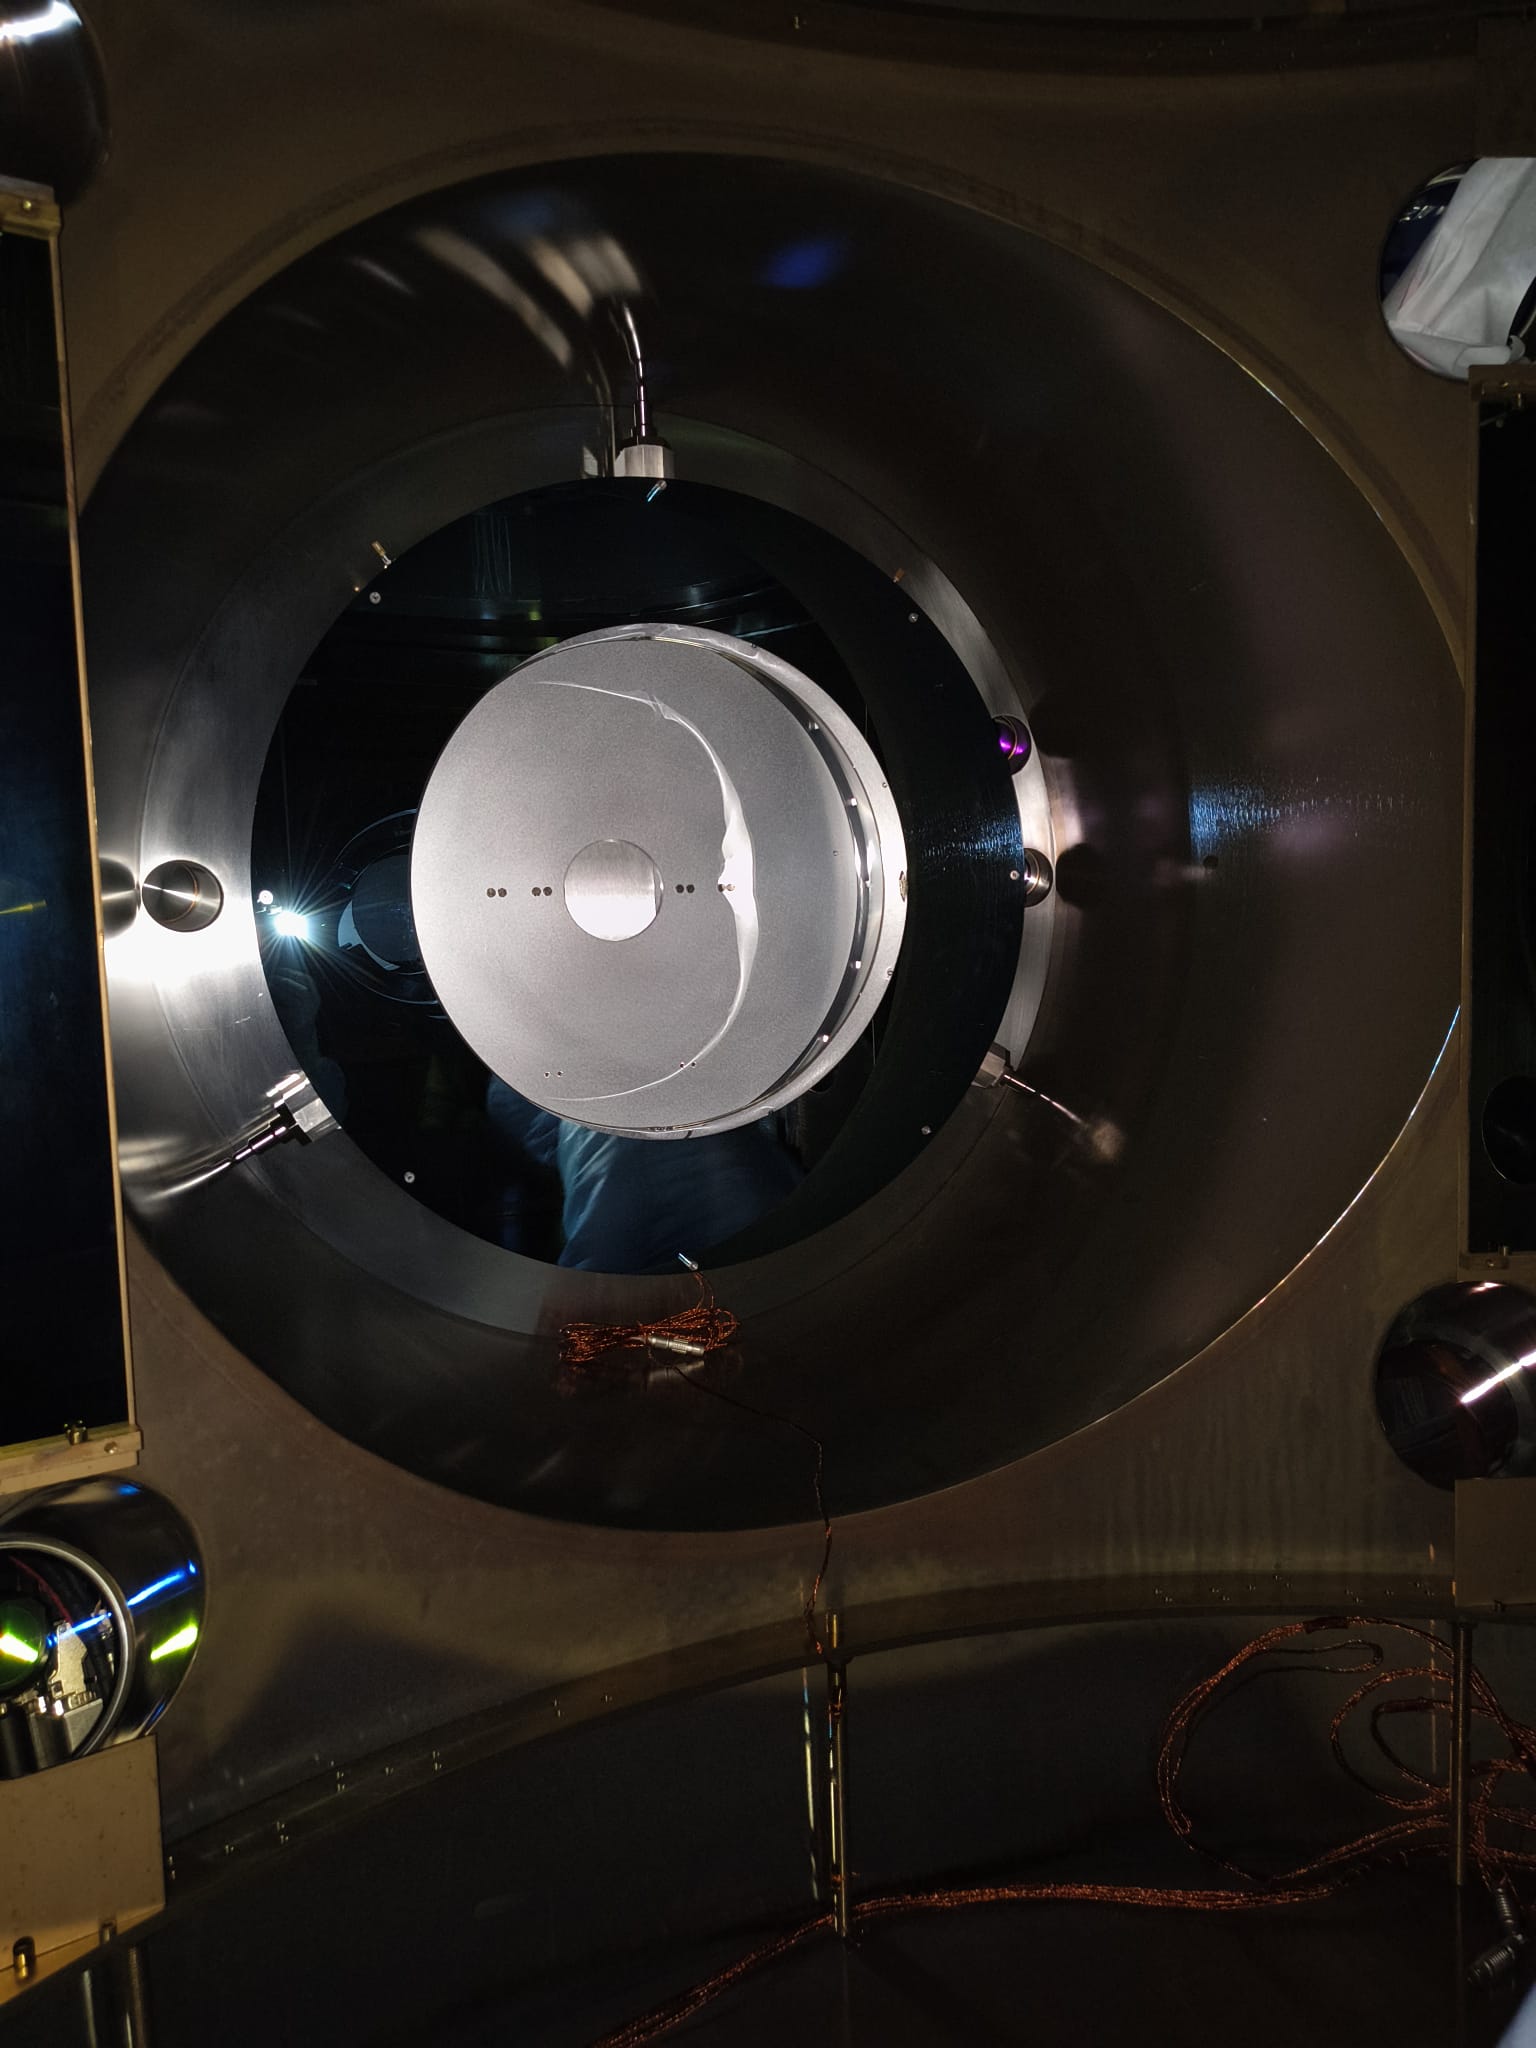
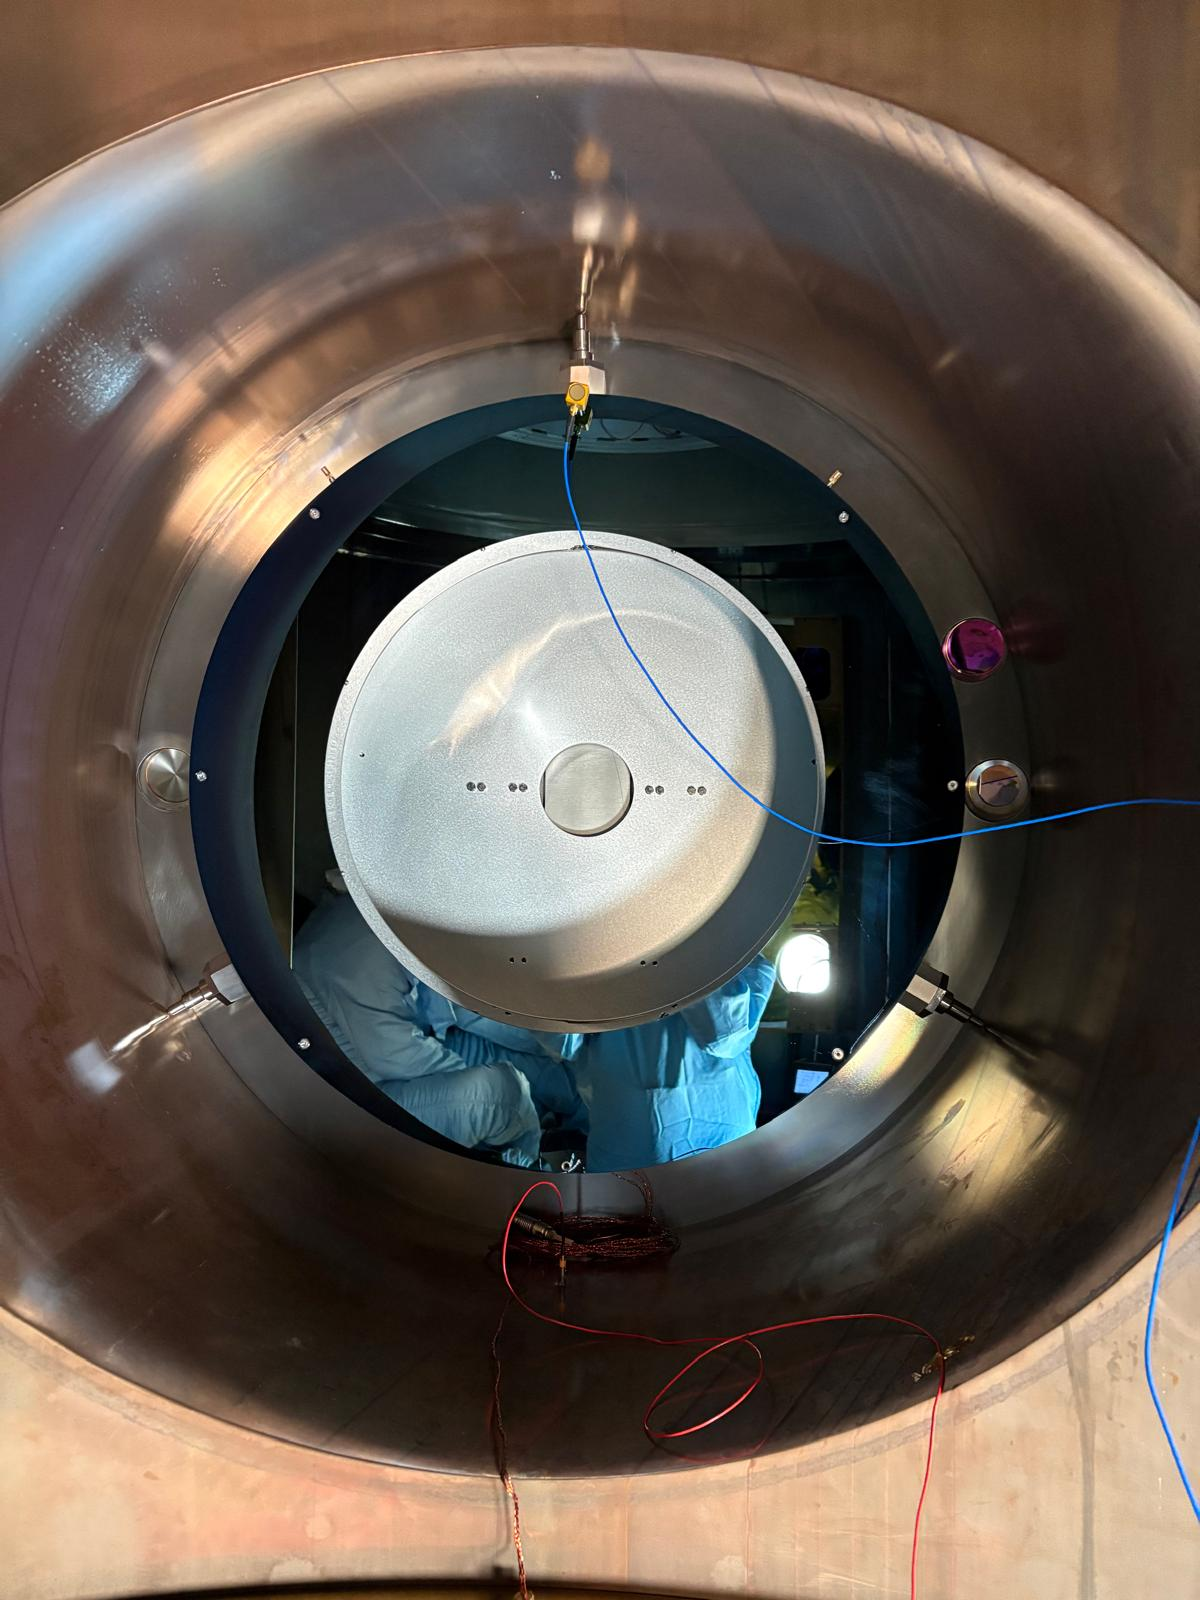
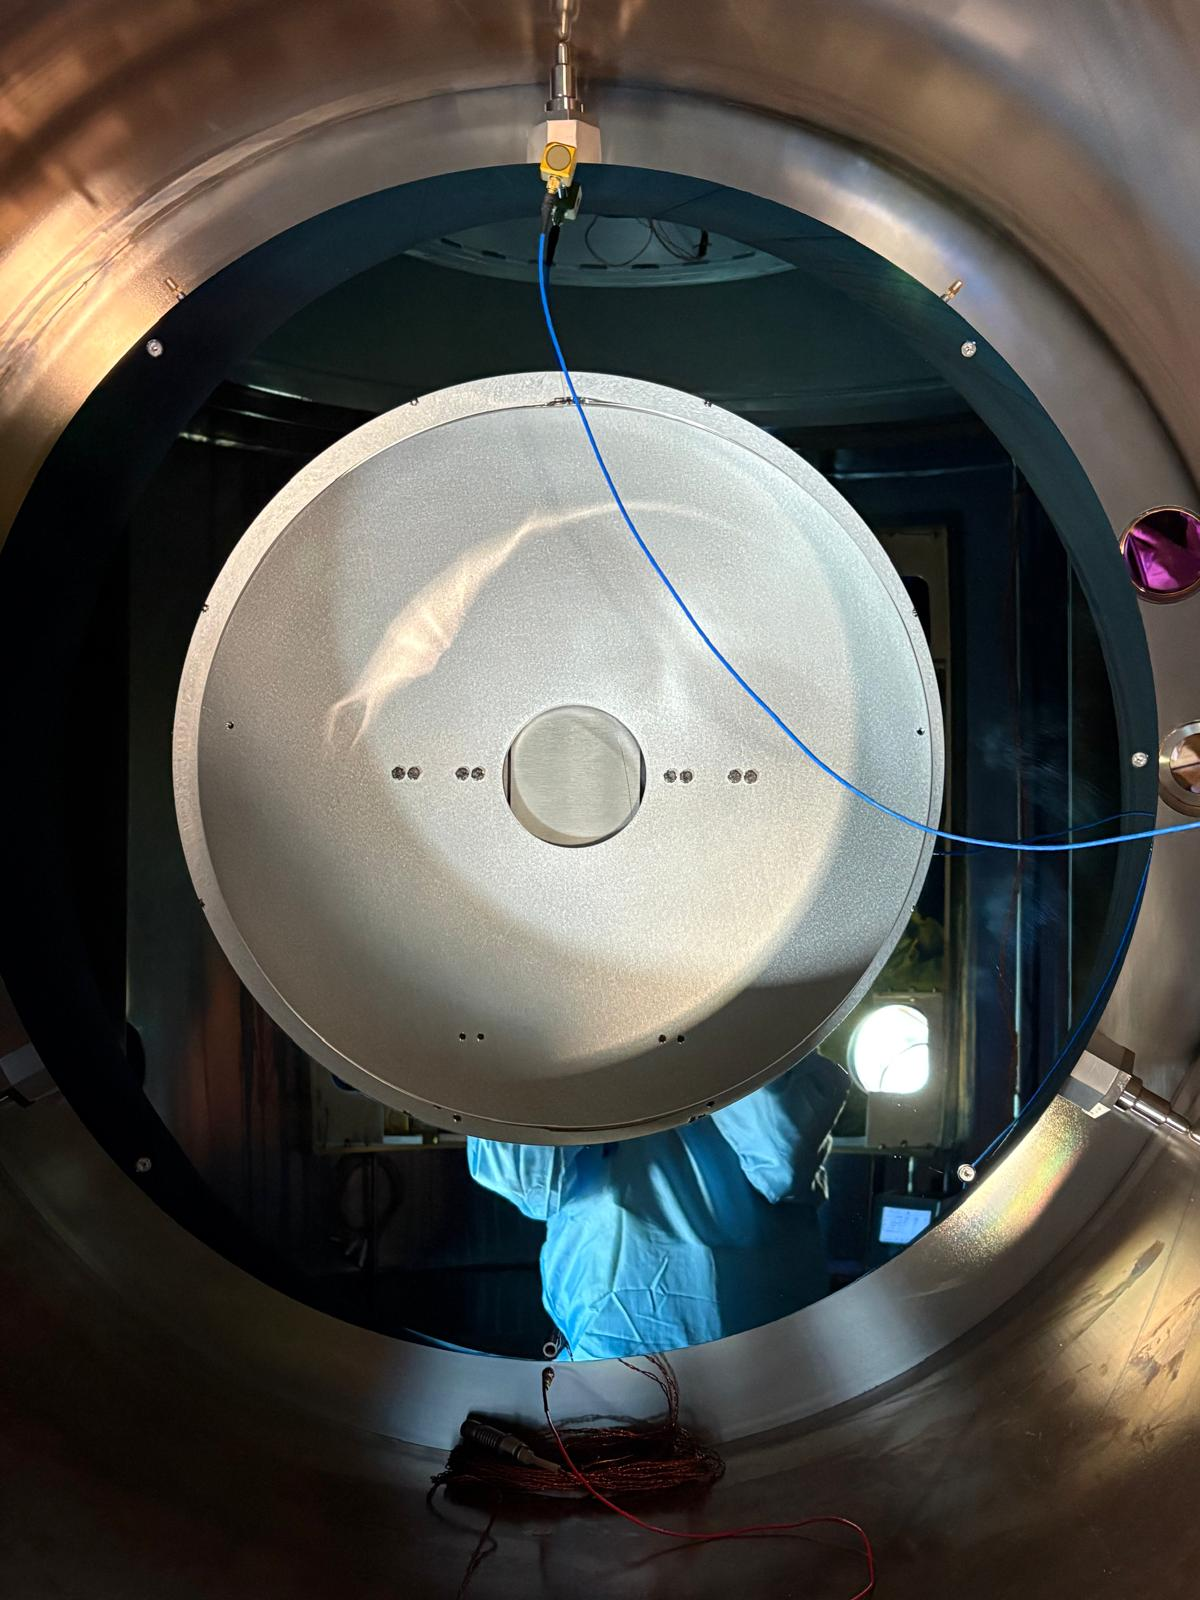
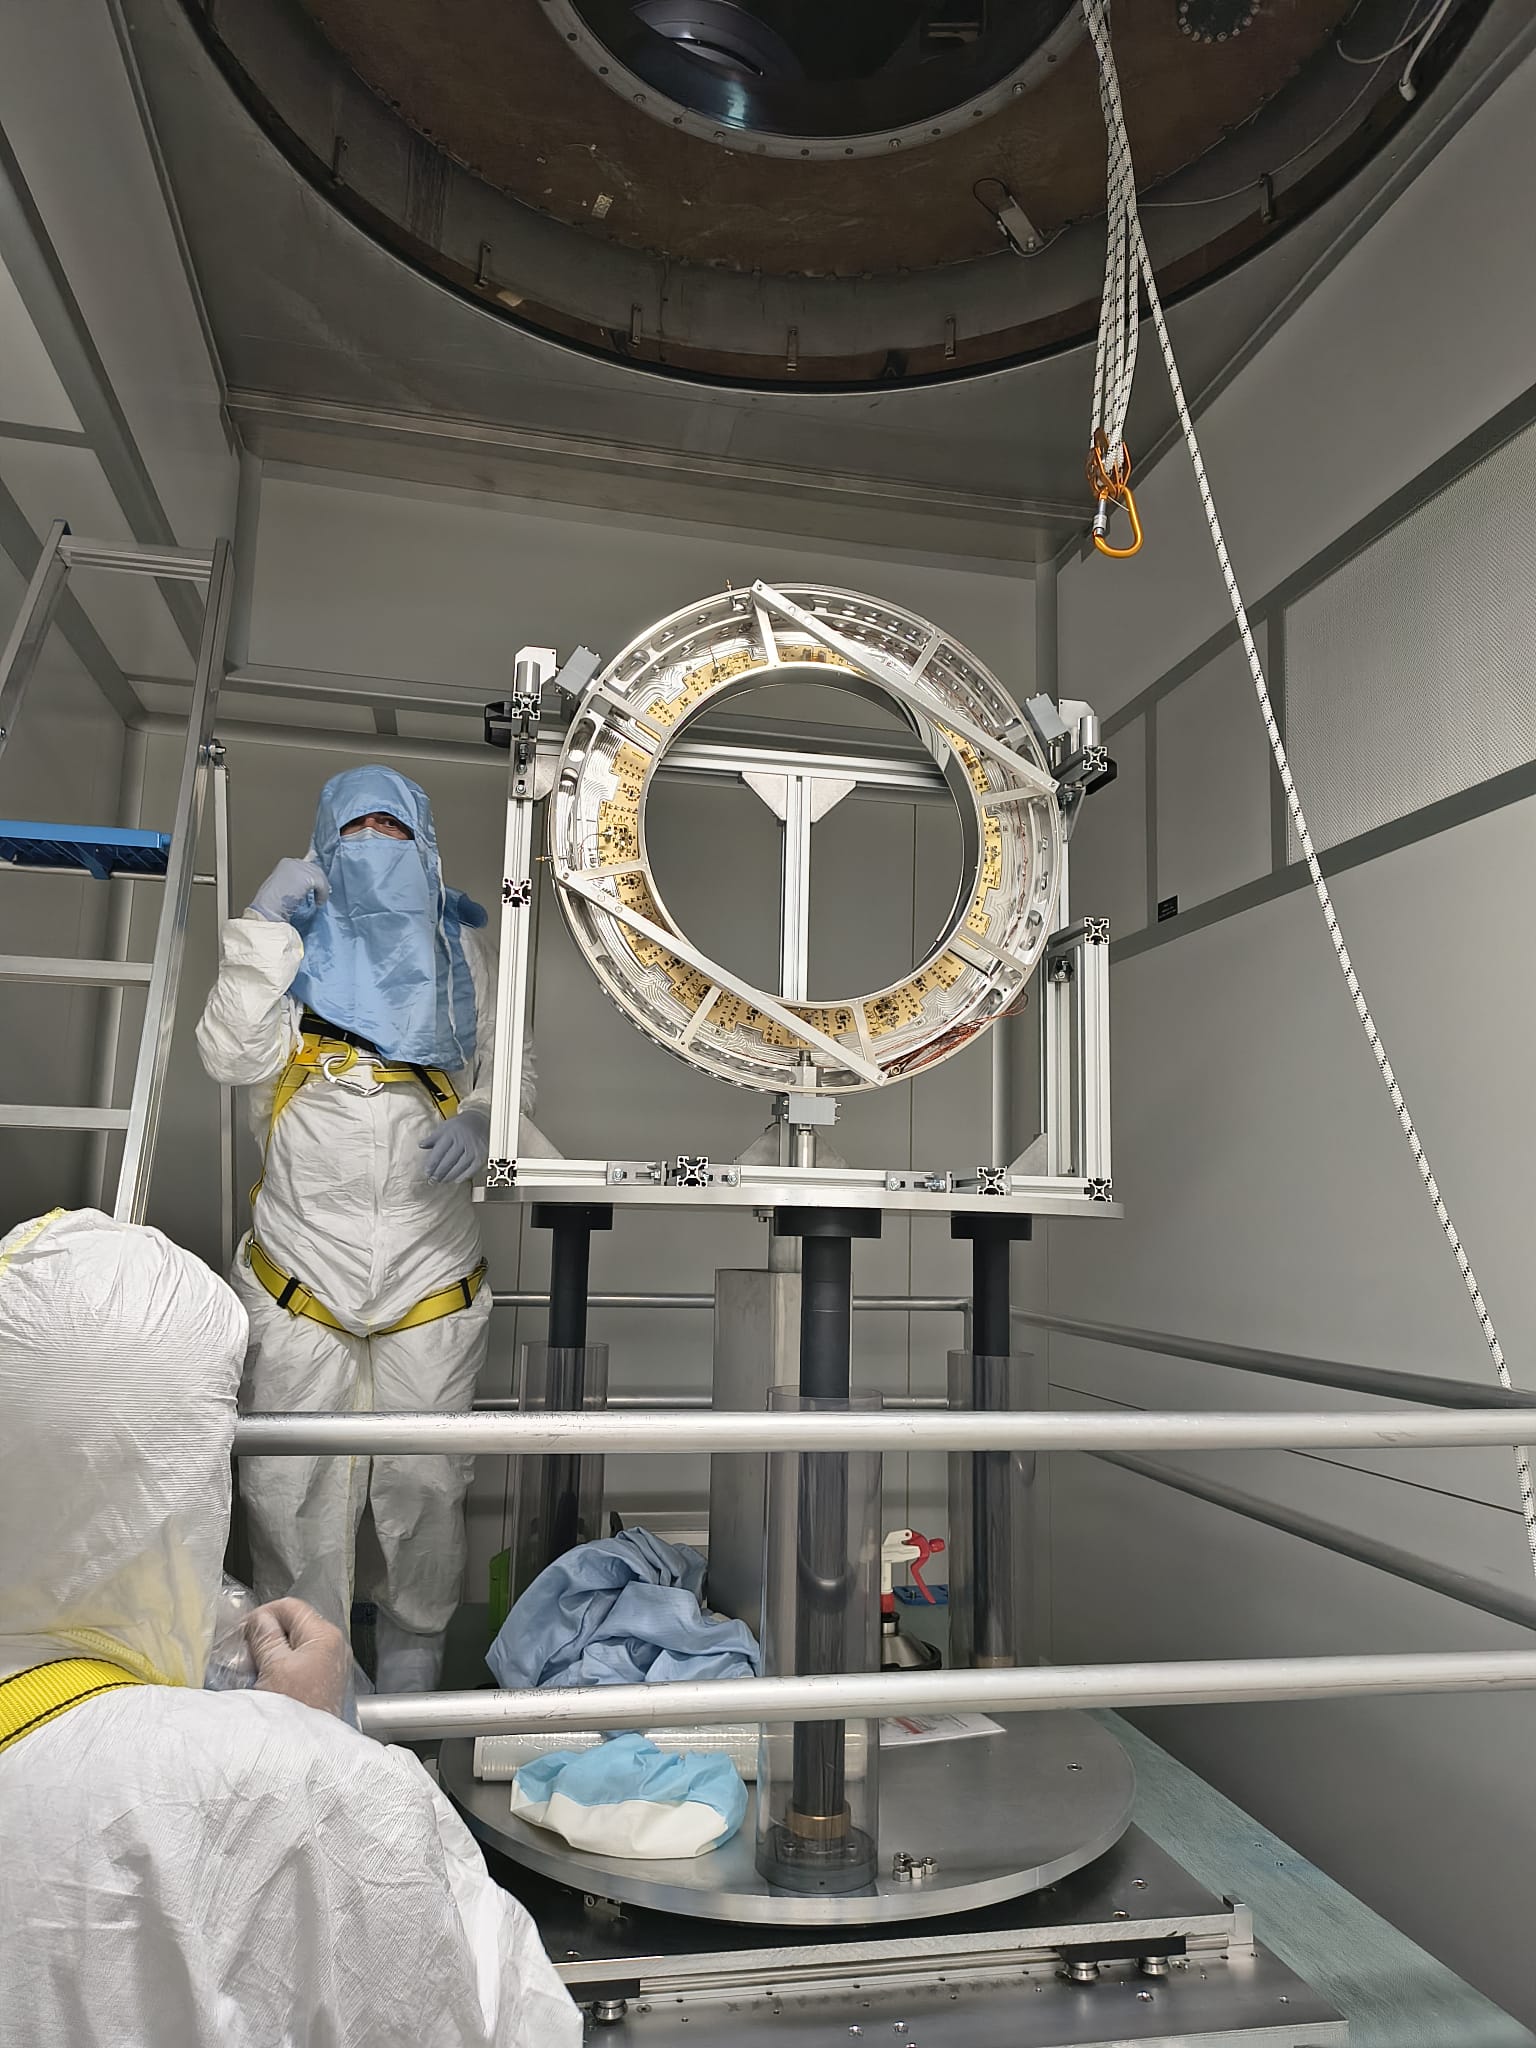
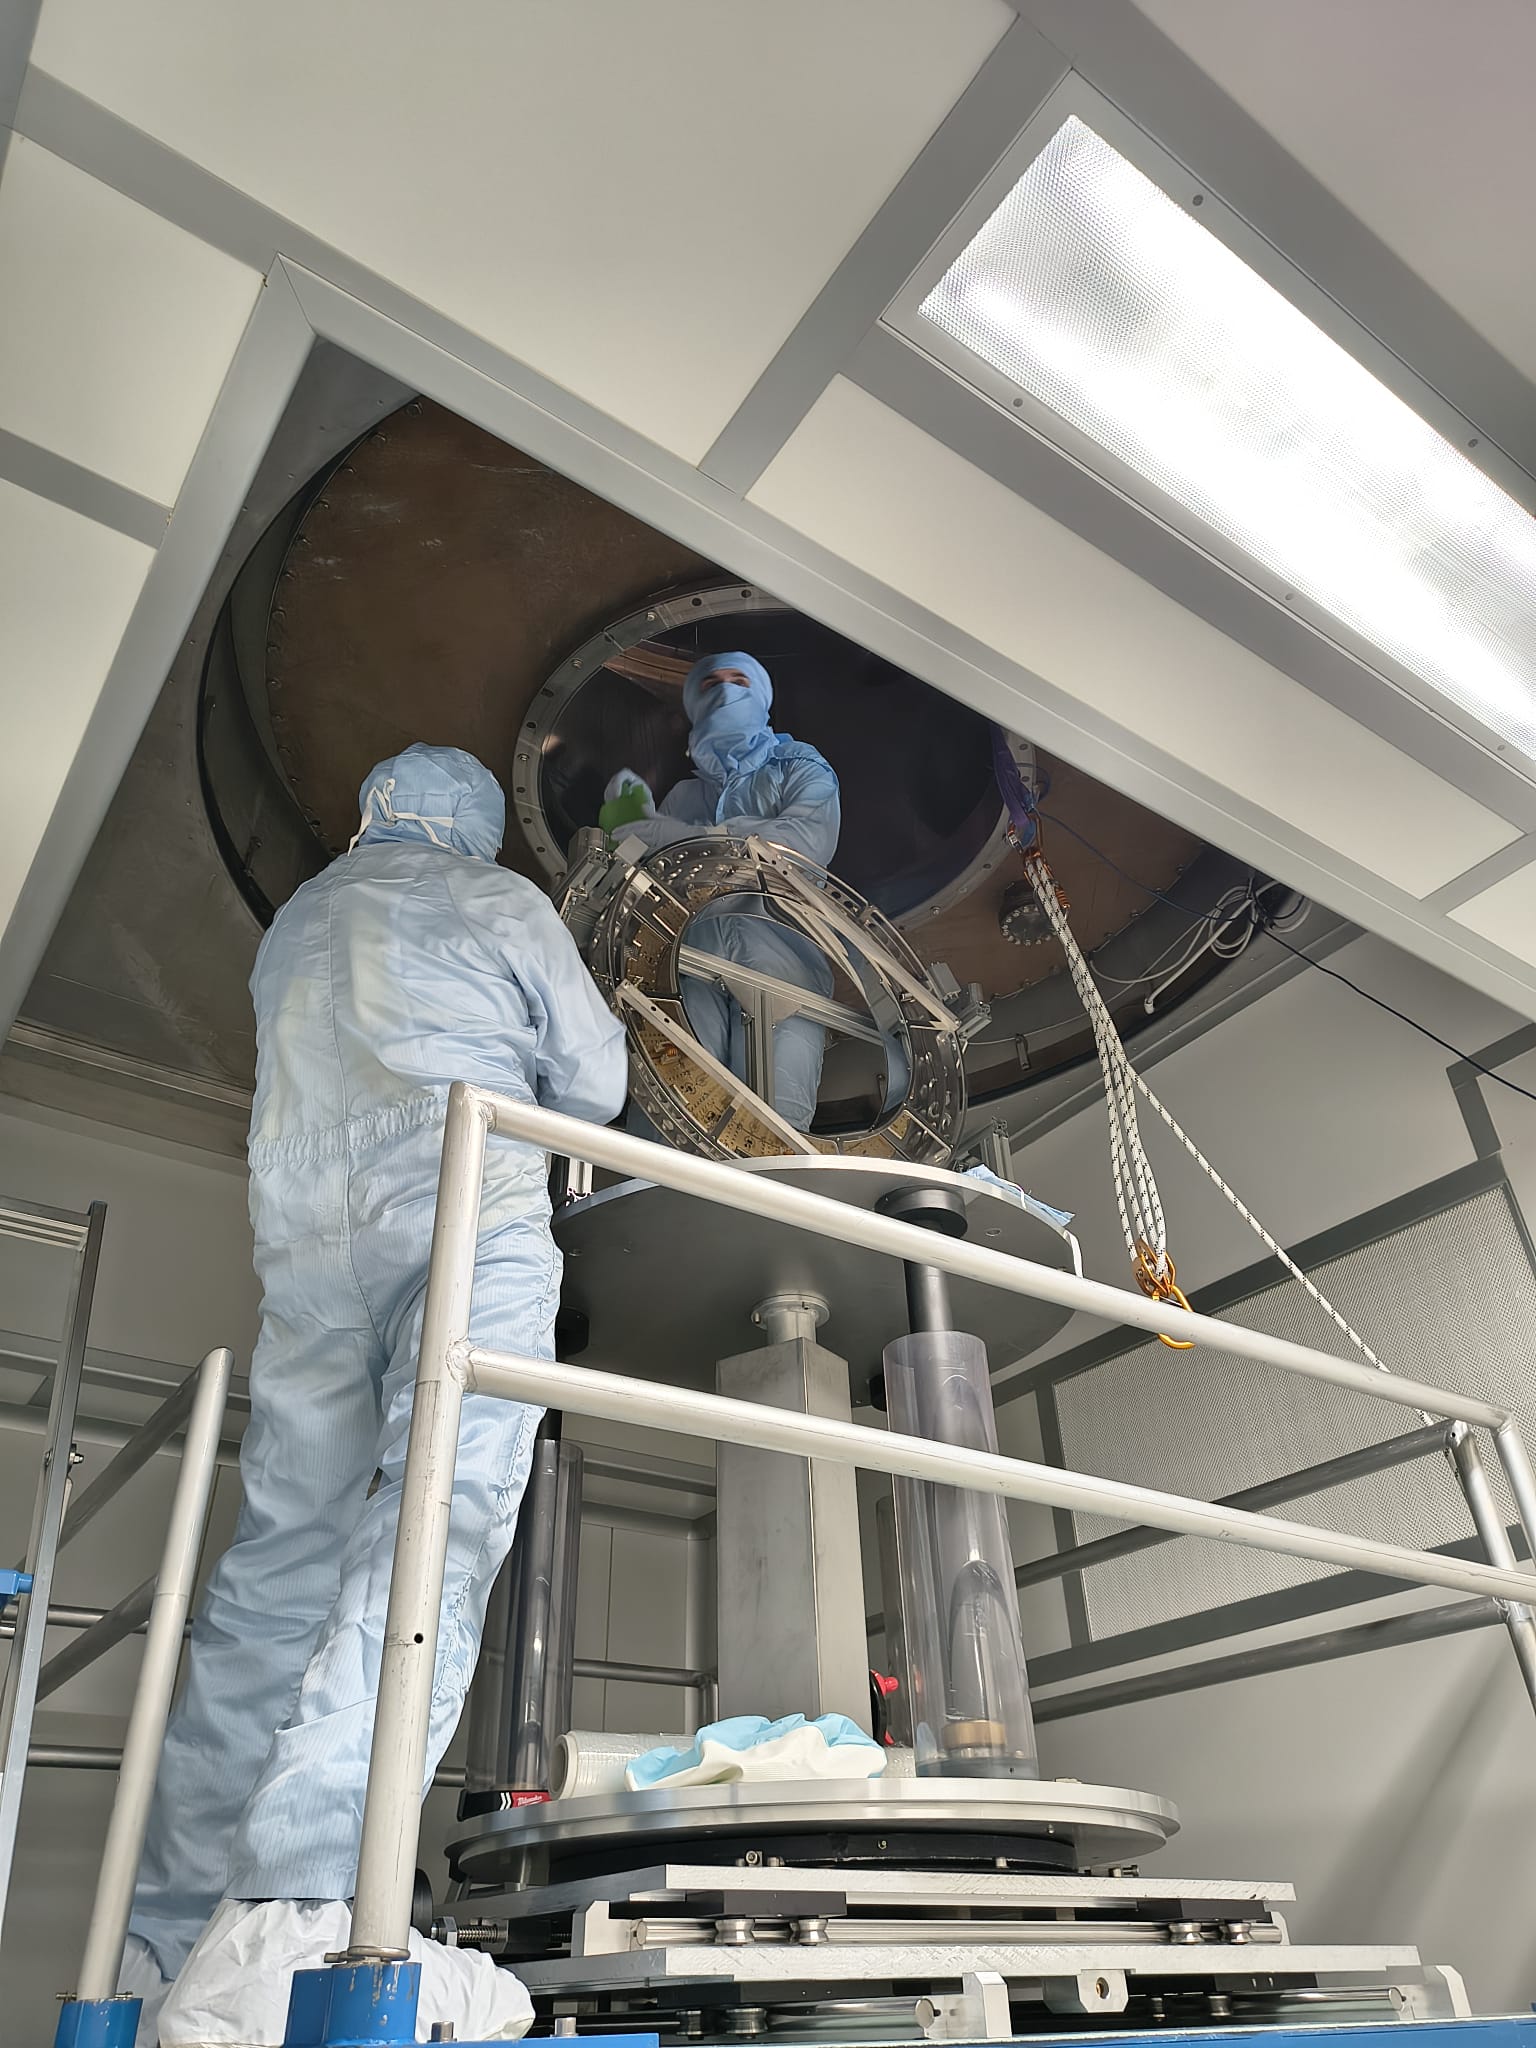
Today, mechanical transfer function measurements of the WI instrumented baffle were carried out following the same procedure adopted for the WI instrumented baffle. The measurement configurations are shown in Figure 1.
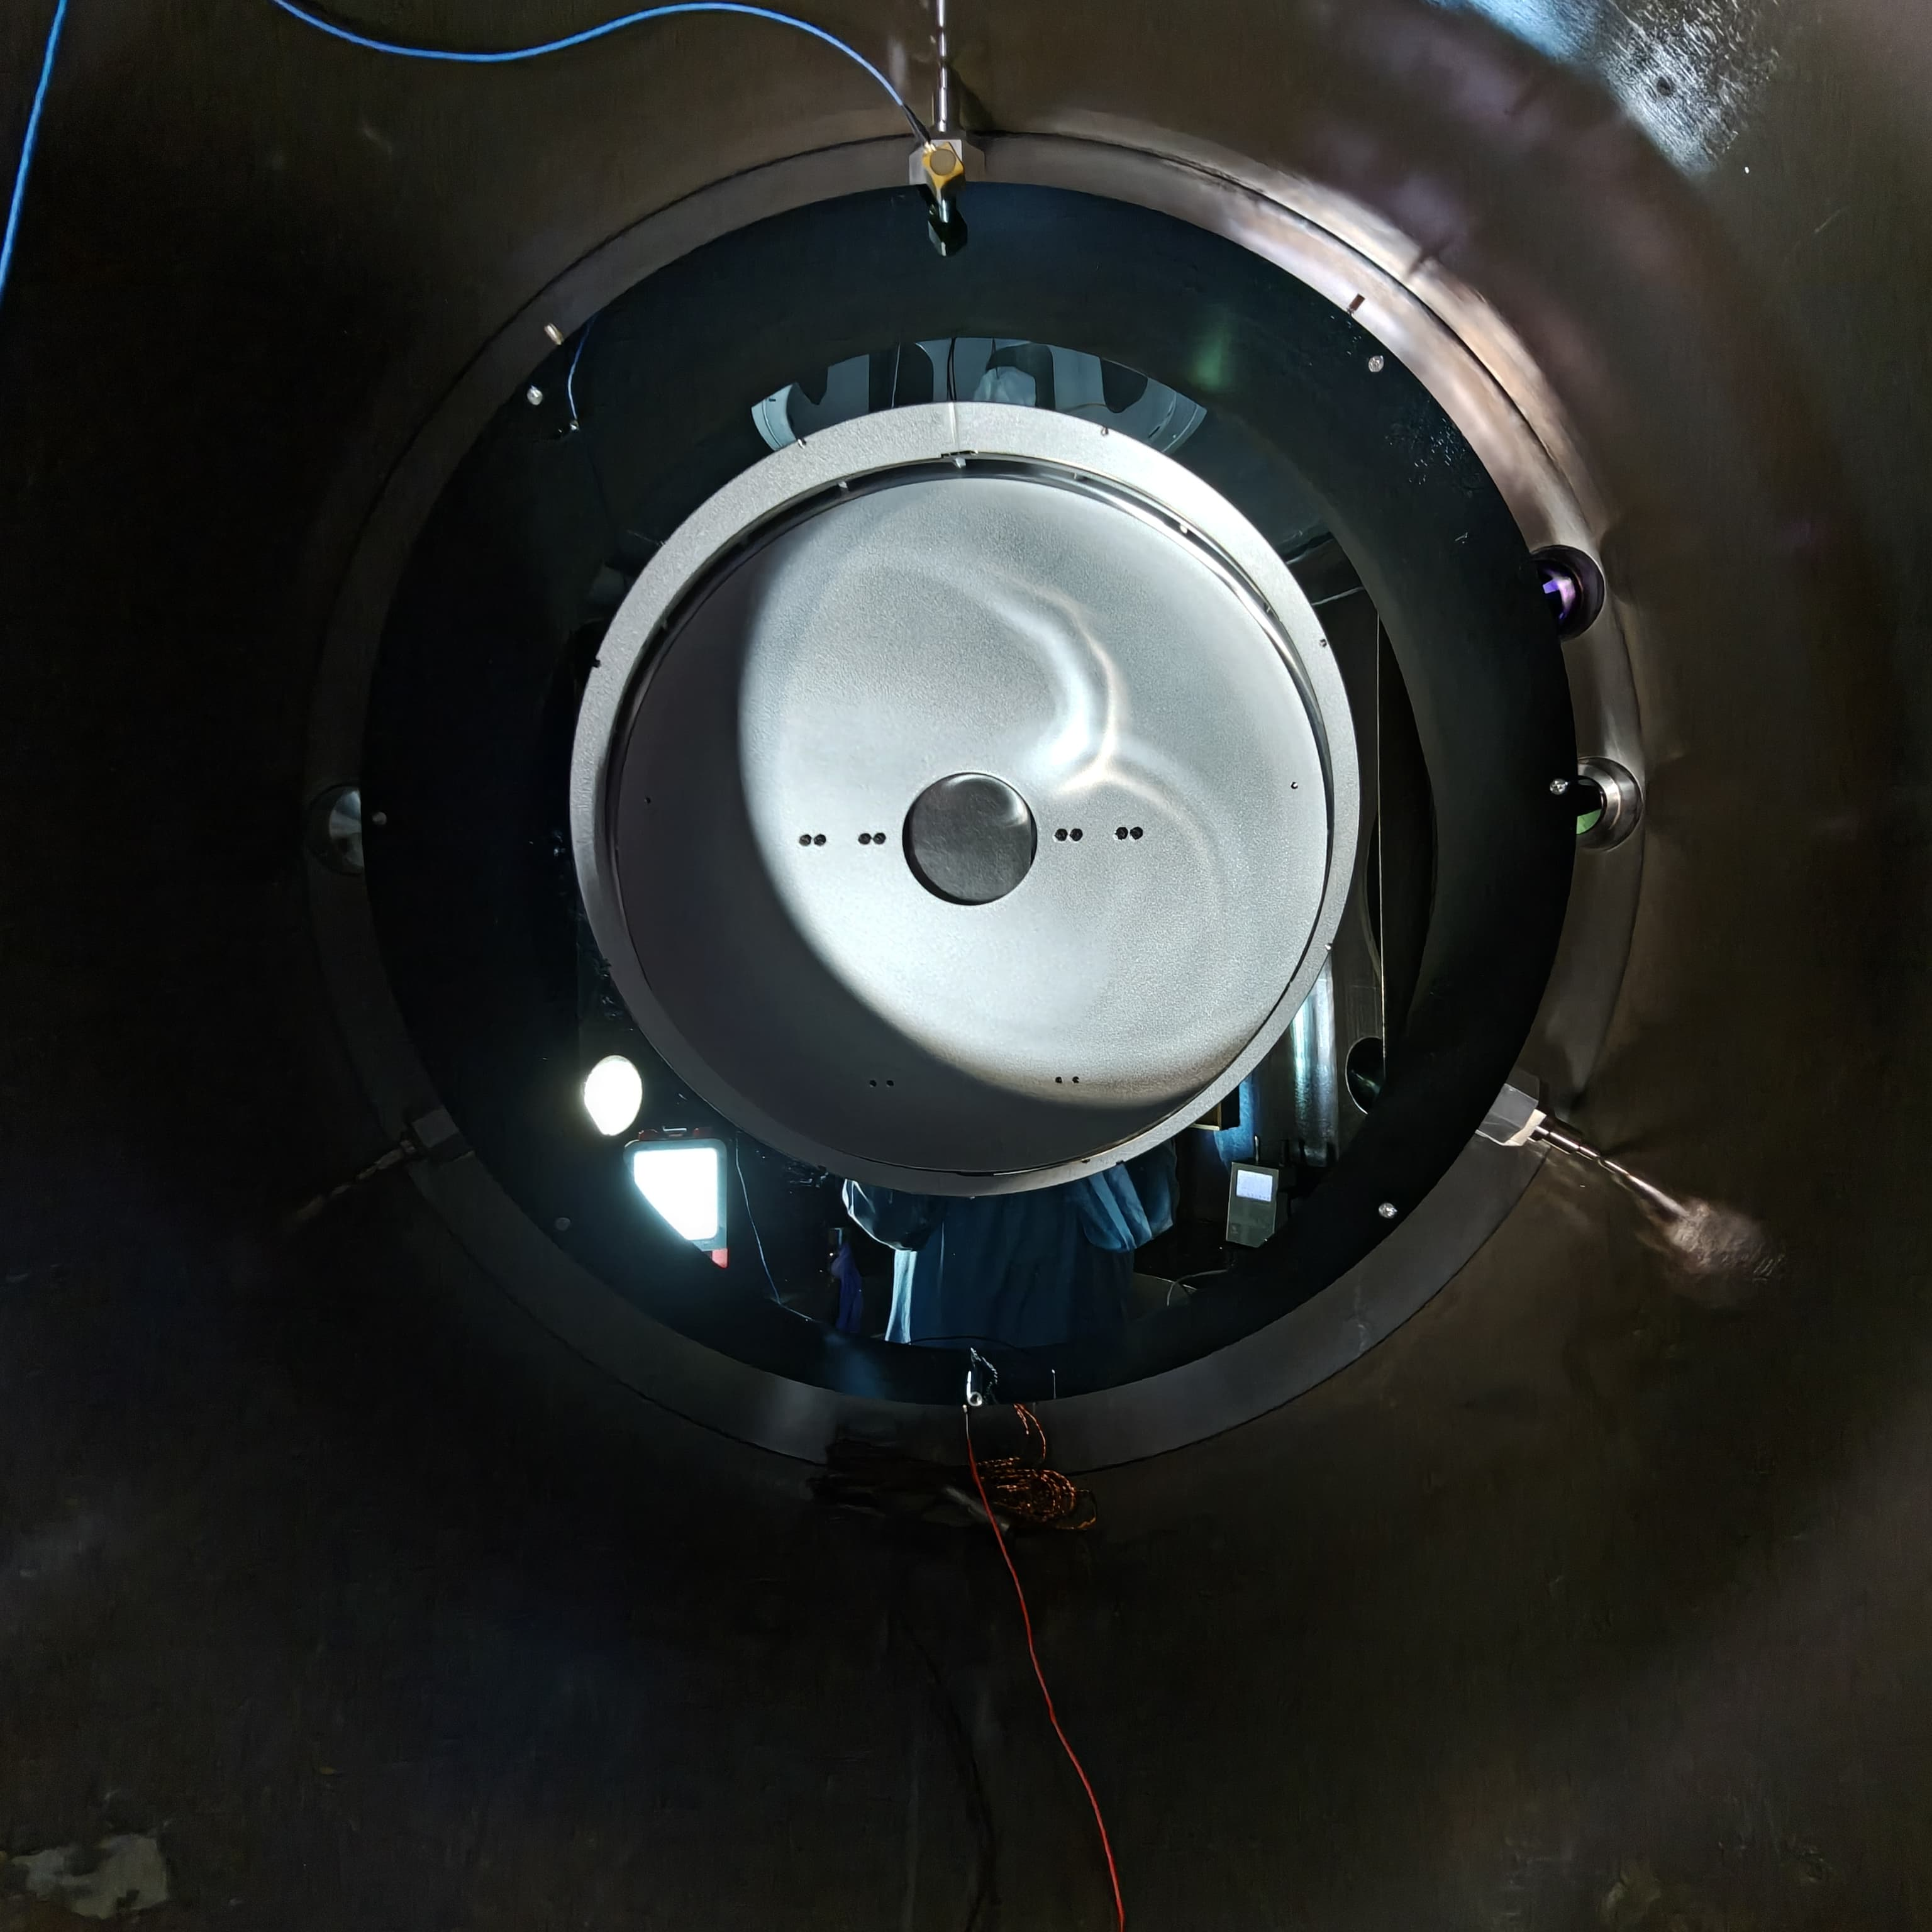
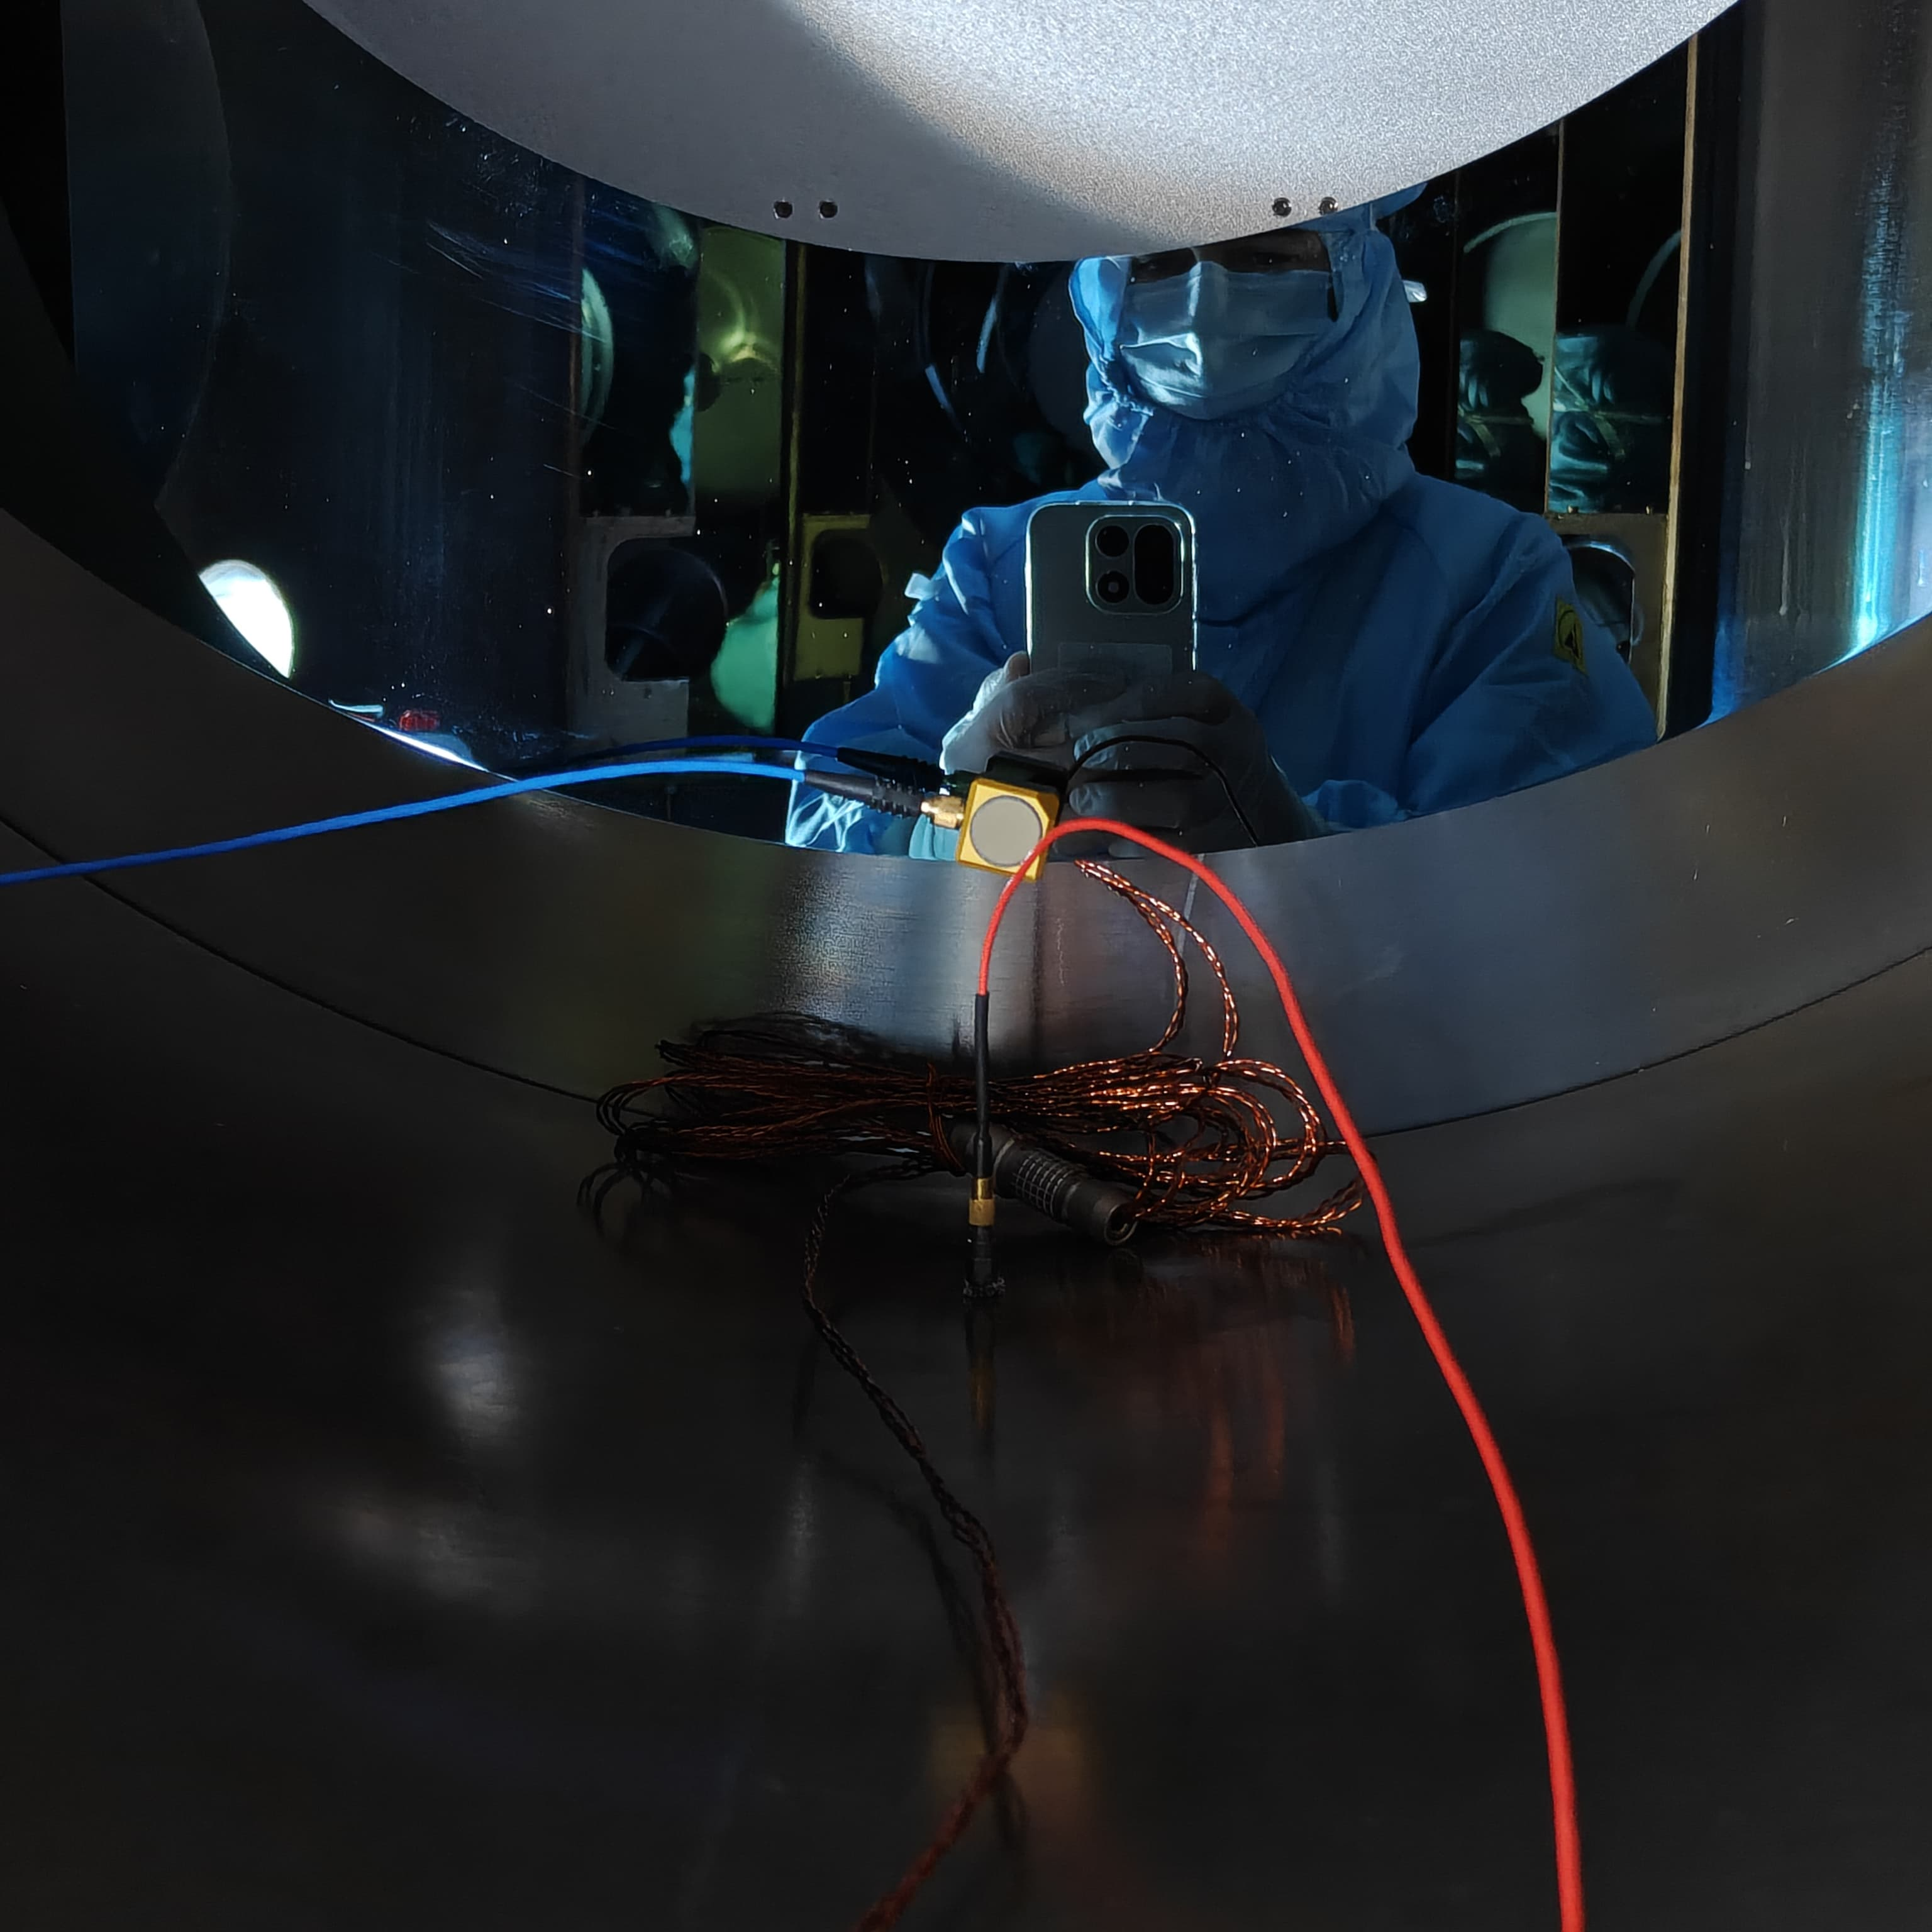
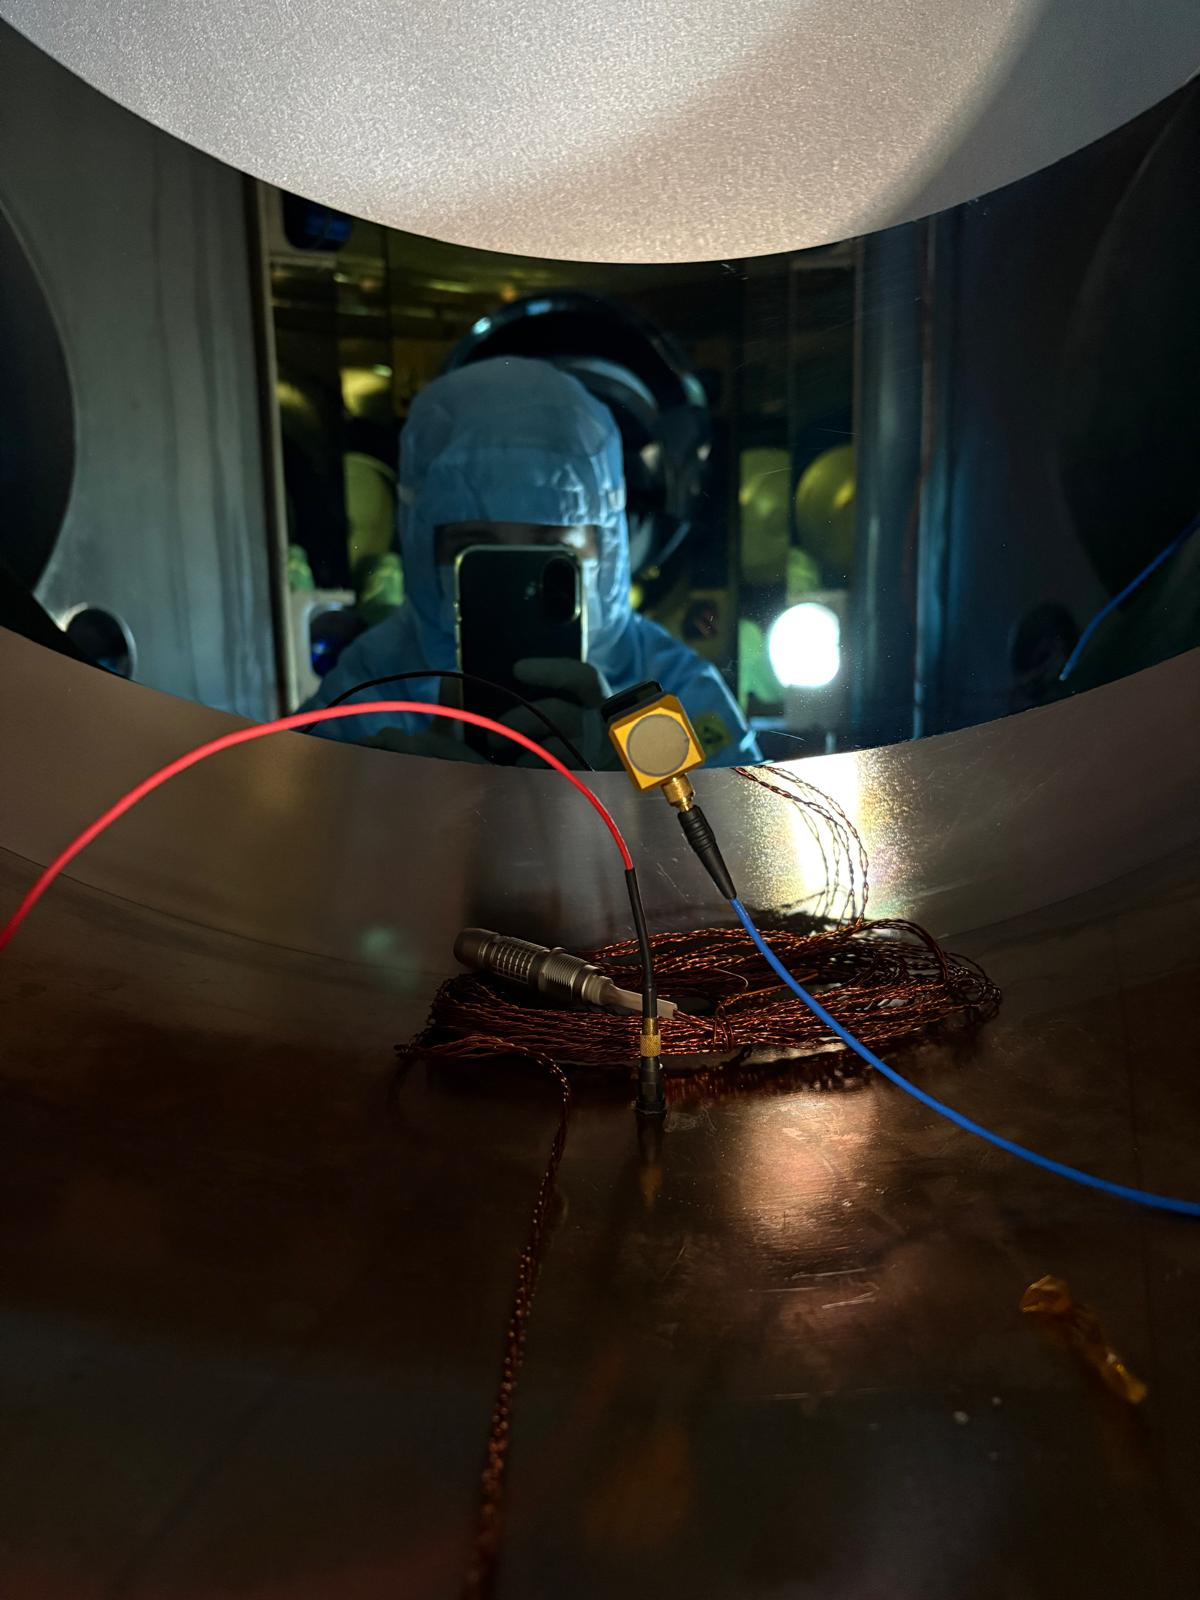
As in the NI measurement campaign, the triaxial accelerometer was mounted on the instrumented baffle through a custom adapter. The final orientation of the sensor exhibited a slight misalignment with respect to the nominal vertical and horizontal directions. The resulting sensor orientations for the WI measurements were:
- Top position: x-axis aligned with the cable direction, y-axis aligned with the adapter axis.
- Bottom position: x-axis aligned with the cable direction, z-axis approximately aligned with the adapter axis.
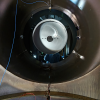
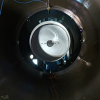
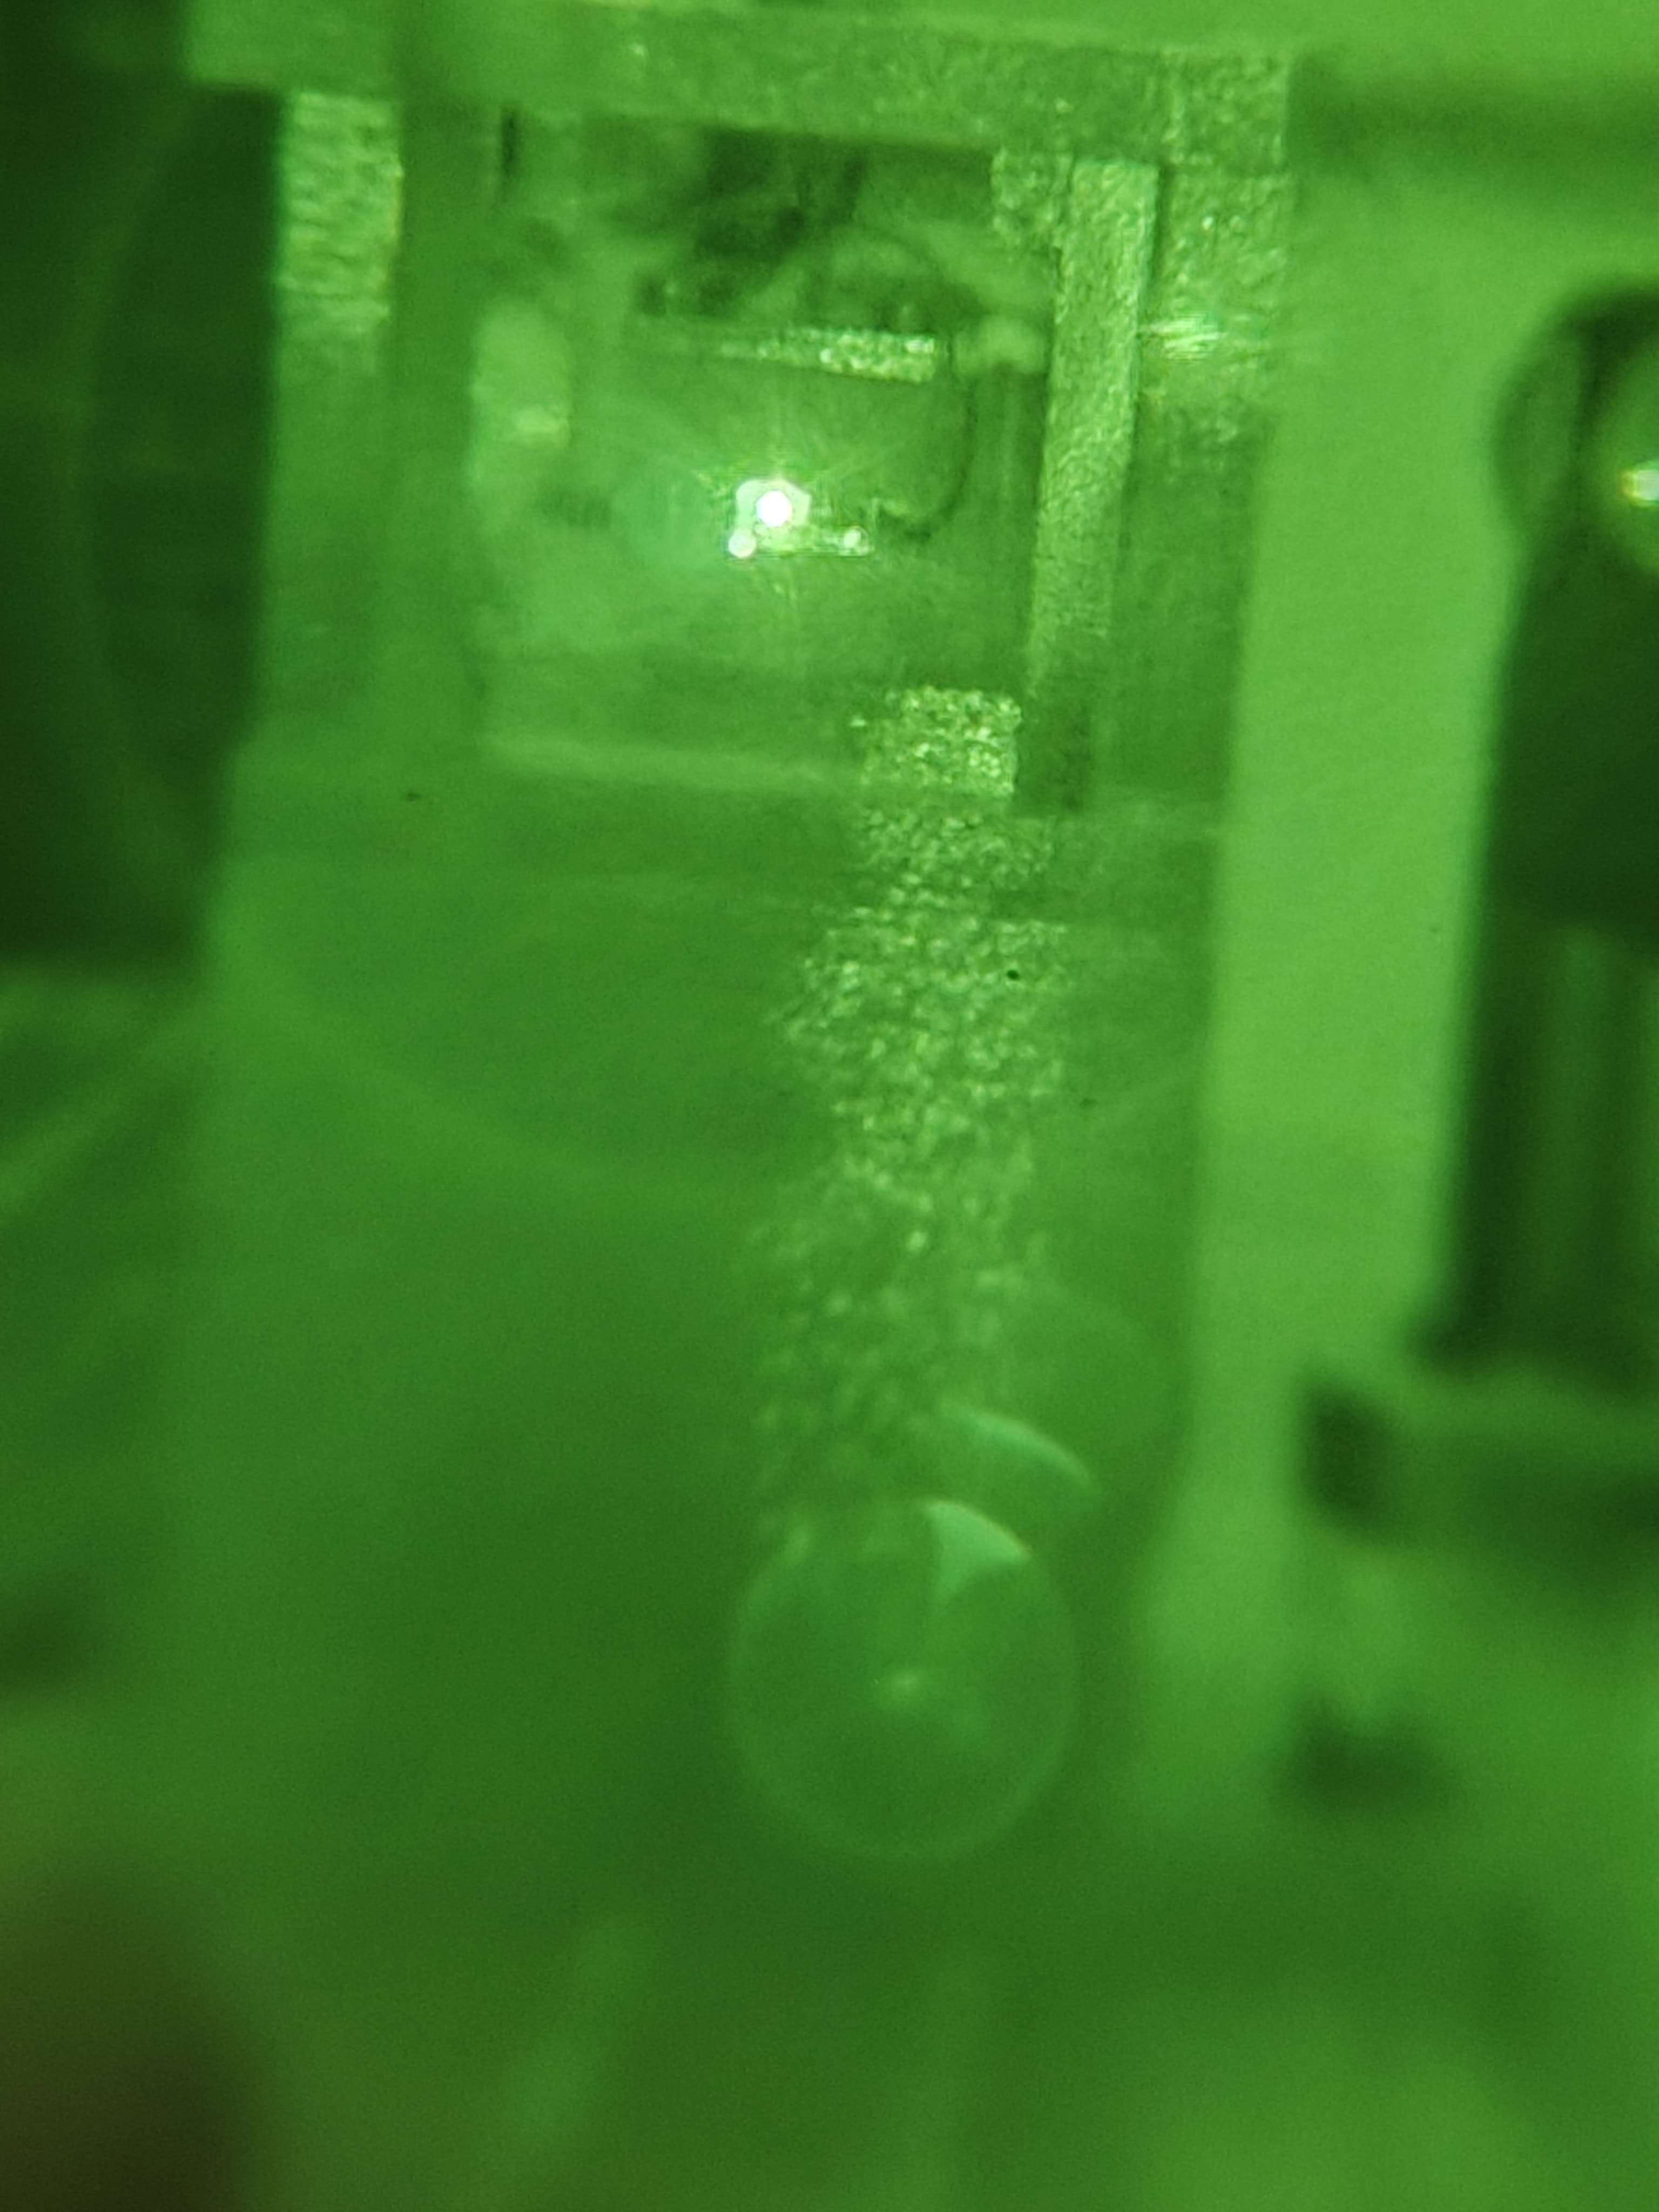
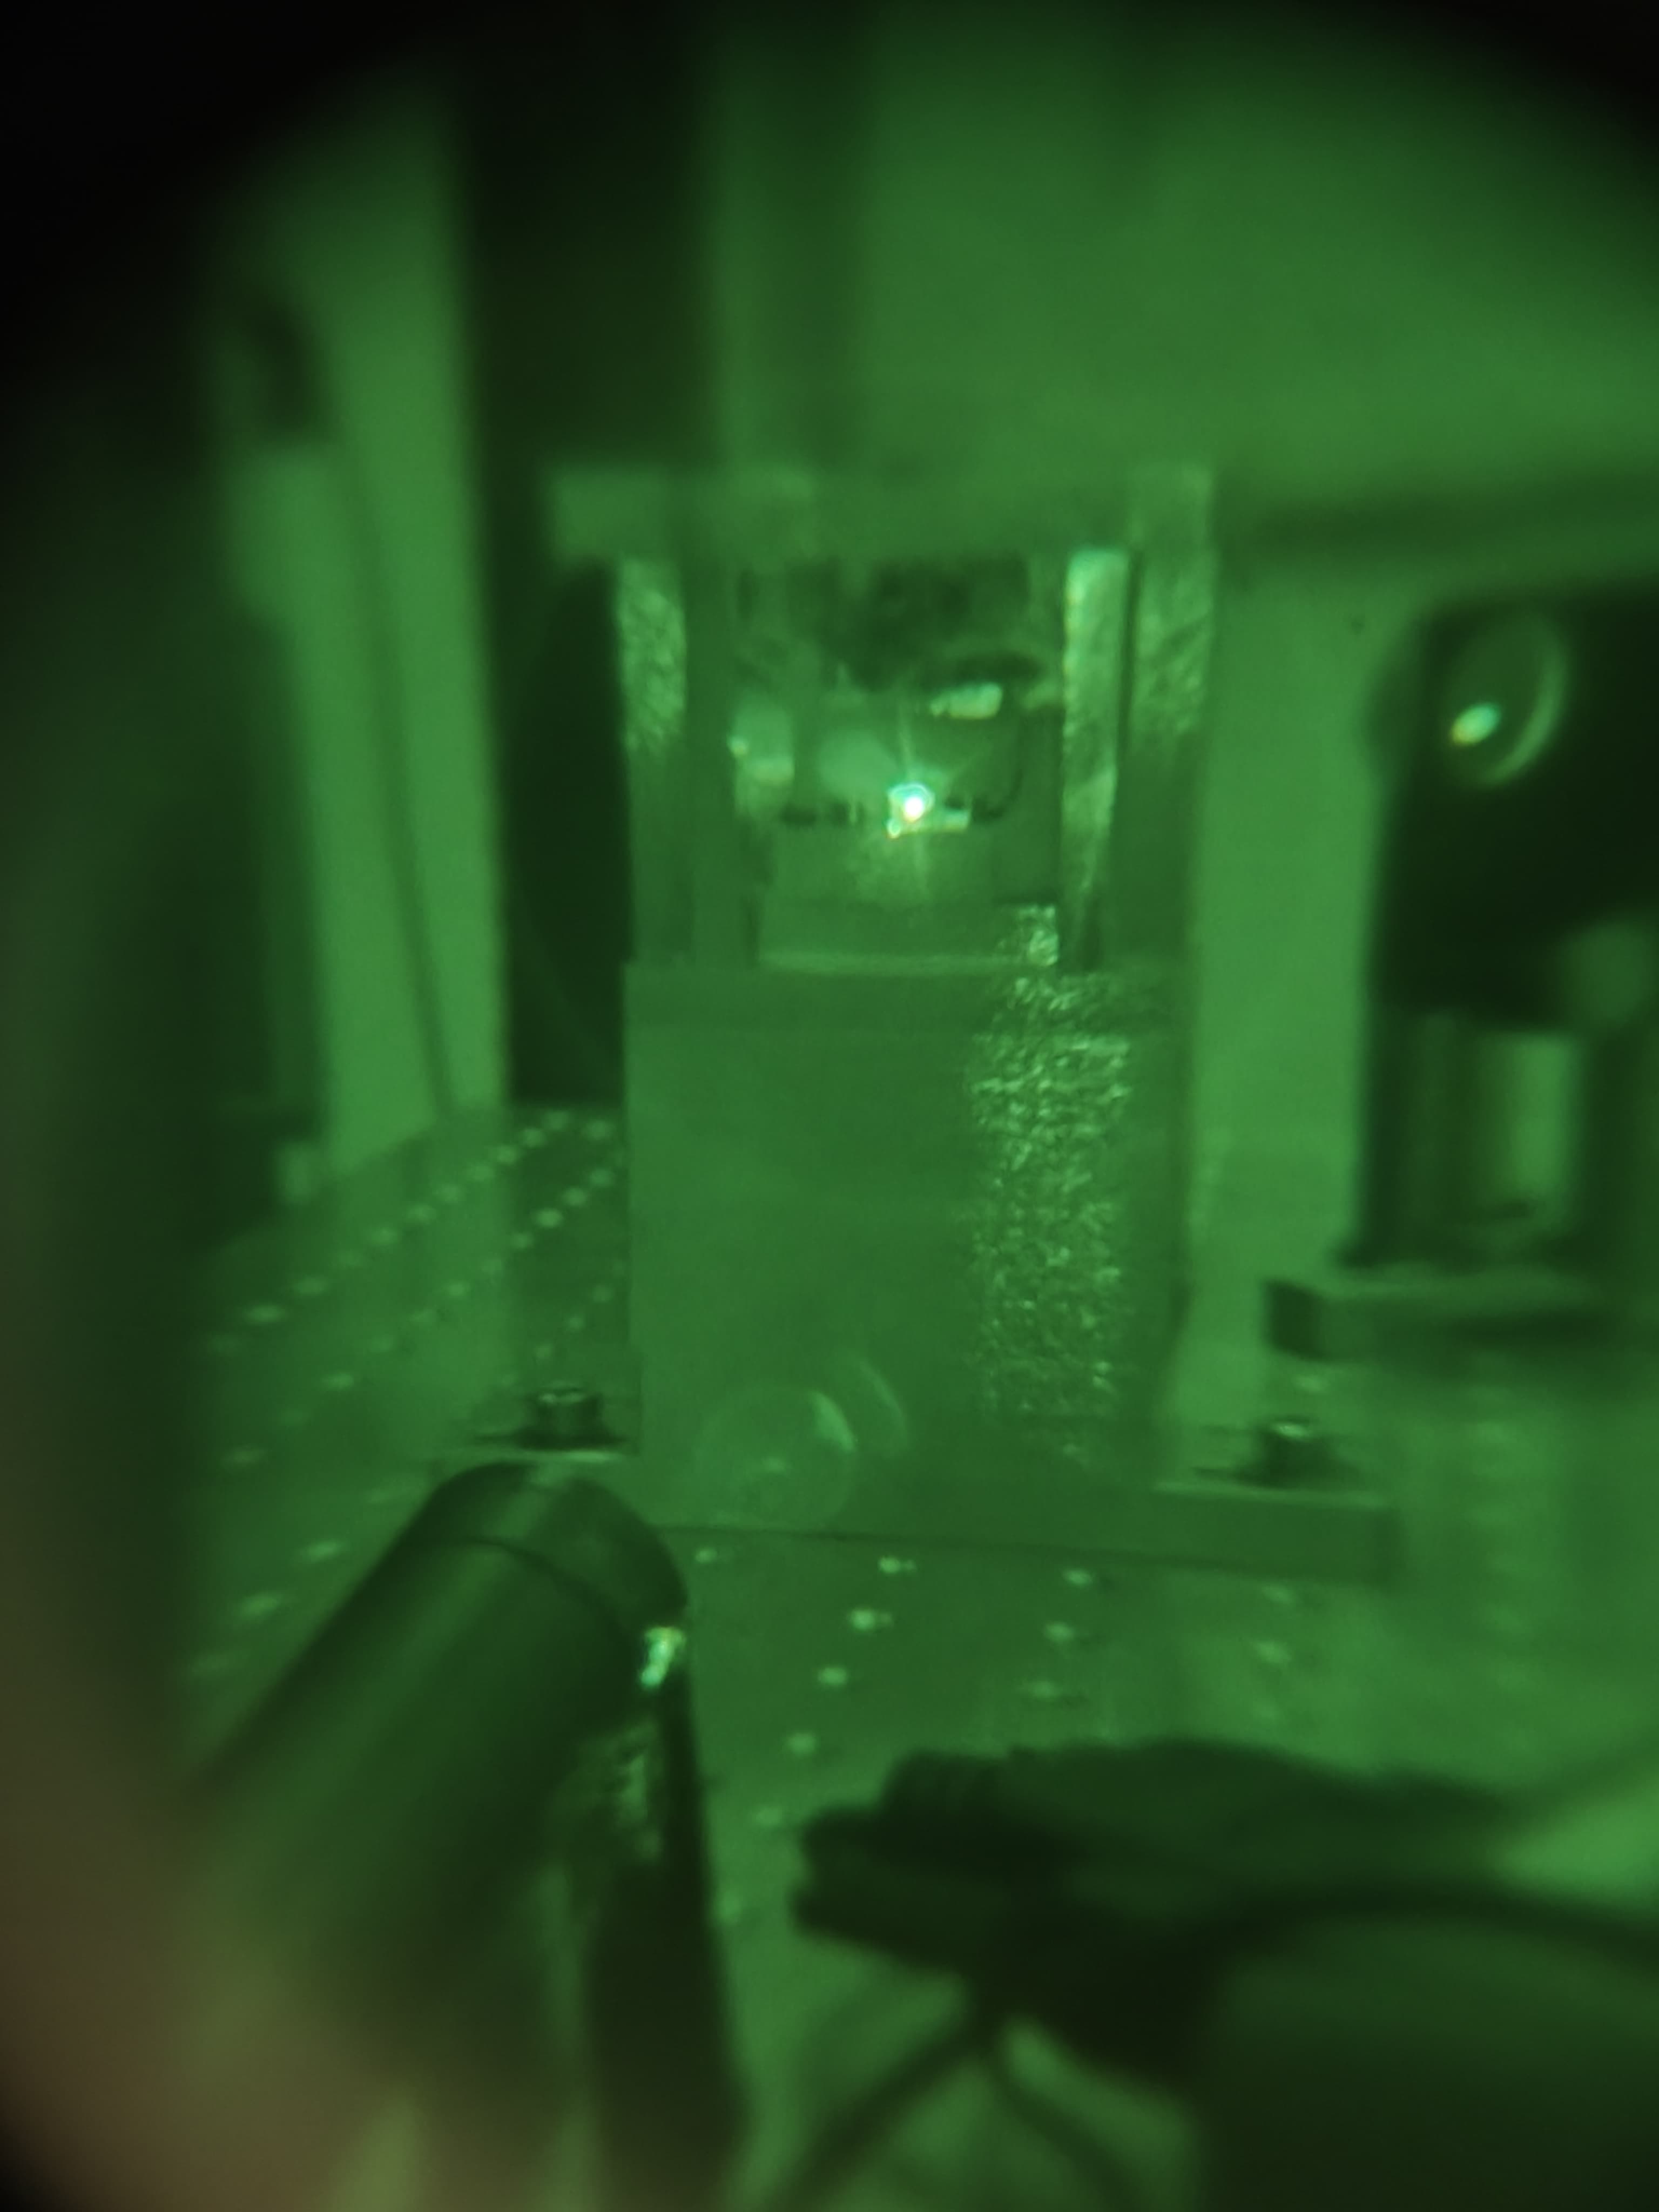
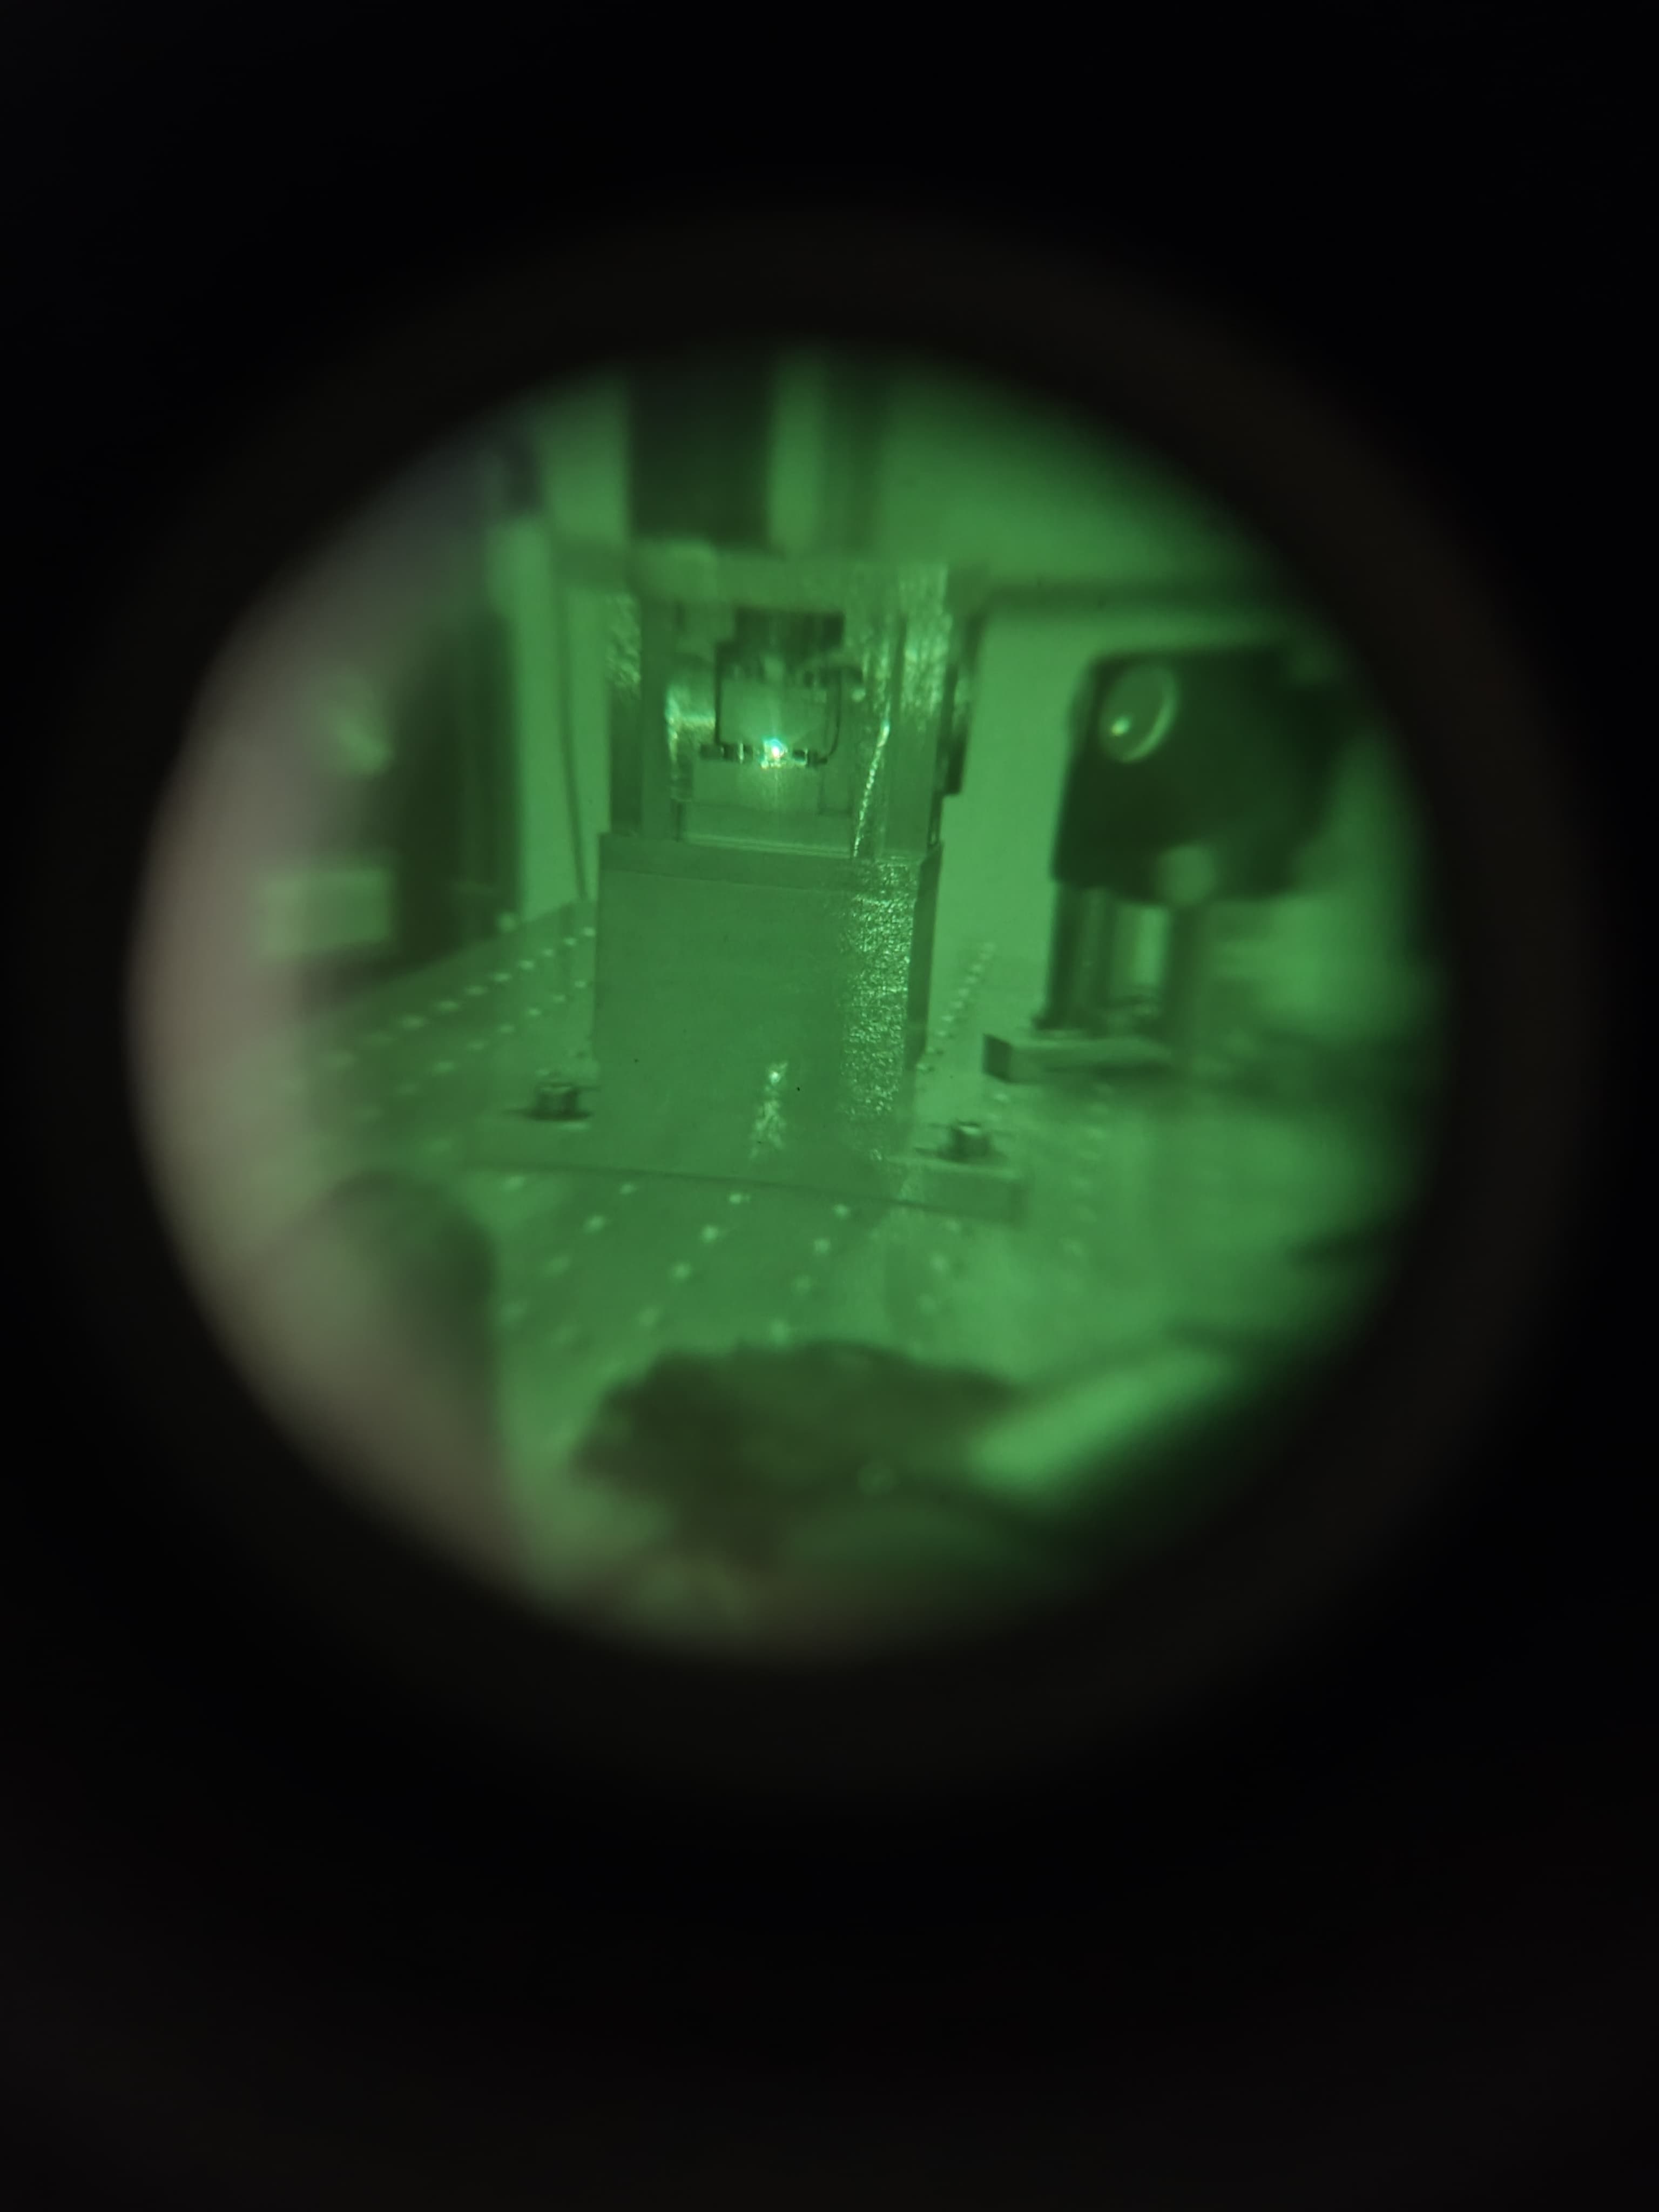
Figure 2,3,4: measurement configurations with the accelerometer mounted in the upper position of the instrumented baffle and the reference accelerometer positions.
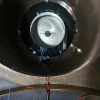
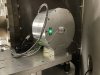
Figure 5,6,7: measurement configurations with the accelerometer mounted in the lower position of the instrumented baffle and the reference accelerometer positions.
The analysis of the acquired data will follow.
The list of the acquisitions, together with the corresponding file names, is attached.


ITF found in DOWN, UPGRADING
Activities and informations reported to the control room:
Mechanical Transfer Function Measurement of the WI Instrumented Baffle (IFAE group, Fiori, Spinicelli) with the assistance of Gargiulo, Gherardini and Menzione
Measurement of the EOM power losses (#69252 De Rossi, Gosselin, Lagabbe, Spinicelli)
North arm still closed to vehicles as opposed to what previously communicated
After that, we ran some DAQ tests and switched everything off.
We will continue the commissioning remotely.
Nobody from IFAE in the CB.
Thank you very much for all the help during the installation.
We put a beam dumper after the M8 mirror on EIB to prevent the laser from going to the towers.
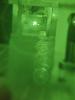
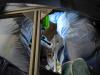
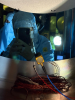
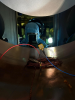
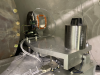
We suspected that the 3rd EOM has some power losses. To see whether or not this EOM transmits the power correctly, the EOM was removed from EIB and its transmission was measured with a 1 W laser. The measured losses were about 1%, but the observed power oscillations are about 1% too, so it is not clear whether or not there are losses due to the EOM. It has also been found that the EOM scatters some light as seen in the photos.
To measure the losses of the EOMs, the laser power was measured before the EOMs, after the second EOM and after the third one. All power measurements were done with Ophir calorimeter with an average over 10 s. The beam is always align using the BPL. The photodiode PMC_TRA was monitored for reference.
- When measuring the power before the EOMs, 2 mirrors HR Thorlabs NB1K14 (R>99.9 pol s @1064) and divergent lens were added between the optical path and the calorimeter. Measured power: 32.1 W, on 17 June 16:04 UTC, (PMC_TRA = 0.528 V)
- After the second EOM, 1 thorlabs mirror and the lens were added. Measured power: 31.3 W 17 June 15:53 UTC (PMC_TRA = 0.527 V)
- Losses: 2.5-3%
- After the third EOM, 1 thorlabs mirror and the lens were added. Measured power: 29.93 W 18 June 07.38 UTC (PMC_TRA = 0.52 V), 30.08 W 18 June 07.57 UTC (PMC_TRA = 0.525 V), 30.34 W on 18 June 08.01:34 UTC (PMC_TRA = 0.53 V)
- Losses: 5.5-6%
We replaced the third EOM with the spare that was in optics lab.
- After the third EOM, 1 thorlabs mirror and the lens were added. Measured power: 30.75 W 18 June 08:43:19 UTC (PMC_TRA = 0.53 V), 30.74 W on 18 June 08:45:00 UTC (PMC_TRA = 0.53 V)
- Losses: 4.2%
The losses measured with the spare EOM were a bit lower than the old one, we don't know if this is because the cristal was a bit dusty, or if it is a alignment problem.
After doing the measurements, we realized that the spare EOM cage was not tighten correcly, so we tighten all screws, which may affect the alignment of the EOM and so its losses.
The 22.304 MHz signal that is sent to the third EOM was switched on again. The beam after the EOMs has to be realigned with the mode matching telescope.

As requested by the IFAE team, we entered the central building to turn off both slds in the WI tower.
The attached figure shows the sources' positions.
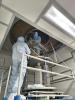
Following the cleaning of the WI tower by Nicola et al. we dismantled the WI BafFlange and installed the instrumented baffle before lunch.
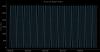
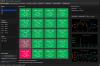
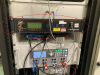
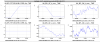
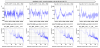
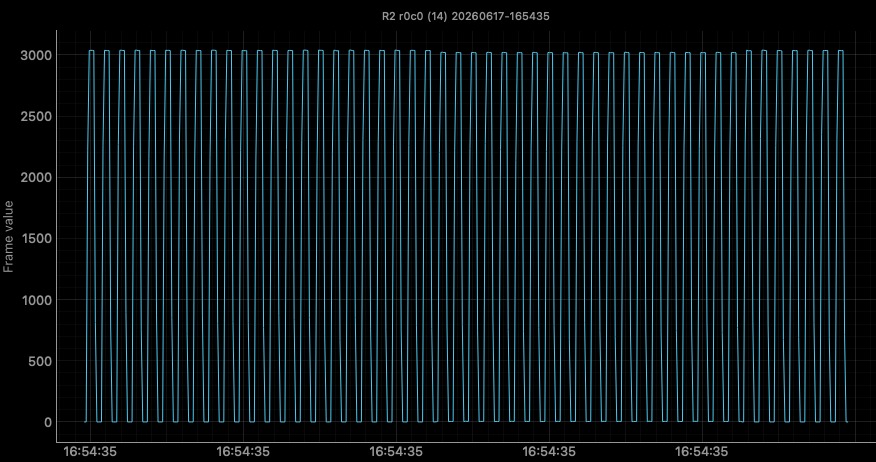
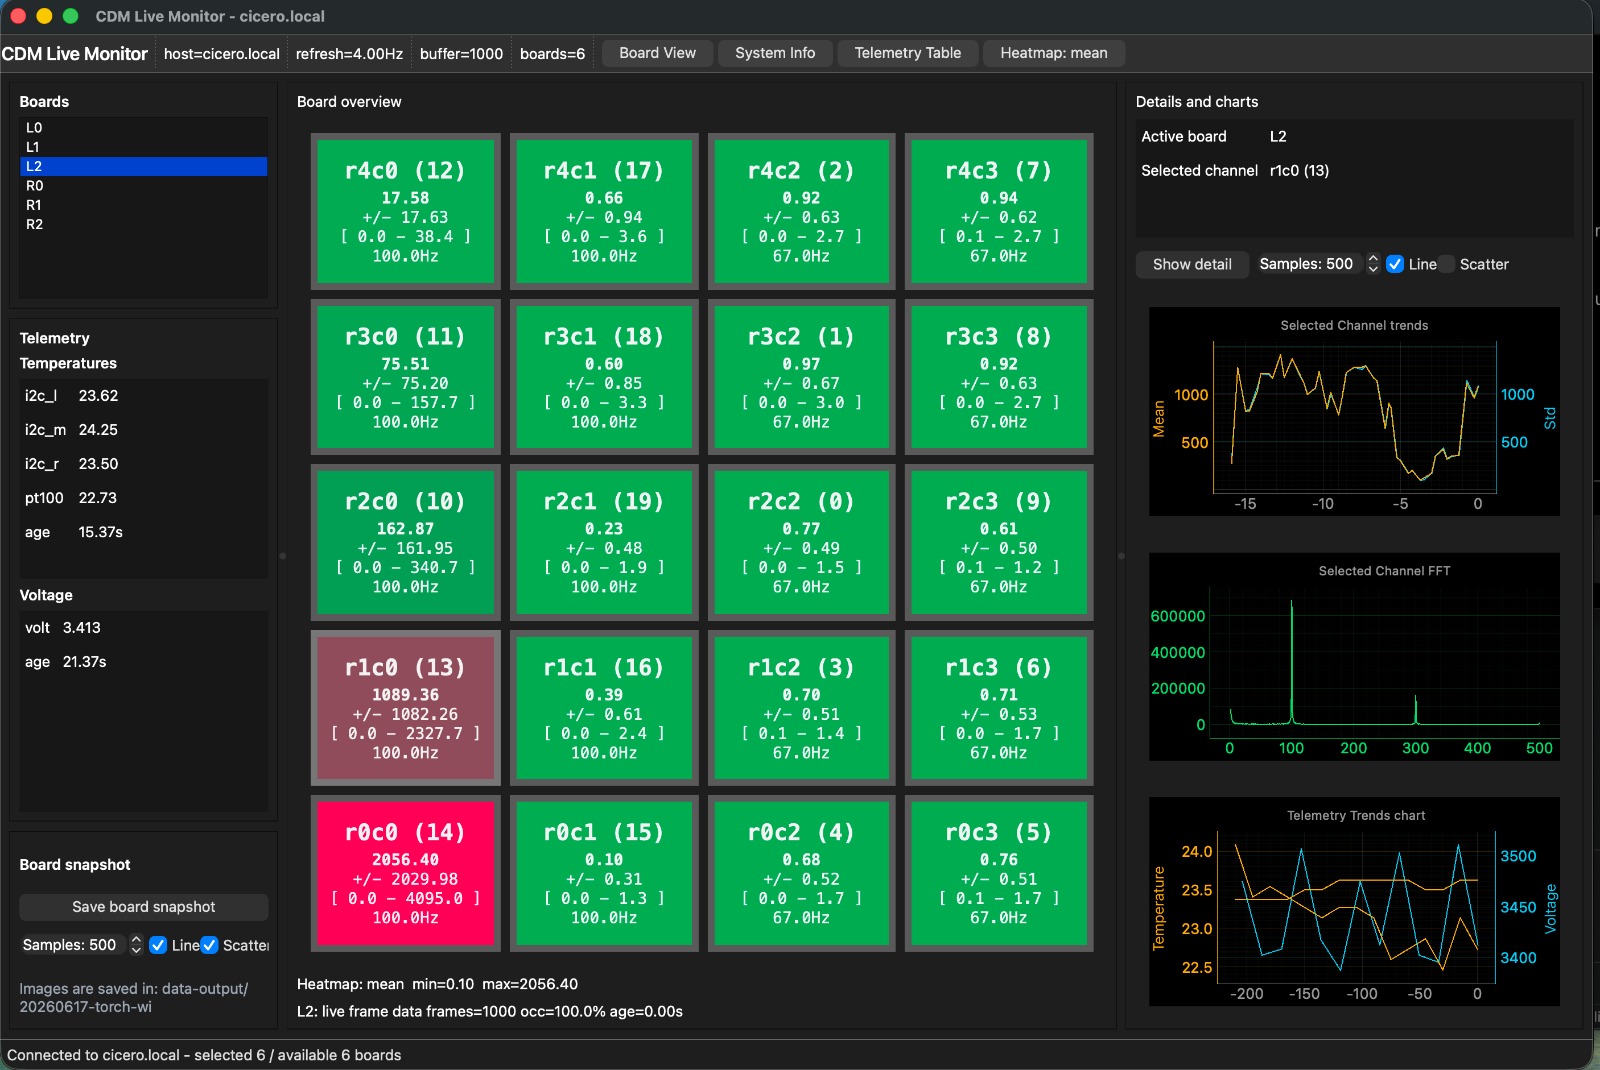
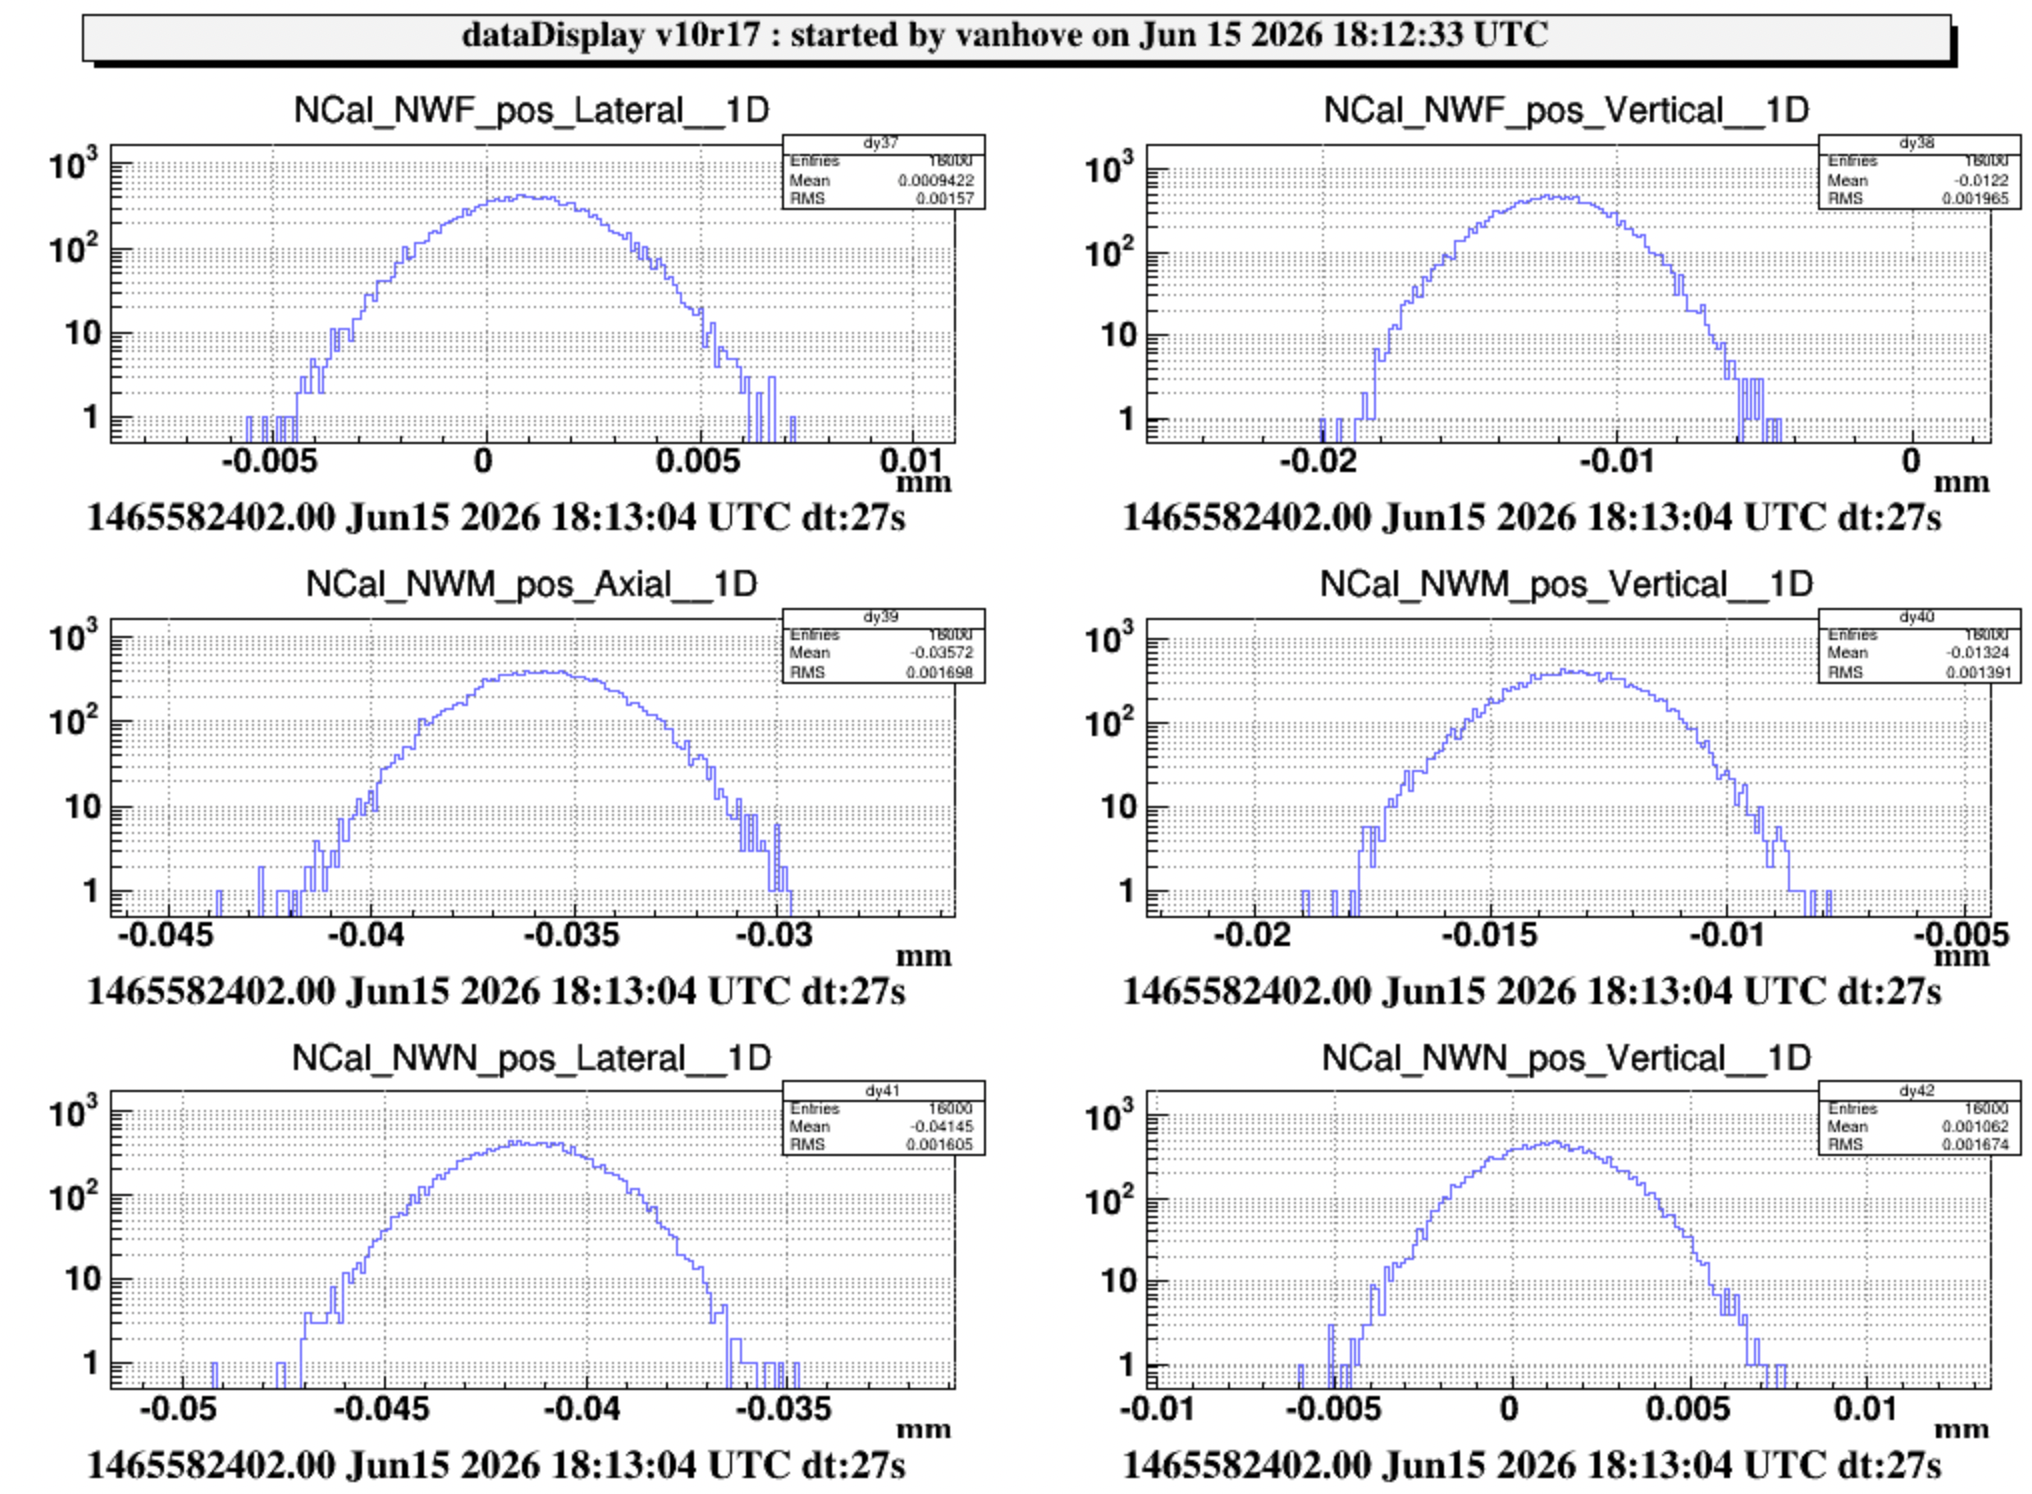
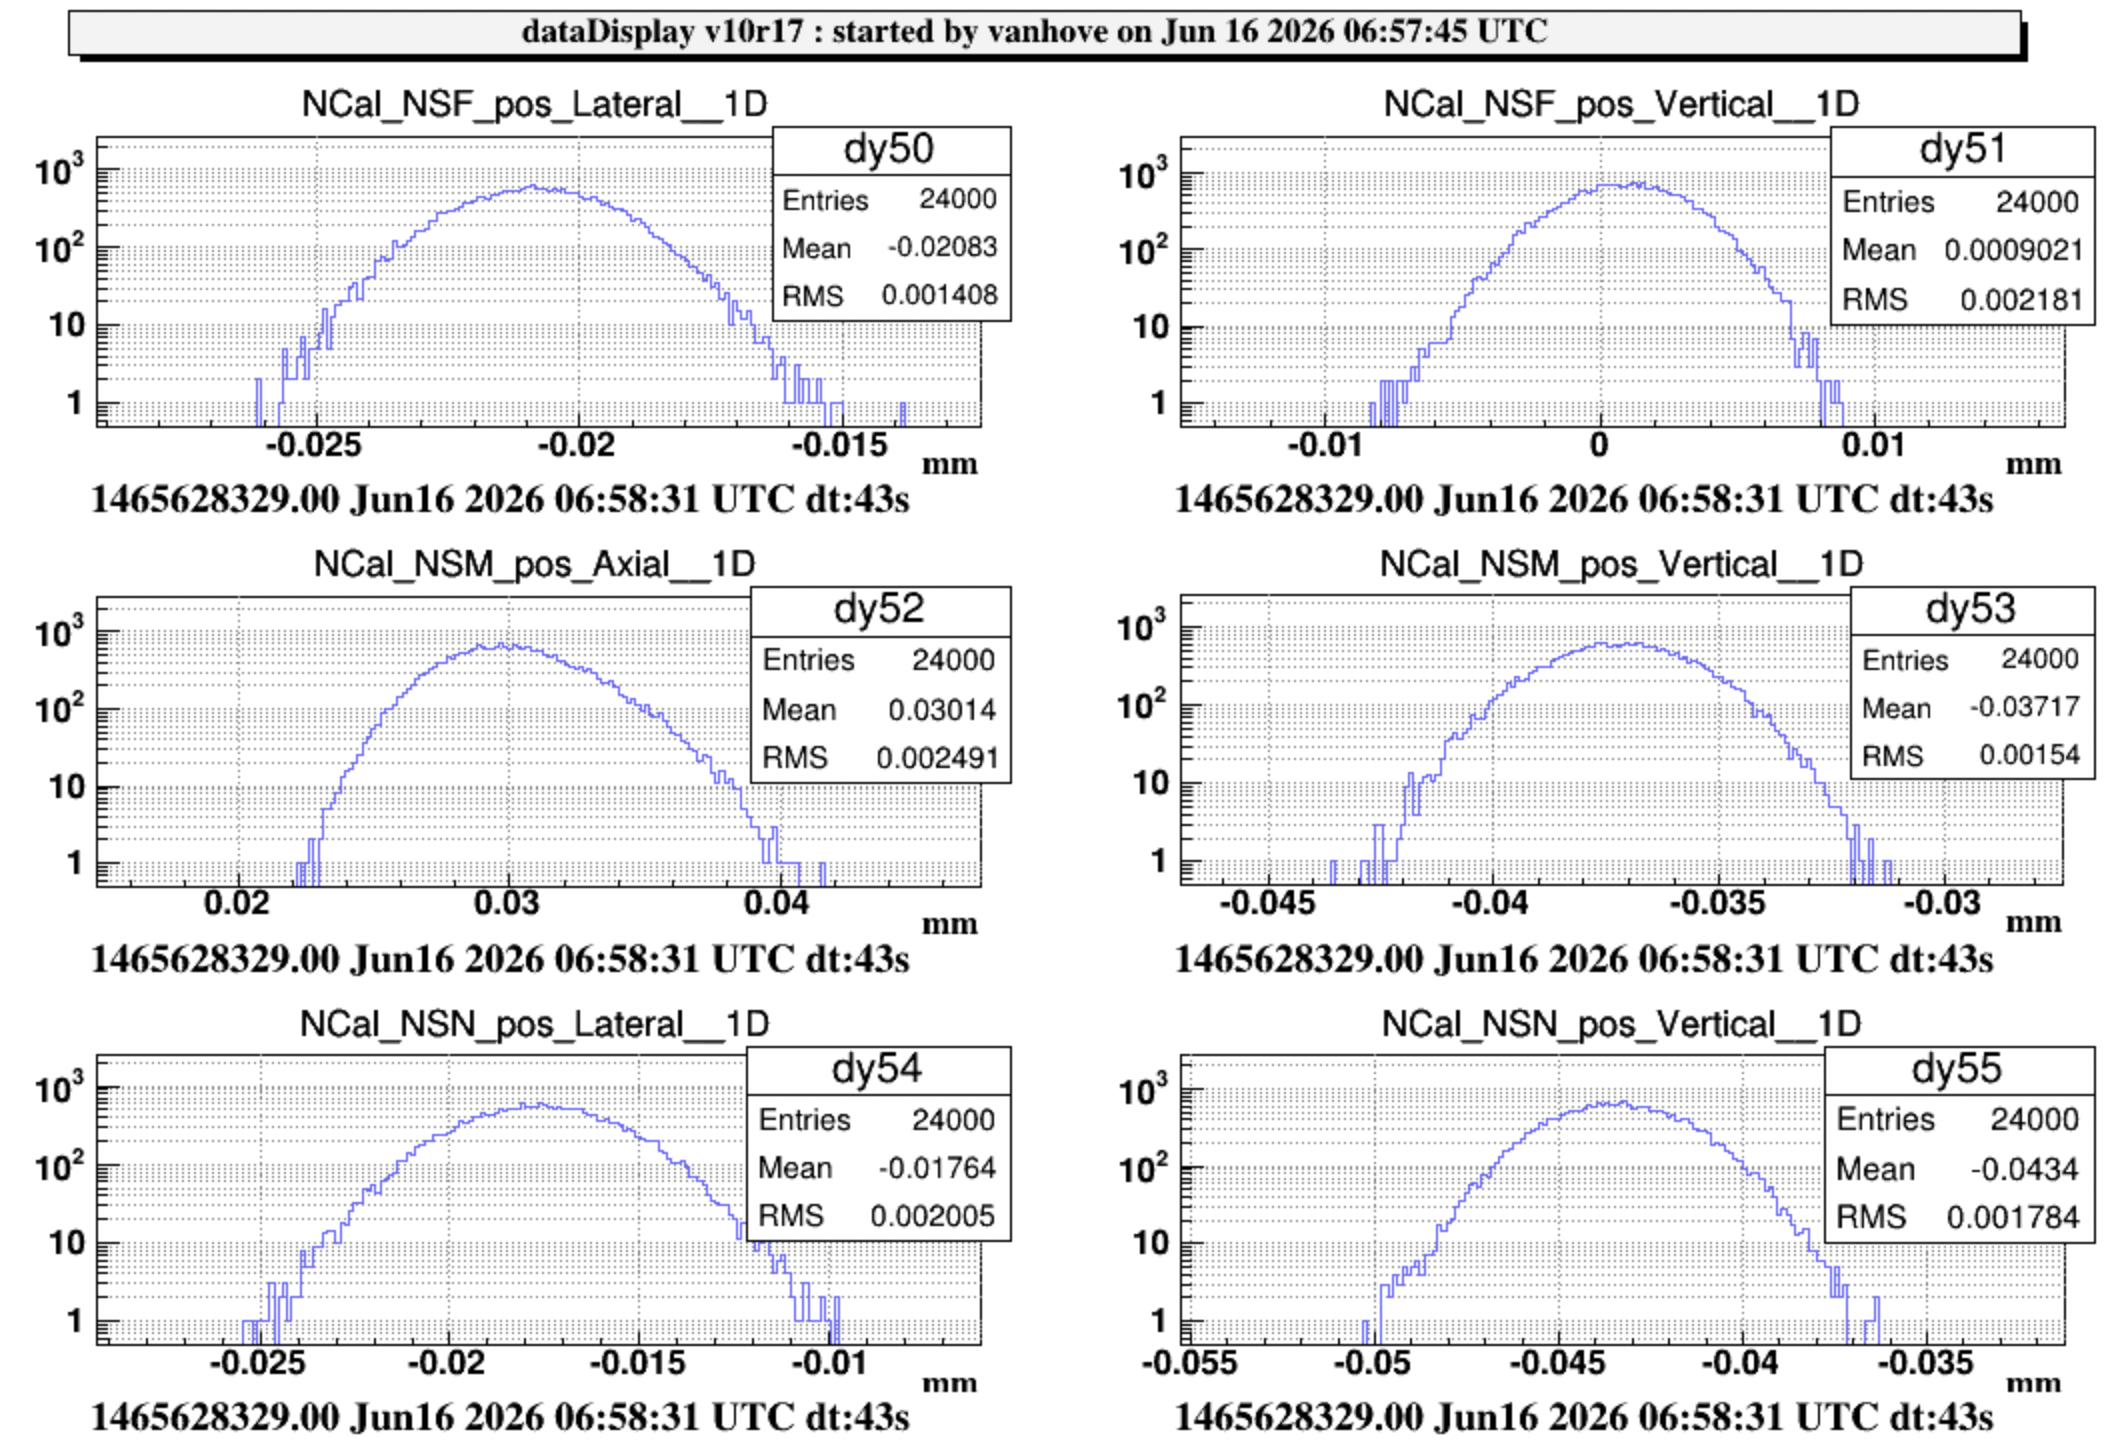
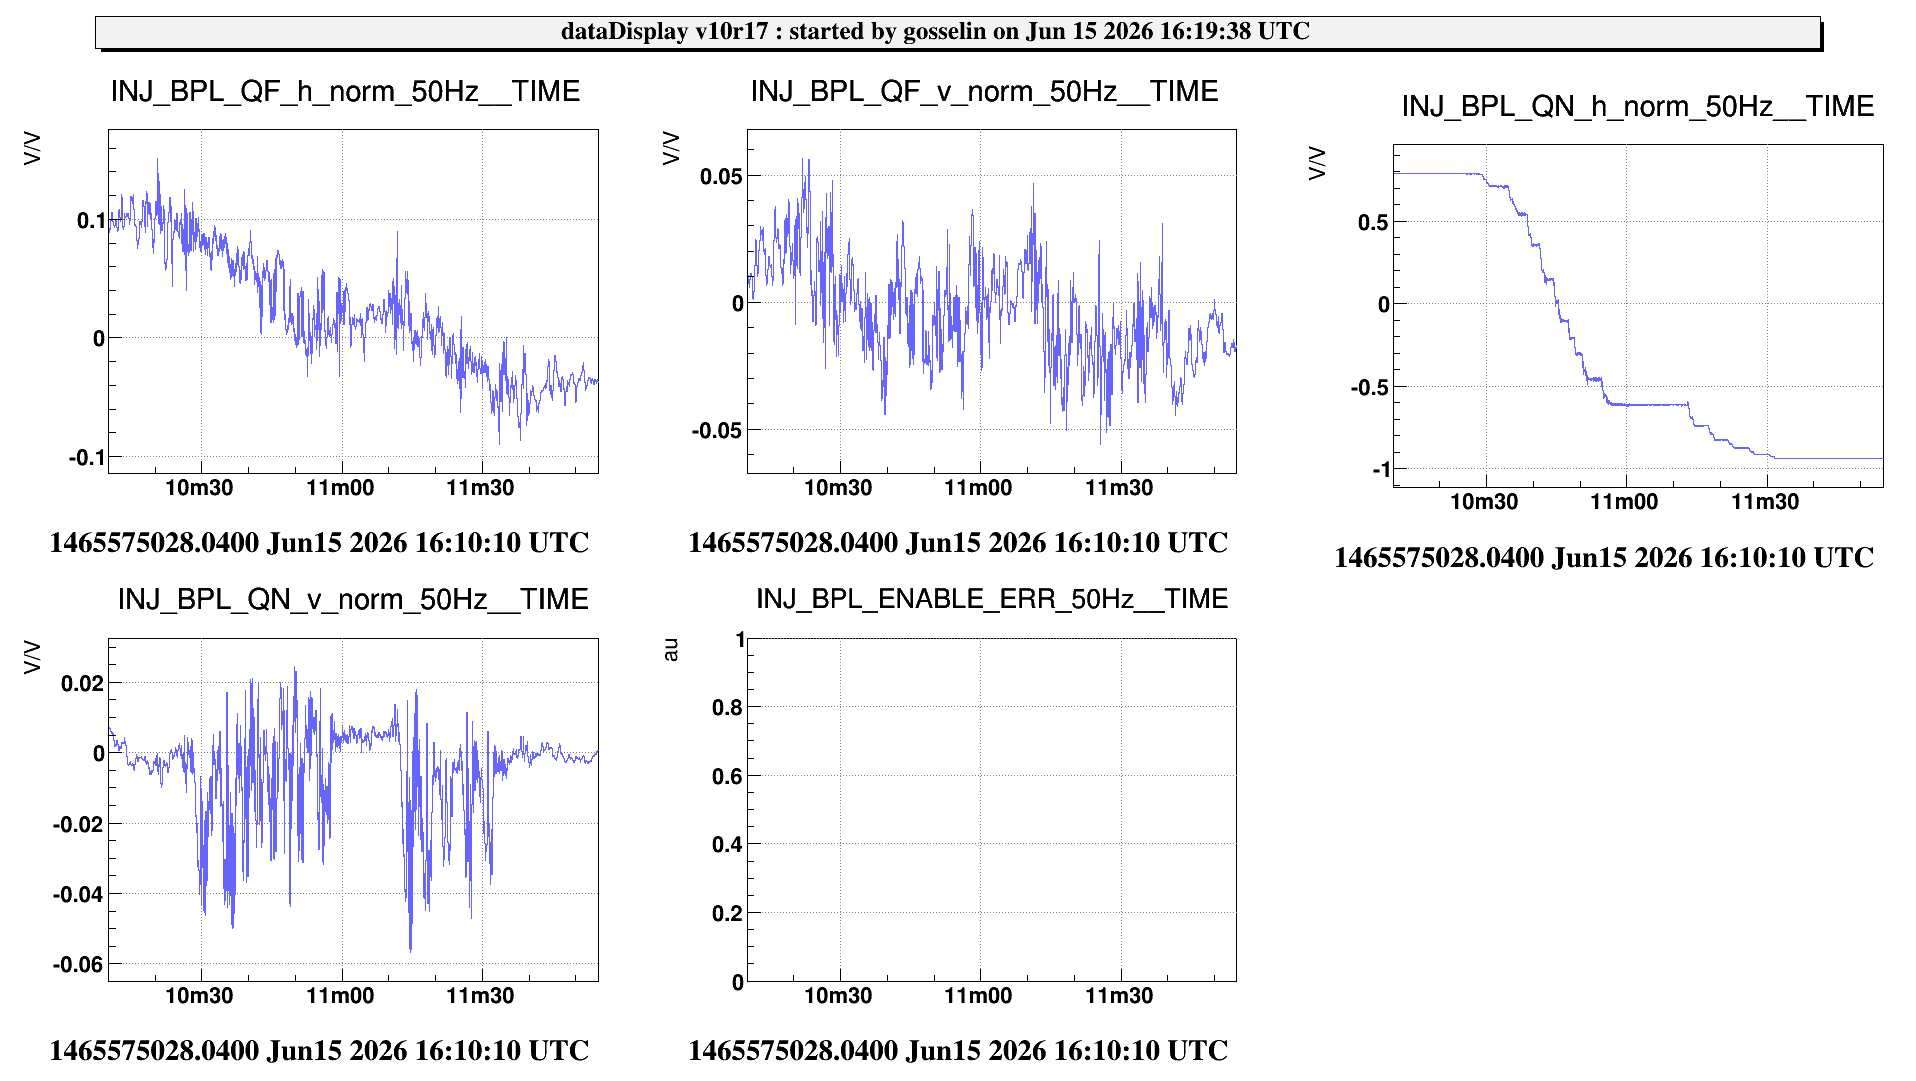
After lunch, we checked the baffle readings and found an external faulty cable. After replacing it, baffle readings look fine, see attached figures.
Finally, we installed the back baffle, getting ready for tomorrow measurements of the mechanical TF for this baffle and the installation of the WI BafFlange.
Leaving now.
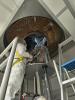

- VAC: WI tower opening cleaning;
- SLC: west input instrumental baffle installation and commissioning;
- INJ: EOM check and replacement;
People entering: Erbanni, Gargiulo, Gherardini, Menzione, Zaza.
Afterwards we will install and commission the instrumented baffle in the WI tower, followed by TF measurements.
Noel Delgado, Alex Carmona, Jose Ferrer and Otger Ballester will go in.
*** Mechanical Transfer Function Measurement of the NI Instrumented Baffle ***
Today, mechanical transfer function measurements of the NI instrumented baffle were performed. The instrumentation, data acquisition system and excitation setup are described in the previous logbook entry [elog 69222]. The instrumented baffle was excited using the (big) shaker installed on the tower base.
The single reference monoaxial accelerometer was sequentially moved among three different locations within the NI tower, shown in Figure 1 (first pdf file):
- R1: horizontal mounting position below the instrumented baffle;
- R2: vertical mounting position located close to the instrumented baffle;
- R3: horizontal mounting position on the vacuum vessel.
Figure 1 shows the three reference locations together with close-up views of the sensor installation.
The triaxial accelerometer was mounted directly on the instrumented baffle and moved between two different locations during the measurement campaign. The upper and lower accelerometer positions are shown in Figure 2 (second pdf file).
The sensor was attached using a custom adapter manufactured by the IFAE group. Due to the threaded mounting, the final orientation of the sensing axes was determined by the thread engagement and could not be precisely aligned with the nominal vertical-horizontal reference frame.
The resulting sensor orientations were:
- Top position: x-axis aligned with the cable direction, z-axis aligned with the adapter axis.
- Bottom position: x-axis aligned with the cable direction, y-axis aligned with the adapter axis.
Figure 3,4,5: Measurement configurations with the accelerometer mounted in the upper position of the instrumented baffle. The three figures show the corresponding locations of the reference accelerometer: R1,R2,R3, respectively.
Figure 6, 7, 8 : Measurement configurations with the accelerometer mounted in the lower position of the instrumented baffle. The three figures show the corresponding locations of the reference accelerometer: R1, R2, R3, respectively
The measurements were performed before the installation of the flange baffle, in order to access the instrumented baffle structure directly.
The analysis of the acquired data will follow.


==> Baffle commissioning
==> Measurements of mechanical transfer factor with Maria and Piernicola
Leaving site.
R. Cavalieri, F. Nocera
while inspecting the NE Ring Heater Power Supply (entry 69238) we noticed that the PCal Laser Power Supply (?) unit (see picture) has an ominously noisy fan.
I would suggest to have it checked/swapped with a spare.
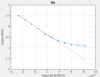
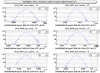
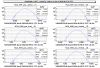
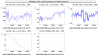
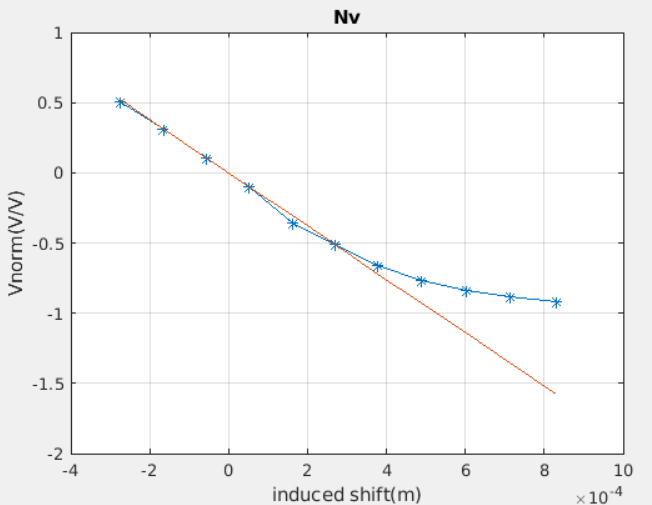
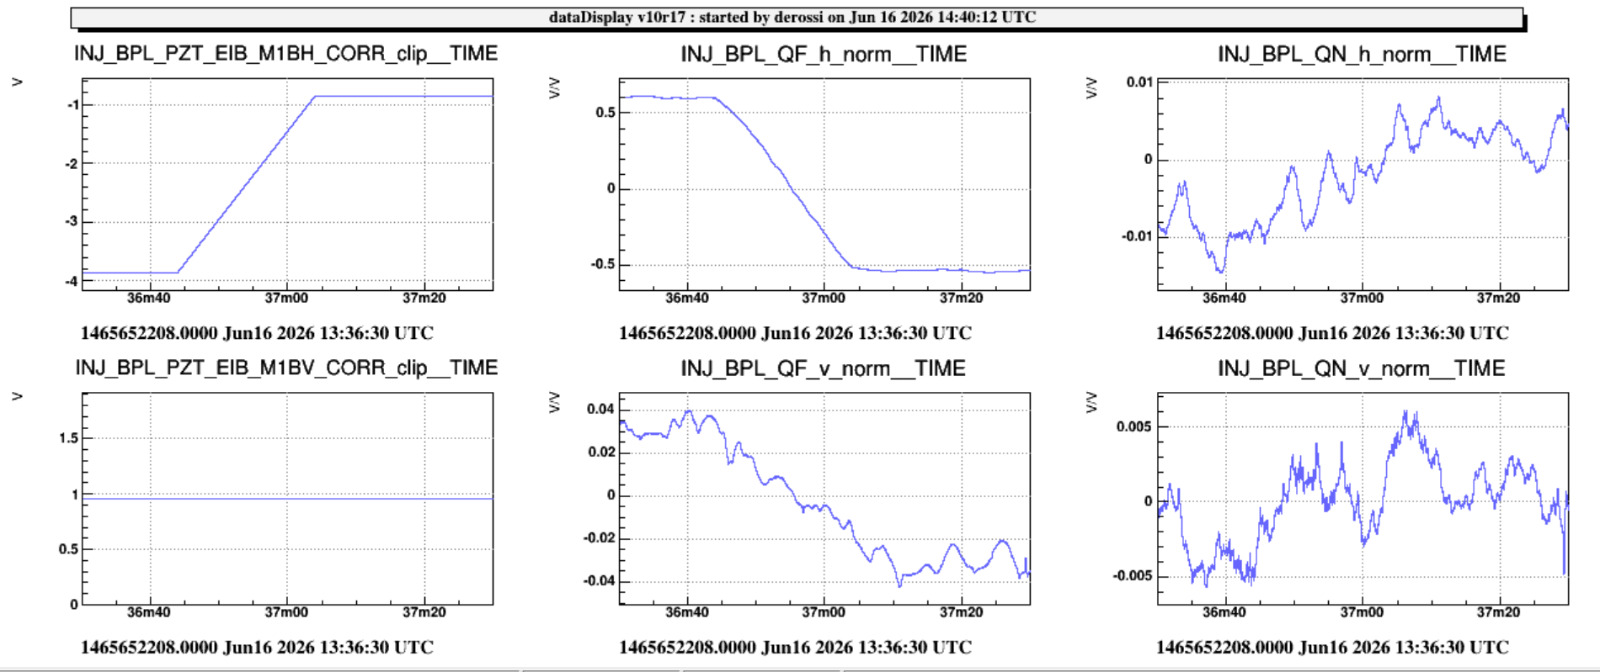
The calibration is done for the displacement at the stabilized point : the entrance of the EOM.
For the shift, the vertical one was quite clean and gave a calibration of -1900 (V/V)/m, which means 526 um/(V/V) (plot 1)
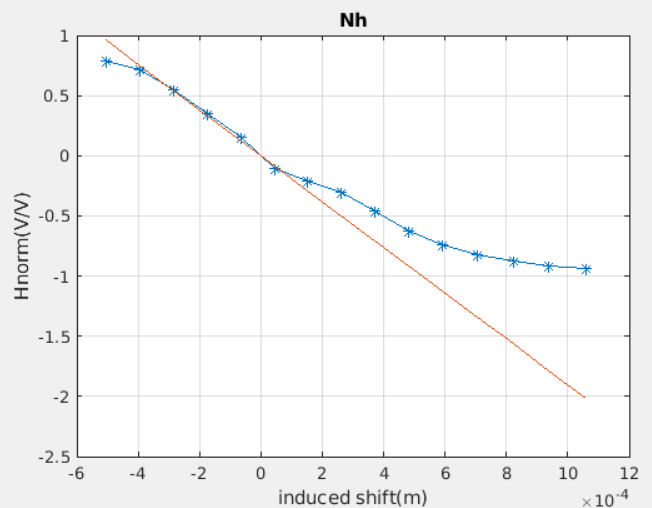
For the horizontal shift, it was not as clean as the vertical one (plot 2), we might need to redo it. For now we decided to use the same calibration than the vertical one since they are not supposed to be different.
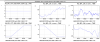
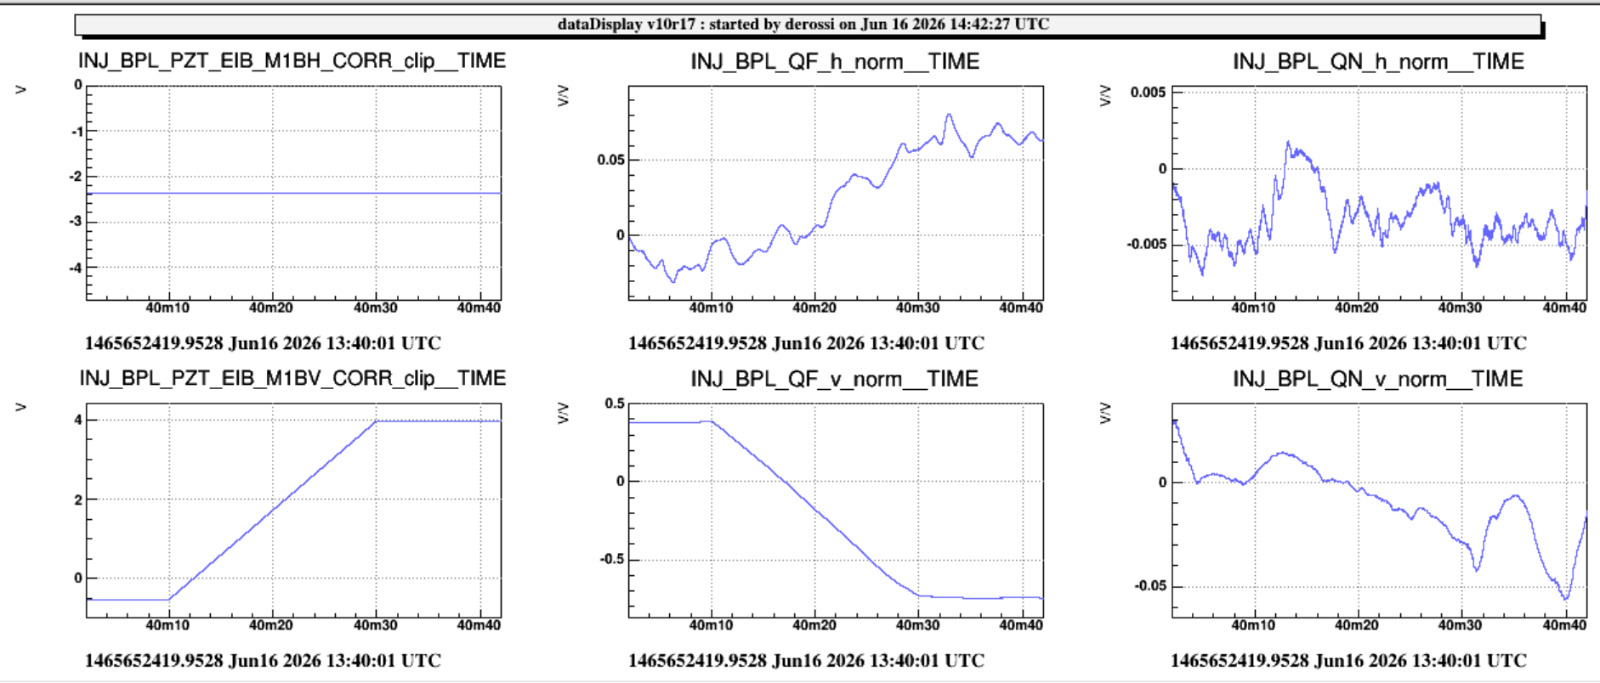
Then we did the calibration of the tilt by using the PZT on EIB (plot 3 and 4)
We know that the PZT has a dynamic of 3.5 mrad for 140 V, we did a scan of 3 V and found extreme values of 0.39 V/V and -0.73 V/V on Vnorm
We found 3.5e-3/140 *3/(0.39+0.73) = 67 urad / (V/V)
Similarly we found 68 urad / (V/V) for the horizontal.
We added the calibrated channels to ACL.
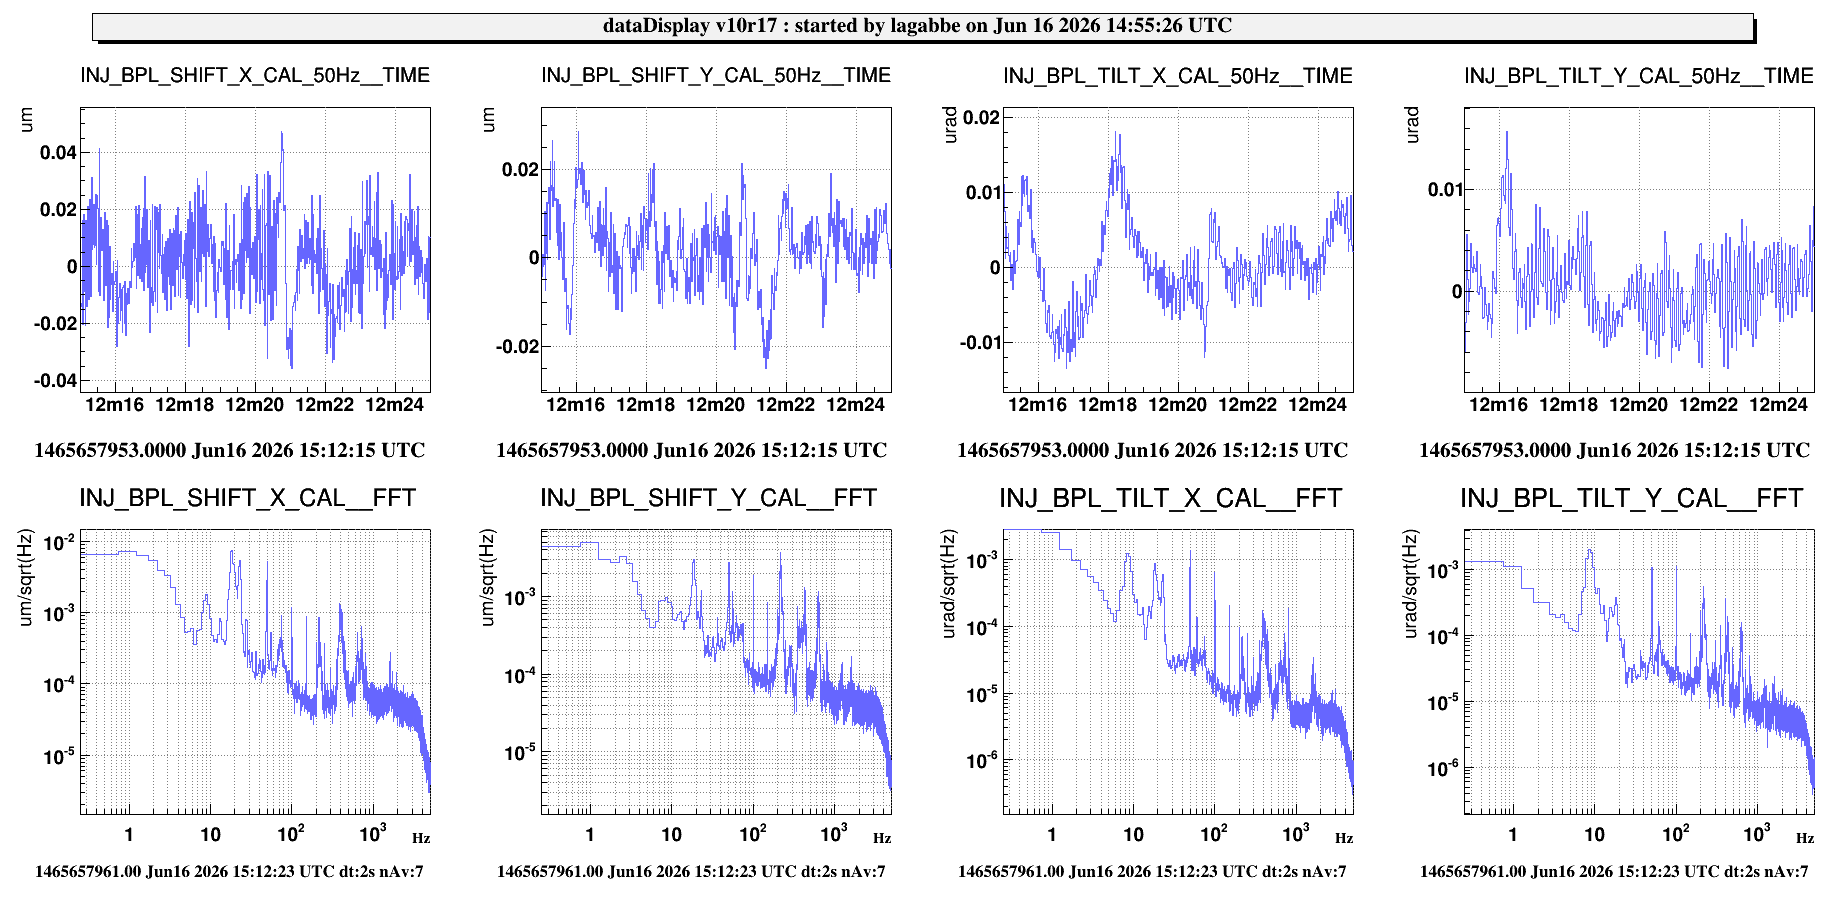
The results with the loop closed is showed in plot 5 and are quite in agreement with what we were expecting : few nrad and few nm of residual noise.
We keep the loop closed to monitor is long term behavior

- standard vacuum refill from 6:00UTC to 10:00UTC (VAC Team);
- cleaning of central building (Ciardelli and Menzione with external firm: from 6:00UTC to 10:00UTC);
- CAL: north end NCal installation rearrangement (#69230);
- TCS: north end ring heater switch off/on (#69238);
- SLC: NI instrumented baffle installation and commissioning;
R. Cavalieri, F.Nocera
we went to the NE and inspected the Ring Heater Power Supply and its cabling.
There is nothing special to say: it is a commercial device with a regular, *non-locking* power input connector and it uses a commercial 3-wire AC power supply cord (CEE 7/7 Plug to IEC 60320 C13 Power Cord, if you are interested in this sort of details).
If left alone, it does its job nicely.
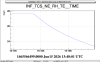
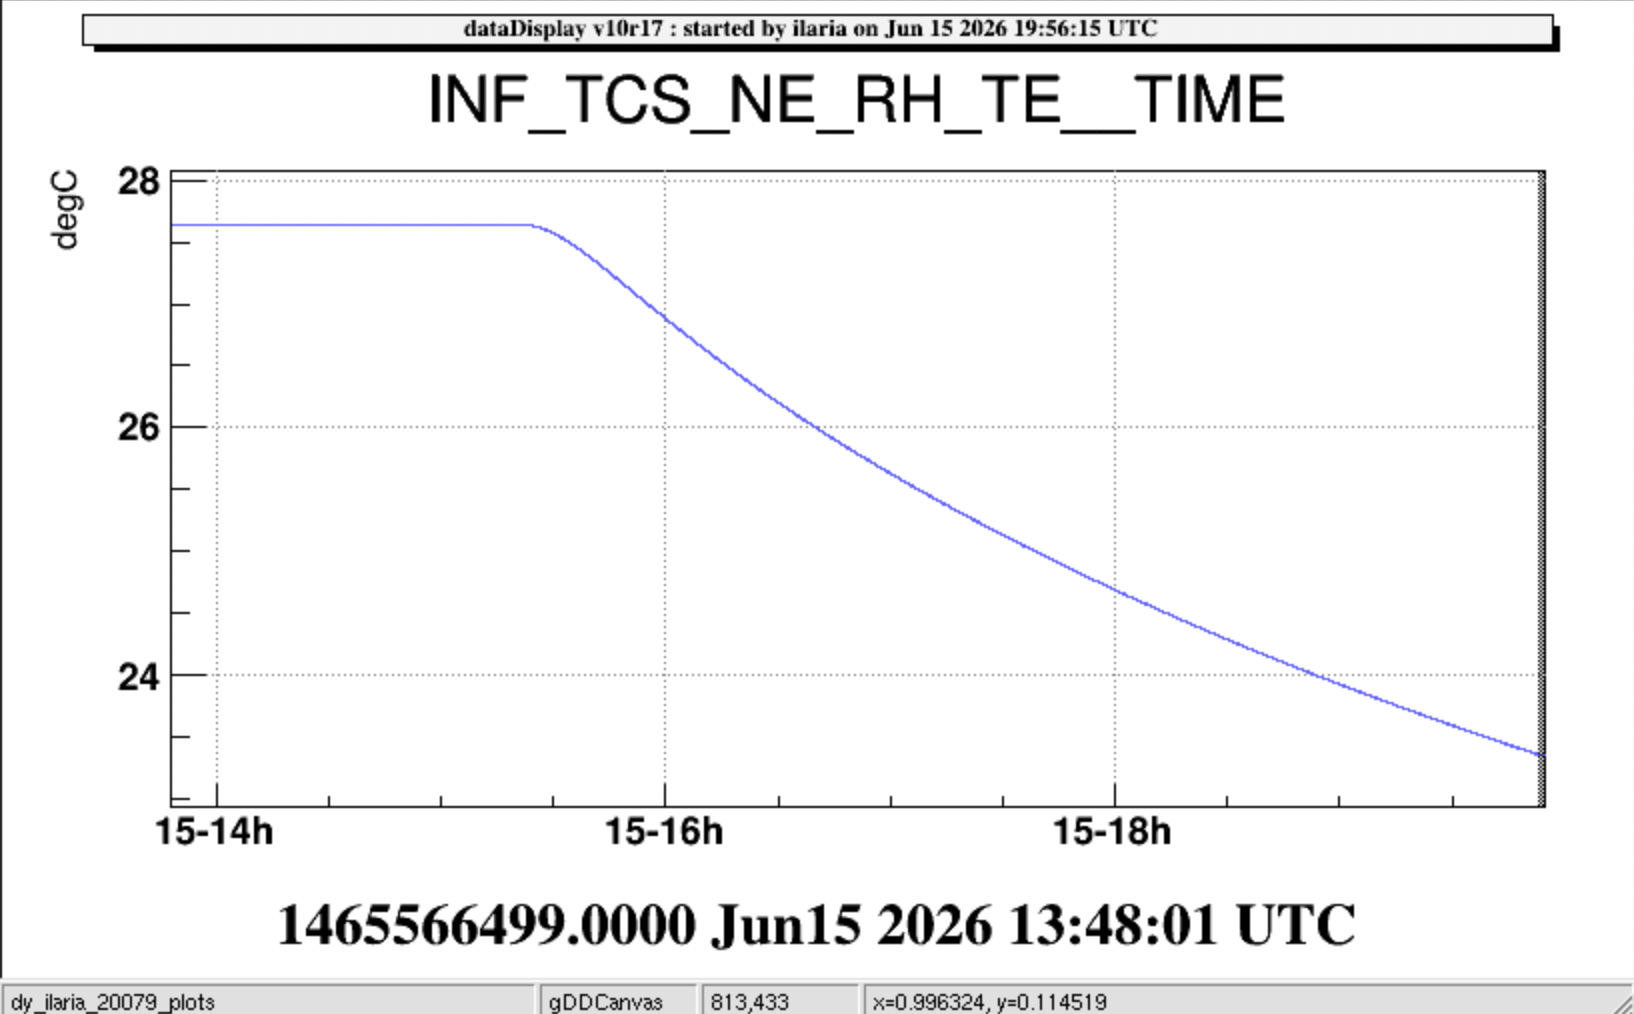
During the NCal activities yesterday, the NE RH was accidentally switched off (see Fig. 1).
Benoit reported the presence of a loose cable in the RH electronics chain. Therefore, today Flavio inspected the system to investigate the issue and verify the cable connections.
Following the inspection, the RH was switched back on at 14:23 UTC with the voltage set to 16.6 V.
R. Cavalieri, F.Nocera
we went to the NE and inspected the Ring Heater Power Supply and its cabling.
There is nothing special to say: it is a commercial device with a regular, *non-locking* power input connector and it uses a commercial 3-wire AC power supply cord (CEE 7/7 Plug to IEC 60320 C13 Power Cord, if you are interested in this sort of details).
If left alone, it does its job nicely.
Schedule: finalise installation of NEN and NWN, rearange all cablings
15 June 2026 : Start installation around 15:00 utc
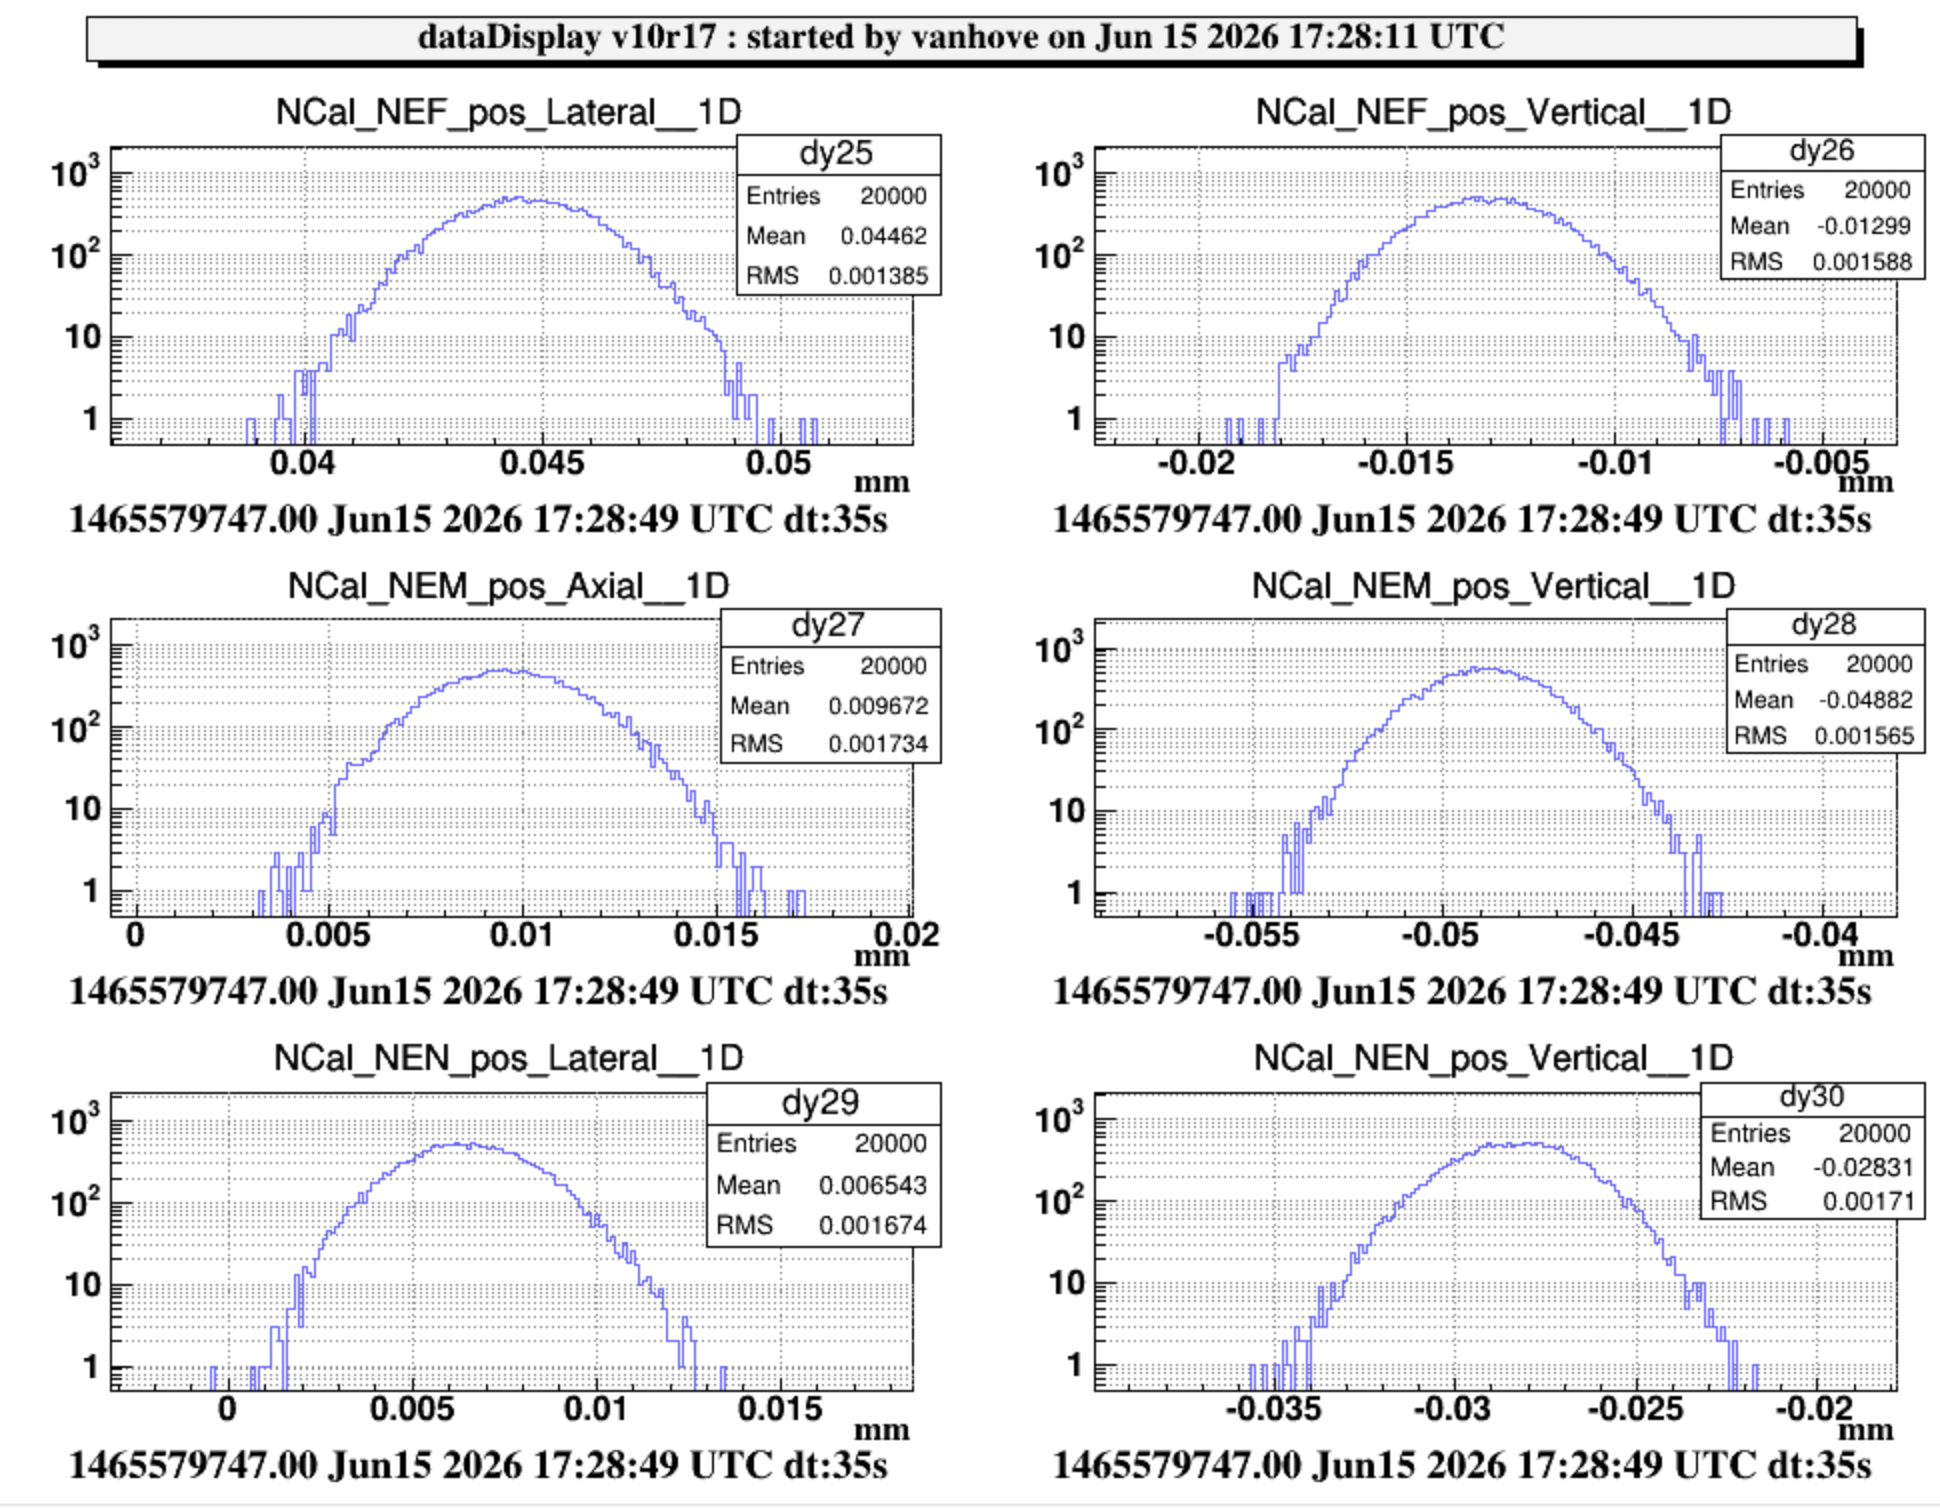
- Position adjustements for NEN setup:
- Adjust zero positions with jig for North East setup in /virgoData/VirgoOnline/SNEB_dbox_rack.cfg:
NEF lateral NEF Vertical NEM Axial NEM Vertical NEN Lateral NEN Vertical Old values -7.661 -7.03 7.435 8.225 7.954 7.306 New values -7.1195 -6.7015 7.1135 6.607 6.651 7.06 - Mean of sensors values now 0 within 1 micron precision.
- Remove jigs and align setup to better than 0.05 mm (see NEB_EastSetupAlignment histograms)
- Adjust zero positions with jig for North East setup in /virgoData/VirgoOnline/SNEB_dbox_rack.cfg:
- Position adjustements for NWN setup:
- Adjust zero with jigs in /virgoData/VirgoOnline/SNEB_dbox_rack.cfg :
NWF lateral NWF Vertical NWM Axial NWM Vertical NWN Lateral NWN Vertical Old values 7.05 -7.12 -7.753 6.7530 -8.035 7.063 New values 6.777 -6.9343 -6.9823 6.7602 -6.9060 6.7322 Means of sensors values below 1 micron now
-
Remove jigs and align setup to better than 0.05 mm (see NEB_WestSetupAlignment histogram)
- Adjust zero with jigs in /virgoData/VirgoOnline/SNEB_dbox_rack.cfg :
- Position adjustements for NSN setup:
- Adjust zero with jigs in /virgoData/VirgoOnline/SNEB_dbox_rack.cfg:
NSF Lateral NSF Vertical NSM Axial NSM Vertical NSN Lateral NSN Vertical Old values -7.444 7.619 -7.361 -7.691 7.004 -7.764 New values -7.0234 7.2171 -7.0236 -7.3403 6.4019 -7.3625 Mean sensor values below 3 micron now
- Night pause...Continue on June 16th (7:00 utc)
- Remove jigs and align setup to better than 0.05 mm (see NEB_SouthSetupAlignment histogram)
- Adjust zero with jigs in /virgoData/VirgoOnline/SNEB_dbox_rack.cfg:
At the end of the intervention we have :
Box 2021-08 (R4-32) on NSN with LED "away" from mirror
Box 2024-12 (R4-12) on NEN with LED "away" from mirror (and generating loop attached)
Box 2021-04 (R4-30) on NNN with LED "close" to mirror
Box 2024-10 (R4-10) on NWN with LED "away" fro mirror. It produces more accoustic noise than the others
The rotor cables for NWN have been installed
All rotors have been tested during few minutes at 50Hz.The difference in acoustic noise between the NNN and the others was less noticeable than at the nominal frequency.
All microphones gain have been set to 40dB (East and West setup were at 60dB. South was at 40 dB... We don't remember for North).
All temperature sensor gains have been adjusted to follow the new cabling on the DAQ boxes.
NB: During the NCal power supply reshuffling, we touched the ring heater power supply connector and the power supply switched off for a short time (on 15 June 15:30 UTC). Ring heater experts will come to check.

.jpg)
We will install the internal cables and test the readout.
If needed Noel, Jose, Otger or Alex can go in.
This afternoon we started to work on the calibration of the BPL.
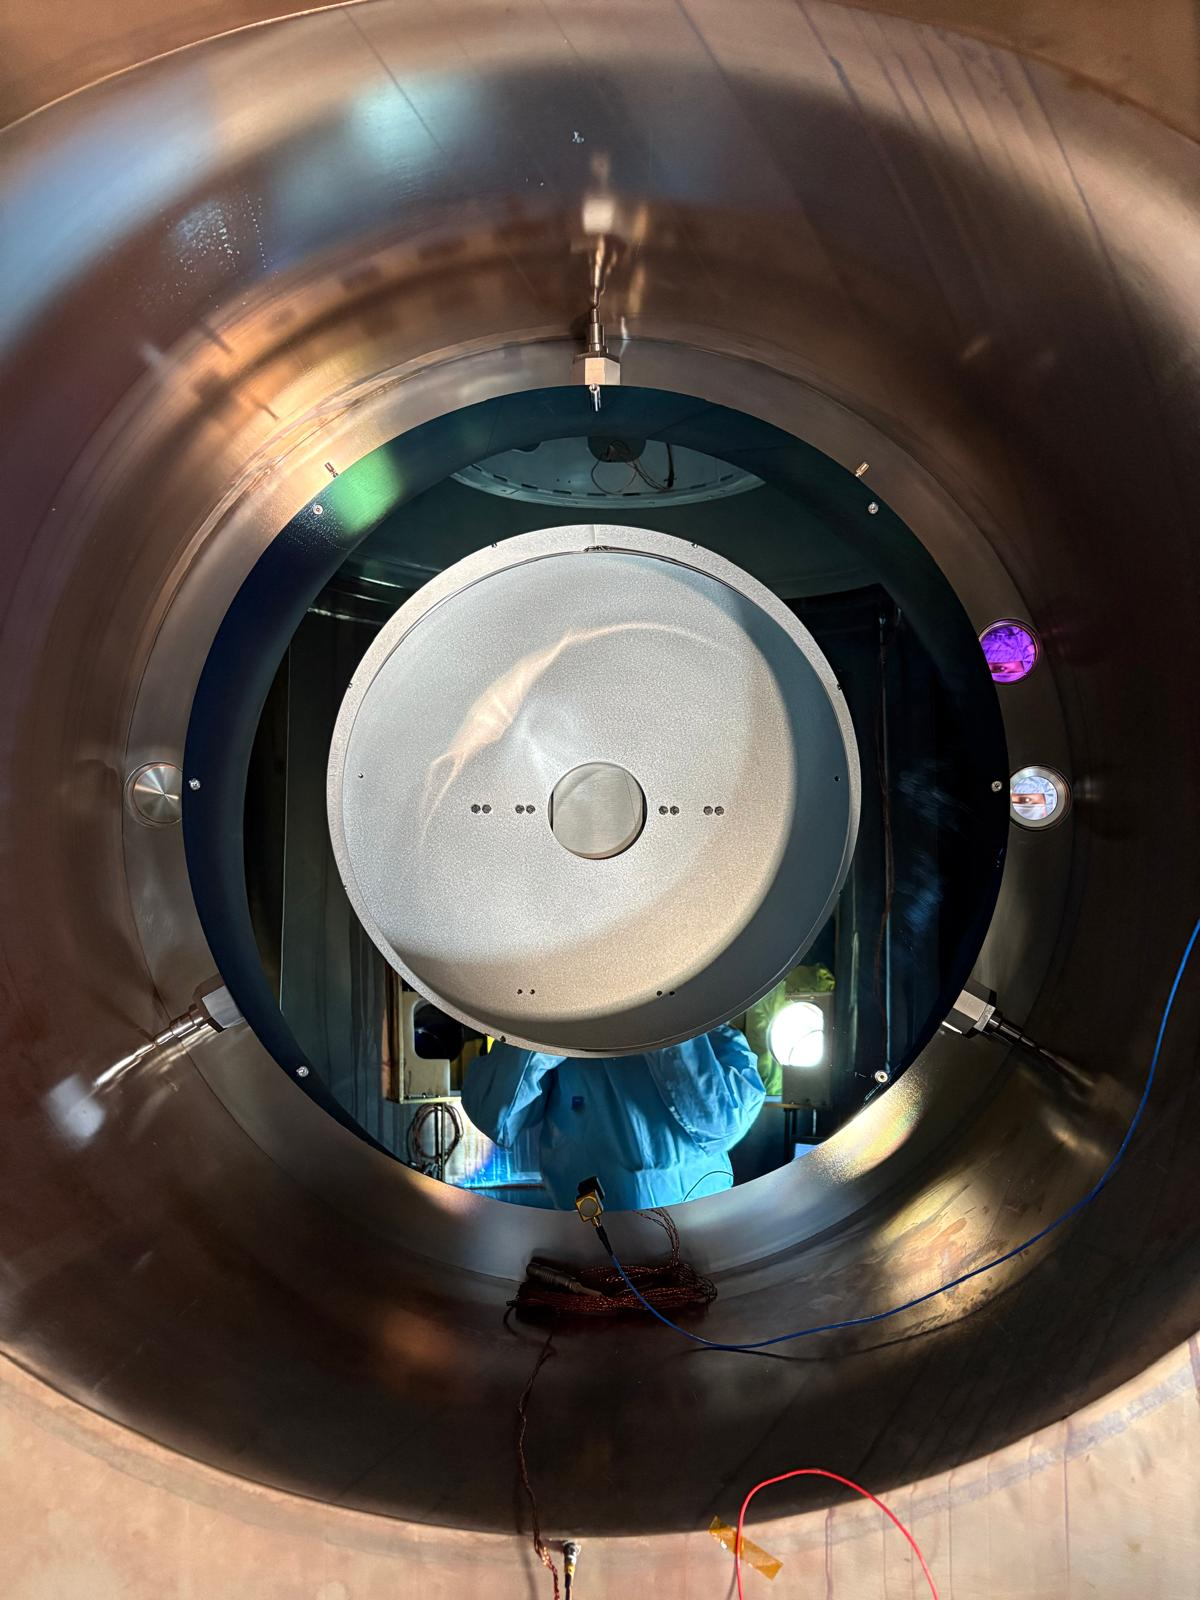
We used a substrate in fused silica which thickness is 10 mm and placed it after EIB_M1c at around the same distance than the EOM entrance (the point to be stabilized). This corresponds to about 12.5 cm from PZT2.
Then we rotated it both around the X and Y axis in order to induced a known shift towards the QPD.
The plots are attached to this entry. We will analyze it in details tomorrow.

.png)
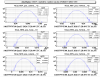
The calibration is done for the displacement at the stabilized point : the entrance of the EOM.
For the shift, the vertical one was quite clean and gave a calibration of -1900 (V/V)/m, which means 526 um/(V/V) (plot 1)
For the horizontal shift, it was not as clean as the vertical one (plot 2), we might need to redo it. For now we decided to use the same calibration than the vertical one since they are not supposed to be different.
Then we did the calibration of the tilt by using the PZT on EIB (plot 3 and 4)
We know that the PZT has a dynamic of 3.5 mrad for 140 V, we did a scan of 3 V and found extreme values of 0.39 V/V and -0.73 V/V on Vnorm
We found 3.5e-3/140 *3/(0.39+0.73) = 67 urad / (V/V)
Similarly we found 68 urad / (V/V) for the horizontal.
We added the calibrated channels to ACL.
The results with the loop closed is showed in plot 5 and are quite in agreement with what we were expecting : few nrad and few nm of residual noise.
We keep the loop closed to monitor is long term behavior
.jpg)
.png)
People entering: Erbanni, Francescon, Menzione, Pasqualetti, Zaza
ITF found DOWN in UPGRADING mode.
Below the list of the activities communicated in control room:
- NI instrumented baffle installation - https://logbook.virgo-gw.eu/virgo/?r=69224
- removal of the WI baffle - https://logbook.virgo-gw.eu/virgo/?r=69225
- in the afternoon the INJ team worked at BPL calibration
Noel Delgado, Jose Ferrer, Otger Ballester and Alex Carmona will go in.