In parallel with the investigation of the loud mid-frequency glitches (#66895), I looked into possible correlations between fluctuations in the BNS range (possibly affected by the glitches) and the information available from auxiliary channels.
Specifically, I correlated data from the DQ Studies operational mode segments from June 4-5 with all _mean and _max channels from the trend frame (~14k), excluding obvious unsafe channels (e.g., BruCo excluded channel list).
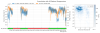
The result was not particularly conclusive. The highest correlation (Pearson coefficient ≈ –0.35) was found with the following channels: V1:ENV_CEB_RF_8MHz_Q_FS_rms and V1:ENV_CEB_RF_8MHz_I_rms.
Figure 1 shows the time series of the BNS range and the first auxiliary channel over the entire analyzed interval.
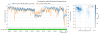
Figure 2 shows a zoom into the final segment in DQ Studies mode. Some dips in the range appear to be correlated with this auxiliary channel, though not all variations are aligned. It’s unclear how informative this correlation is; I leave further interpretation to the experts.
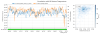
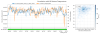
In addition to these, a non-negligible correlation was found with the V1:NCal_WSN_motor_T_*_mean channels.
Looking at the final segment in DQ Studies mode, some oscillations in both the range and auxiliary channels do appear to be aligned: see Fig 3 and 4. Again, it's not clear how informative this observation is.
I plan to refine the analysis as soon as new data in DQ Studies operational mode becomes available, following the ongoing thermal tuning and the other Commissioning activities.
EDIT: Please note that the title at the top of the plots is wrong (a reminder of past correlation studies...)