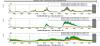
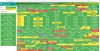
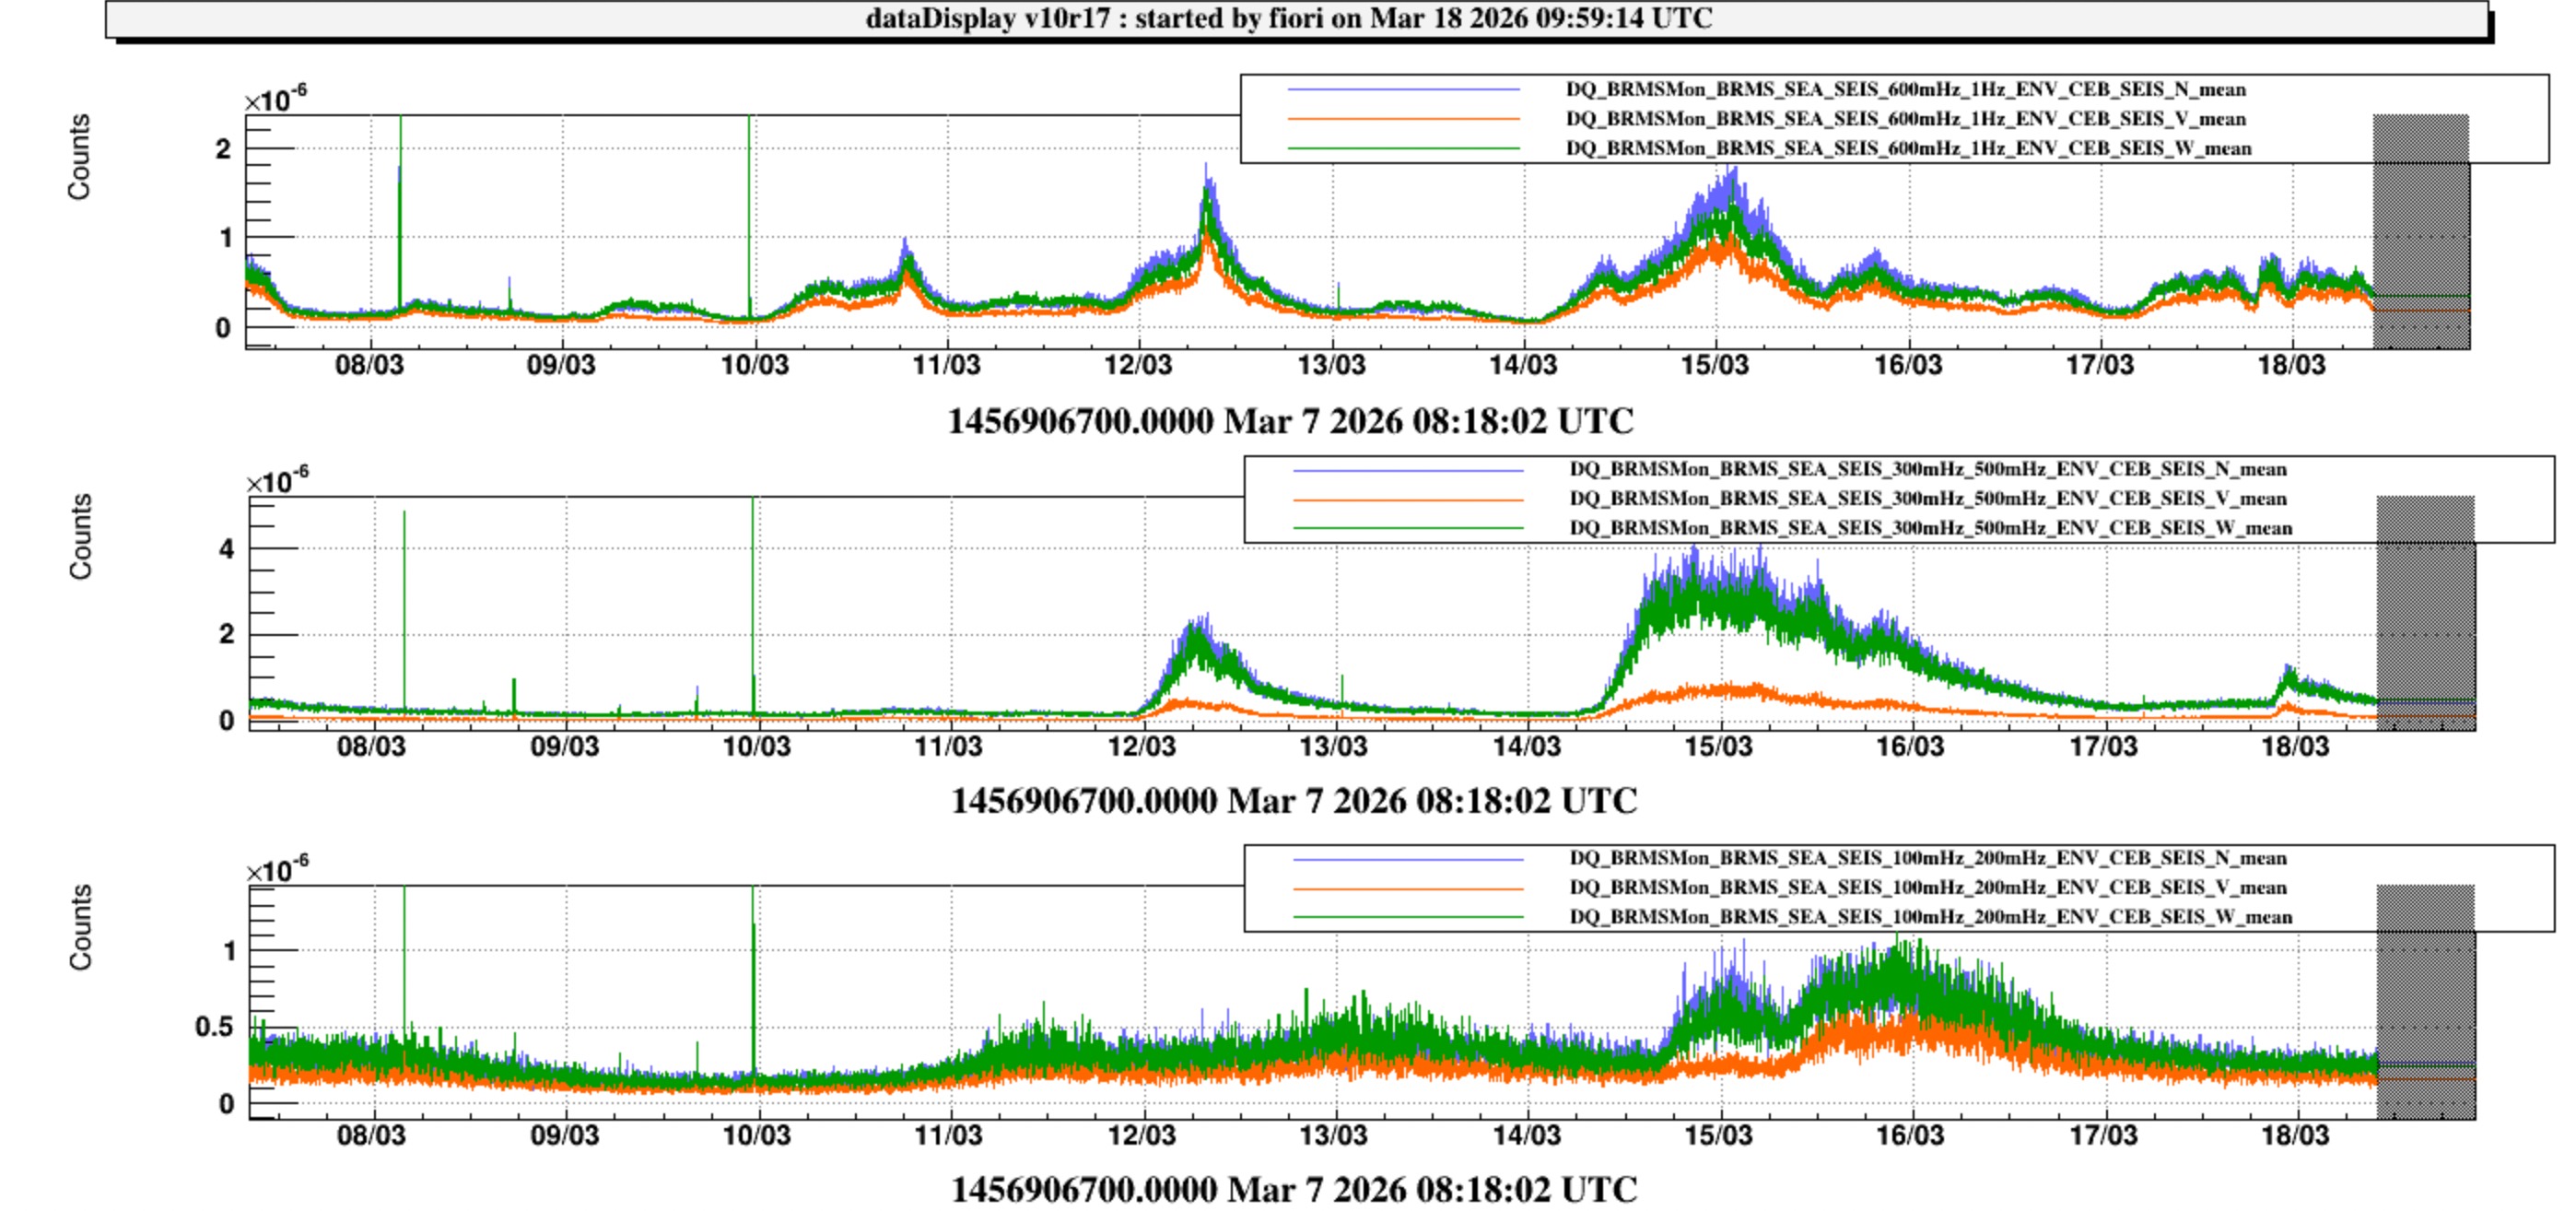
Figure 1 shows the monitors of sea activity that we have in trend data since several year now. The BRMSMon process computes the rms of each Guralp seismometer signal (three buildings: CEB, NEB, WEB and three directions: N,V,W) in three bands, tailored around main microseismic peaks, which are from time to time observed and associated to sea activity (we refer also to this old study VIR-NOT-FIR-1390-261):
- 100 - 200 mHz > Atlatic ocean, usually observed in winter time (https://logbook.virgo-gw.eu/virgo/?r=65609)
- 300 - 500 mHz > Mediterranean sea, seen most of the time growing during a swell
- 600 - 800 mHz > separate peak often present during evolution of long swells
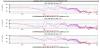
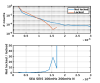
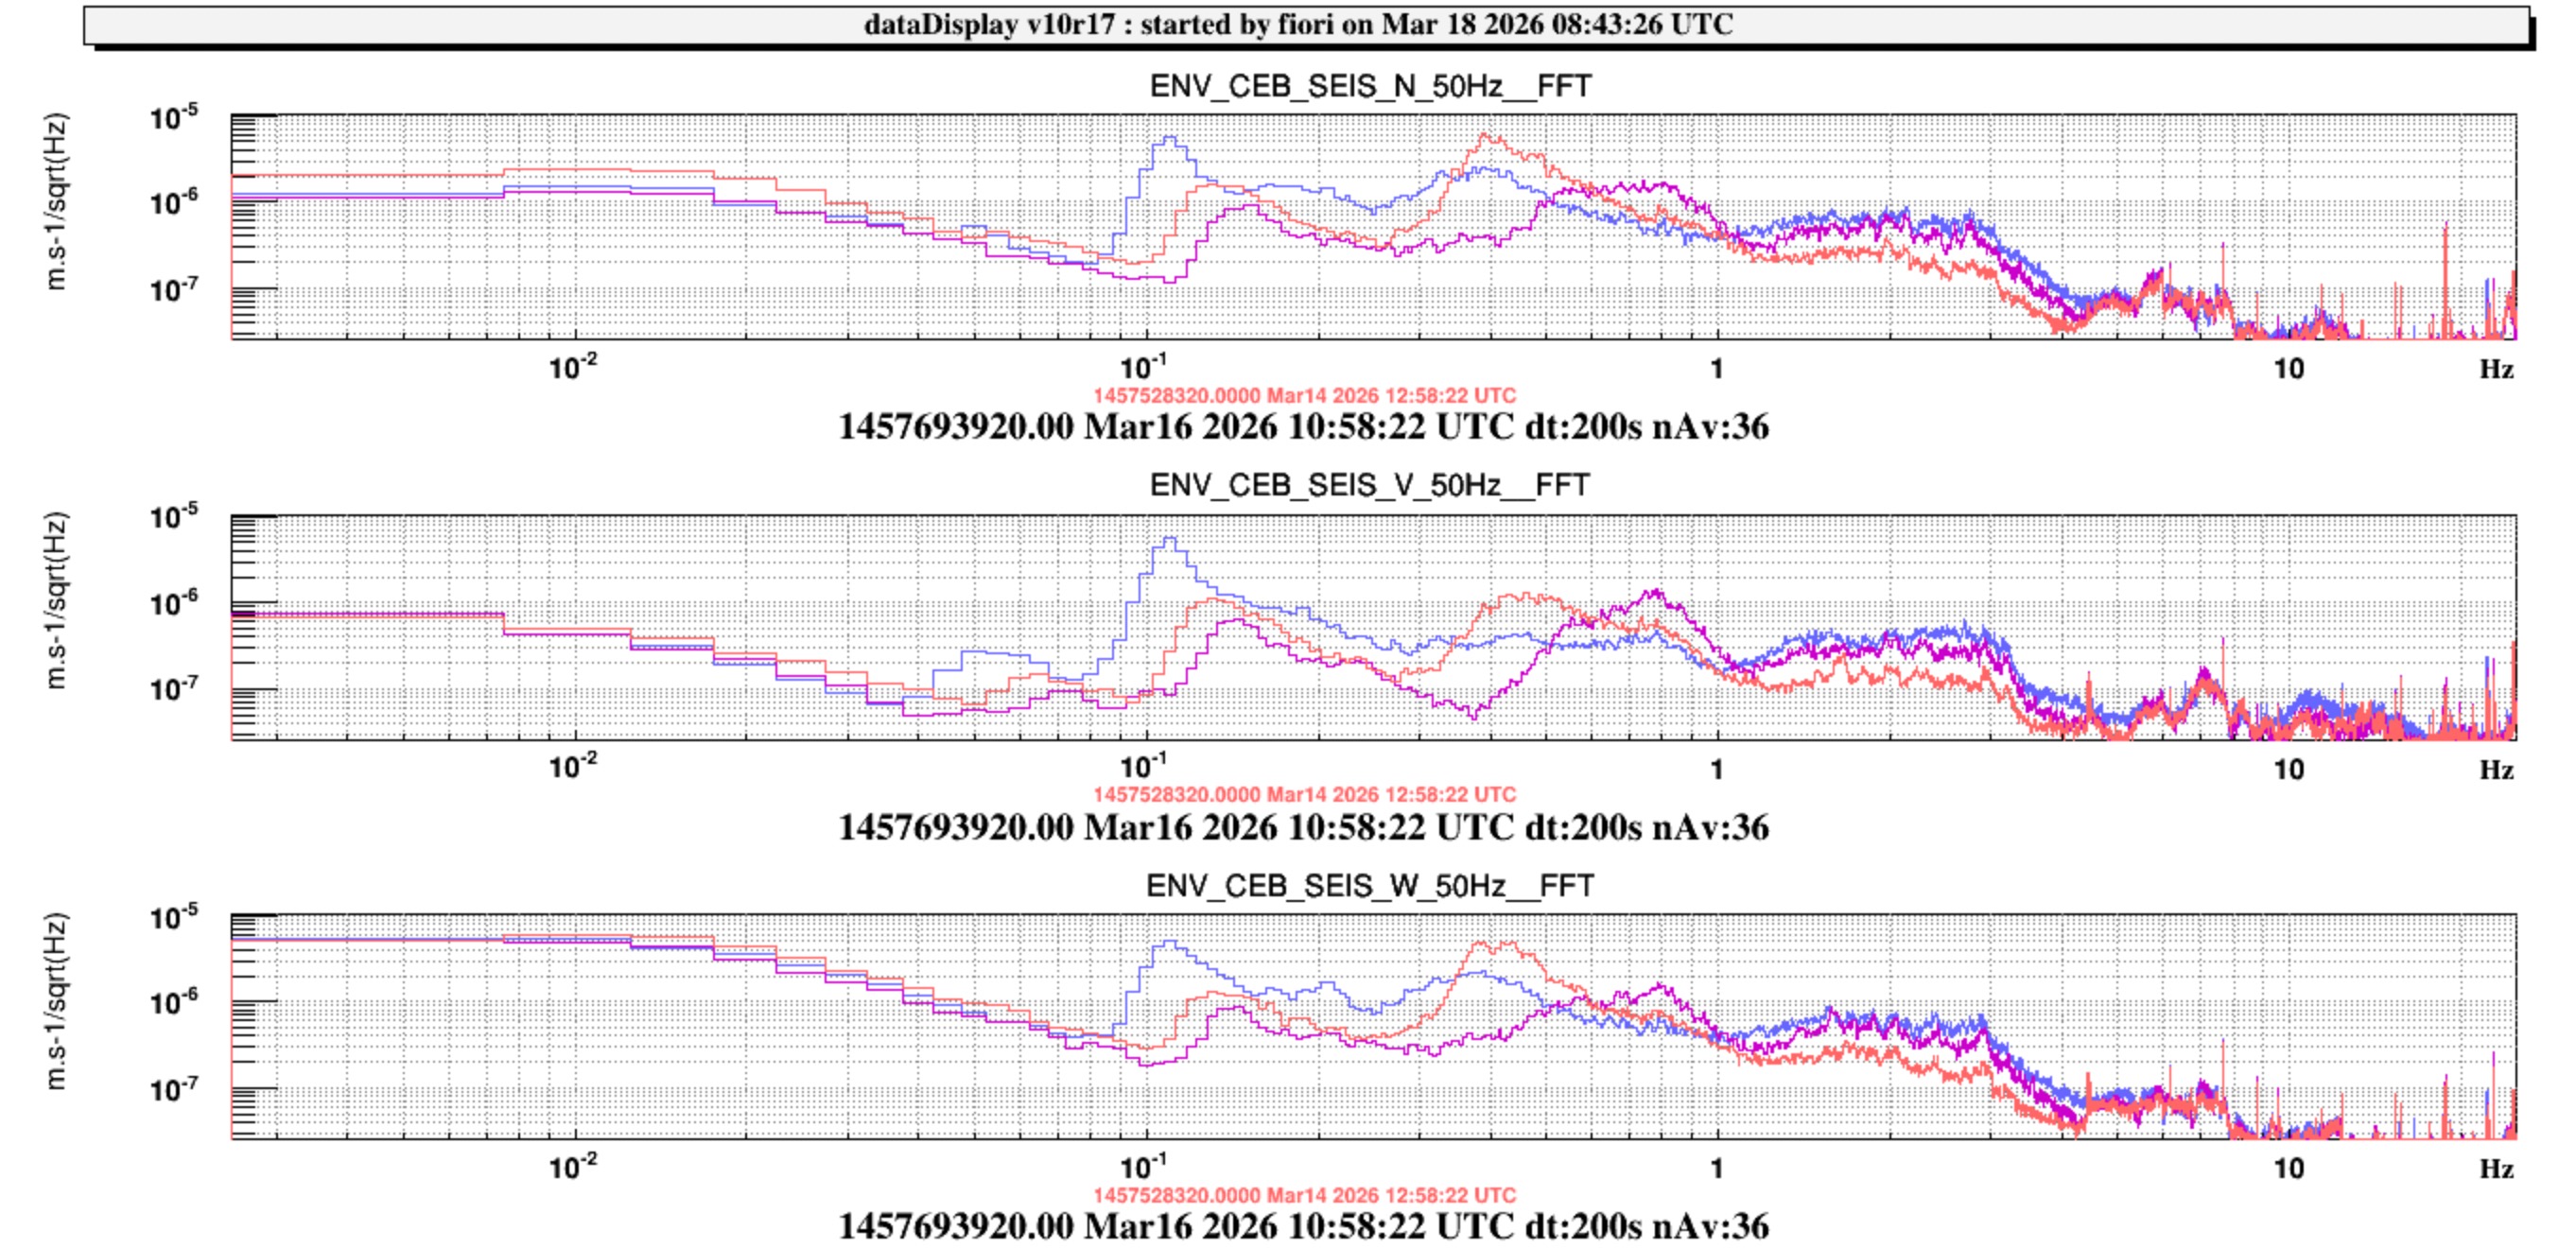
Figure 2 shows seimic spectra at selected times during the last 10 days when each peak was dominant. In particular, the oceninc peak has been more or less always present during that week, and the strongest on March 15 and 16 (Figure 1).
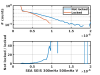
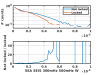
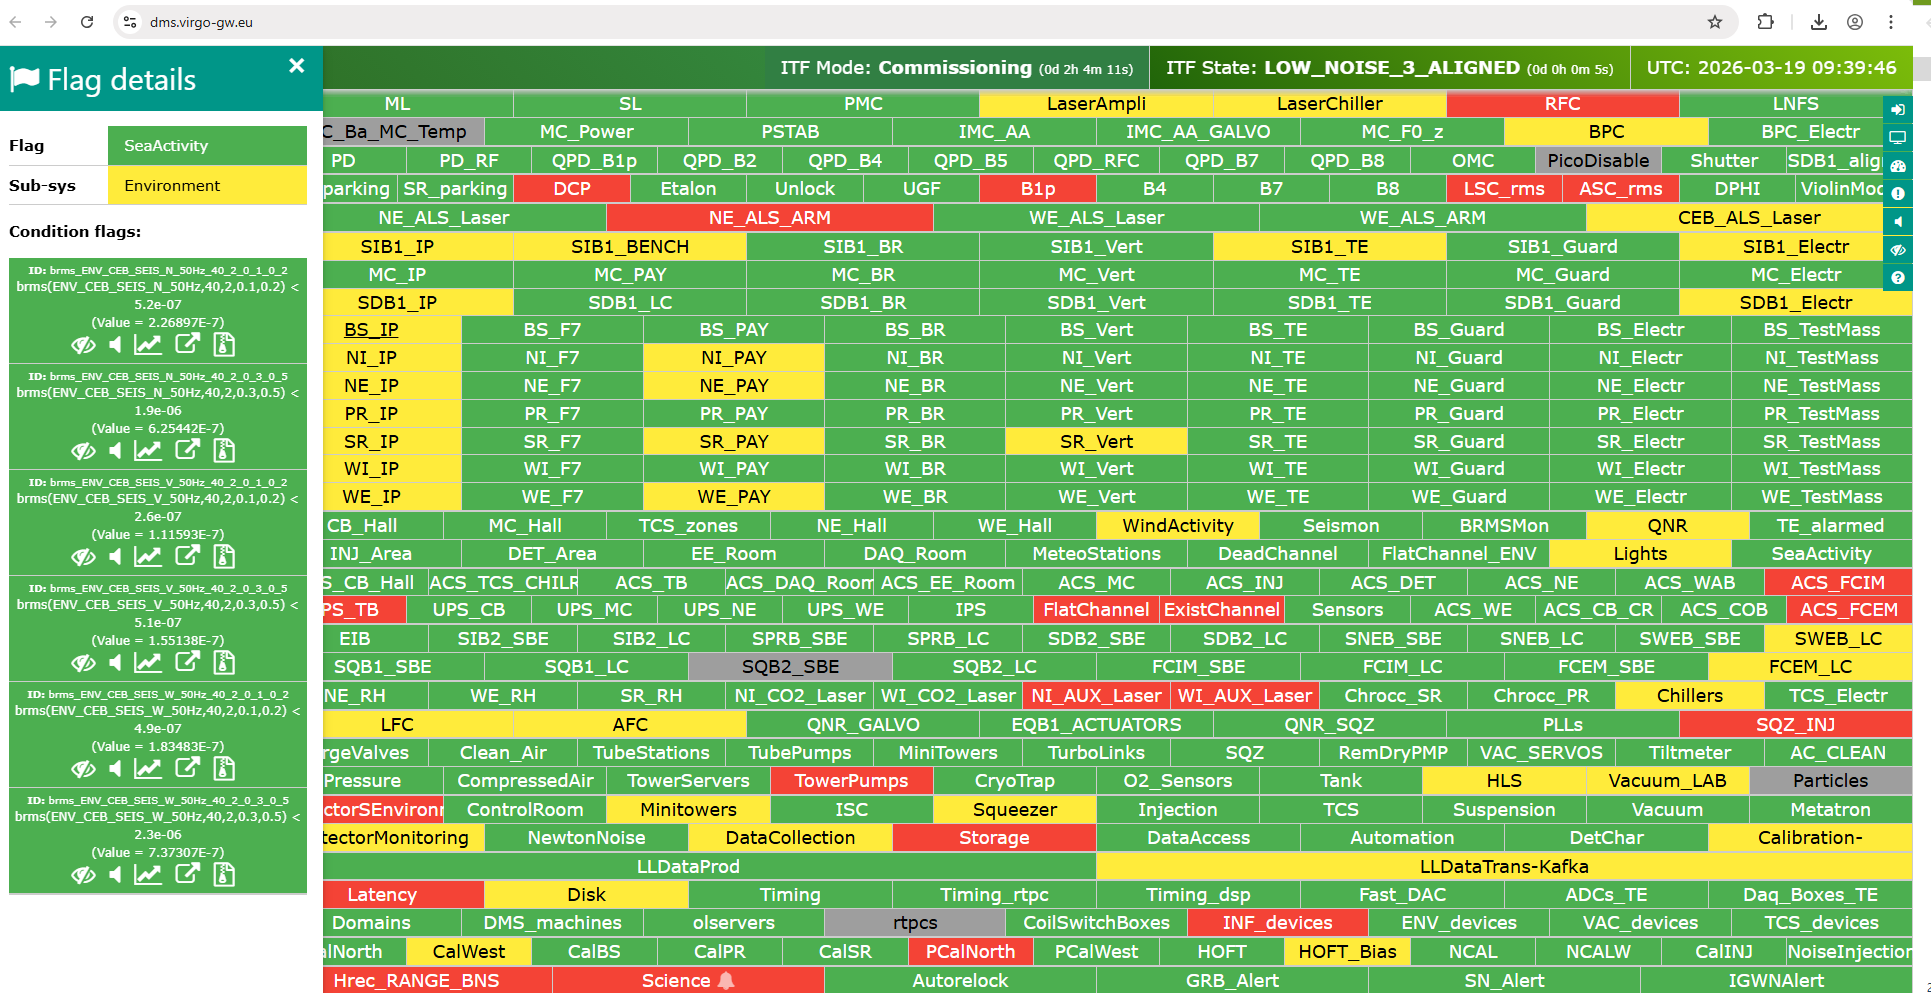
The current SeaActivity monitor of the DMS is based on the RMS of the CEB sensor computed in the range 0.1 to 1Hz (https://logbook.virgo-gw.eu/virgo/?r=38879) and the yellow and red thresholds corresponds to the 75-percentile and the 90-percentile, respectively.
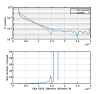
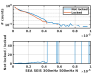
Following the requirement from Paolo and Michal of having a more detailed monitor of the various contributions, we propose to add in the DMS "SeaActivity" these channels:
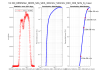
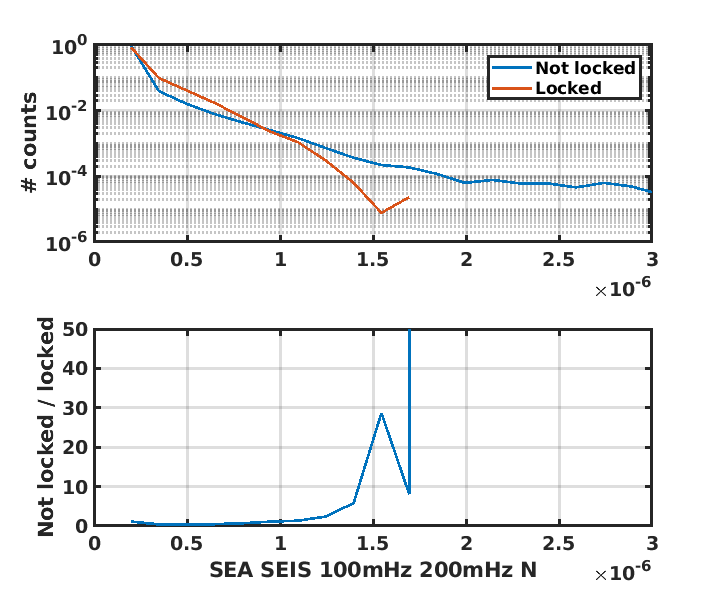
- brms(ENV_CEB_SEIS_N_50Hz,40,2,0.1,0.2) yellow threshold = 3.0e-7; red threshold = 5.2e-7
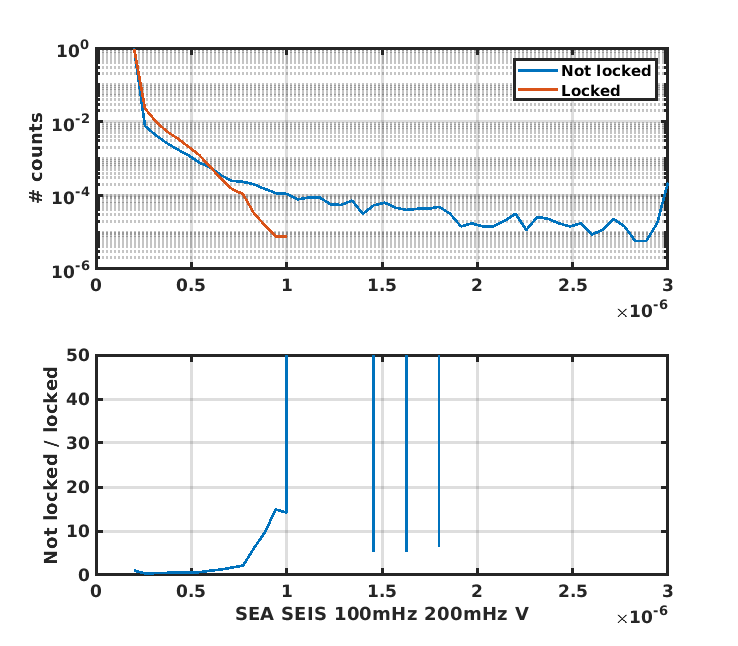
- brms(ENV_CEB_SEIS_V_50Hz,40,2,0.1,0.2) yellow threshold = 1.7e-7; red threshold = 2.6e-7
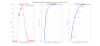
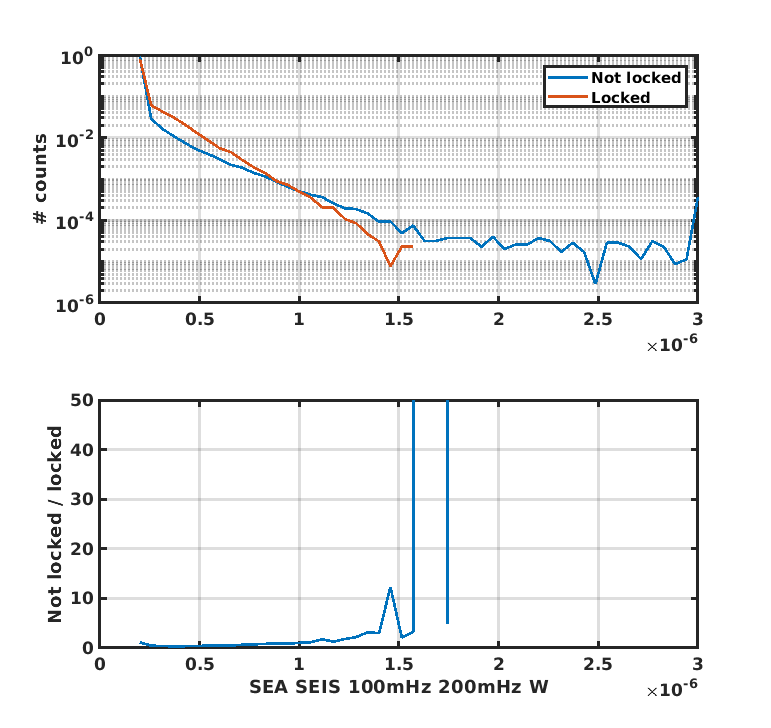
- brms(ENV_CEB_SEIS_W_50Hz,40,2,0.1,0.2) yellow threshold = 2.8e-7; red threshold = 4.9e-7
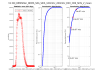
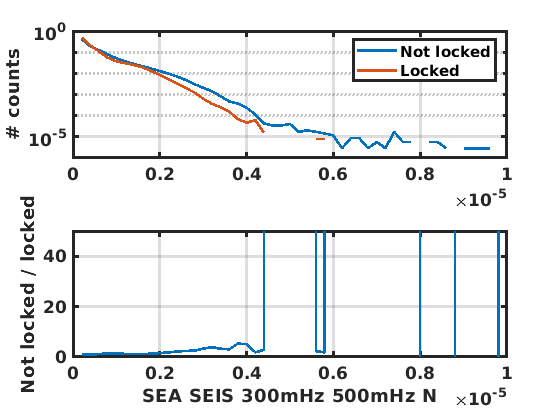
- brms(ENV_CEB_SEIS_N_50Hz,40,2,0.3,0.5) yellow threshold = 1.2e-6; red threshold = 1.9e-6
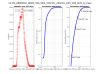
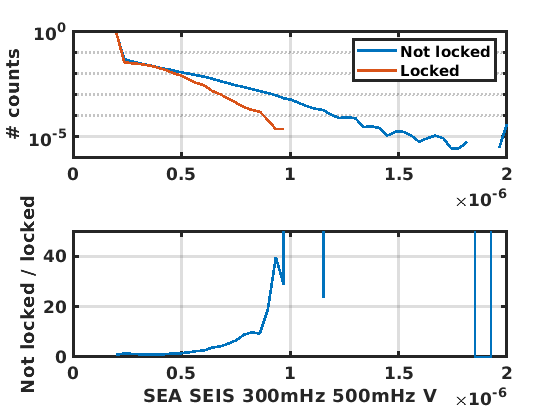
- brms(ENV_CEB_SEIS_V_50Hz,40,2,0.3,0.5) yellow threshold = 3.0e-7; red threshold = 5.1e-7
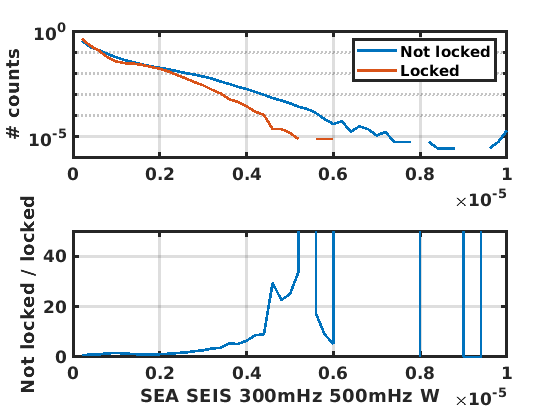
- brms(ENV_CEB_SEIS_W_50Hz,40,2,0.3,0.5) yellow threshold = 1.4e-6; red threshold = 2.3e-6
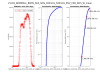
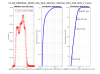
The threshold values correspond to the 75th percentile (yellow) and 90th (red) computed over the last 2 yrs statistics: See Figures from 3 to 8.

