Some comments on the test involving the opening of the valves in the DET laboratory are reported below. The main actions performed during the test are summarized as follows:
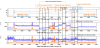
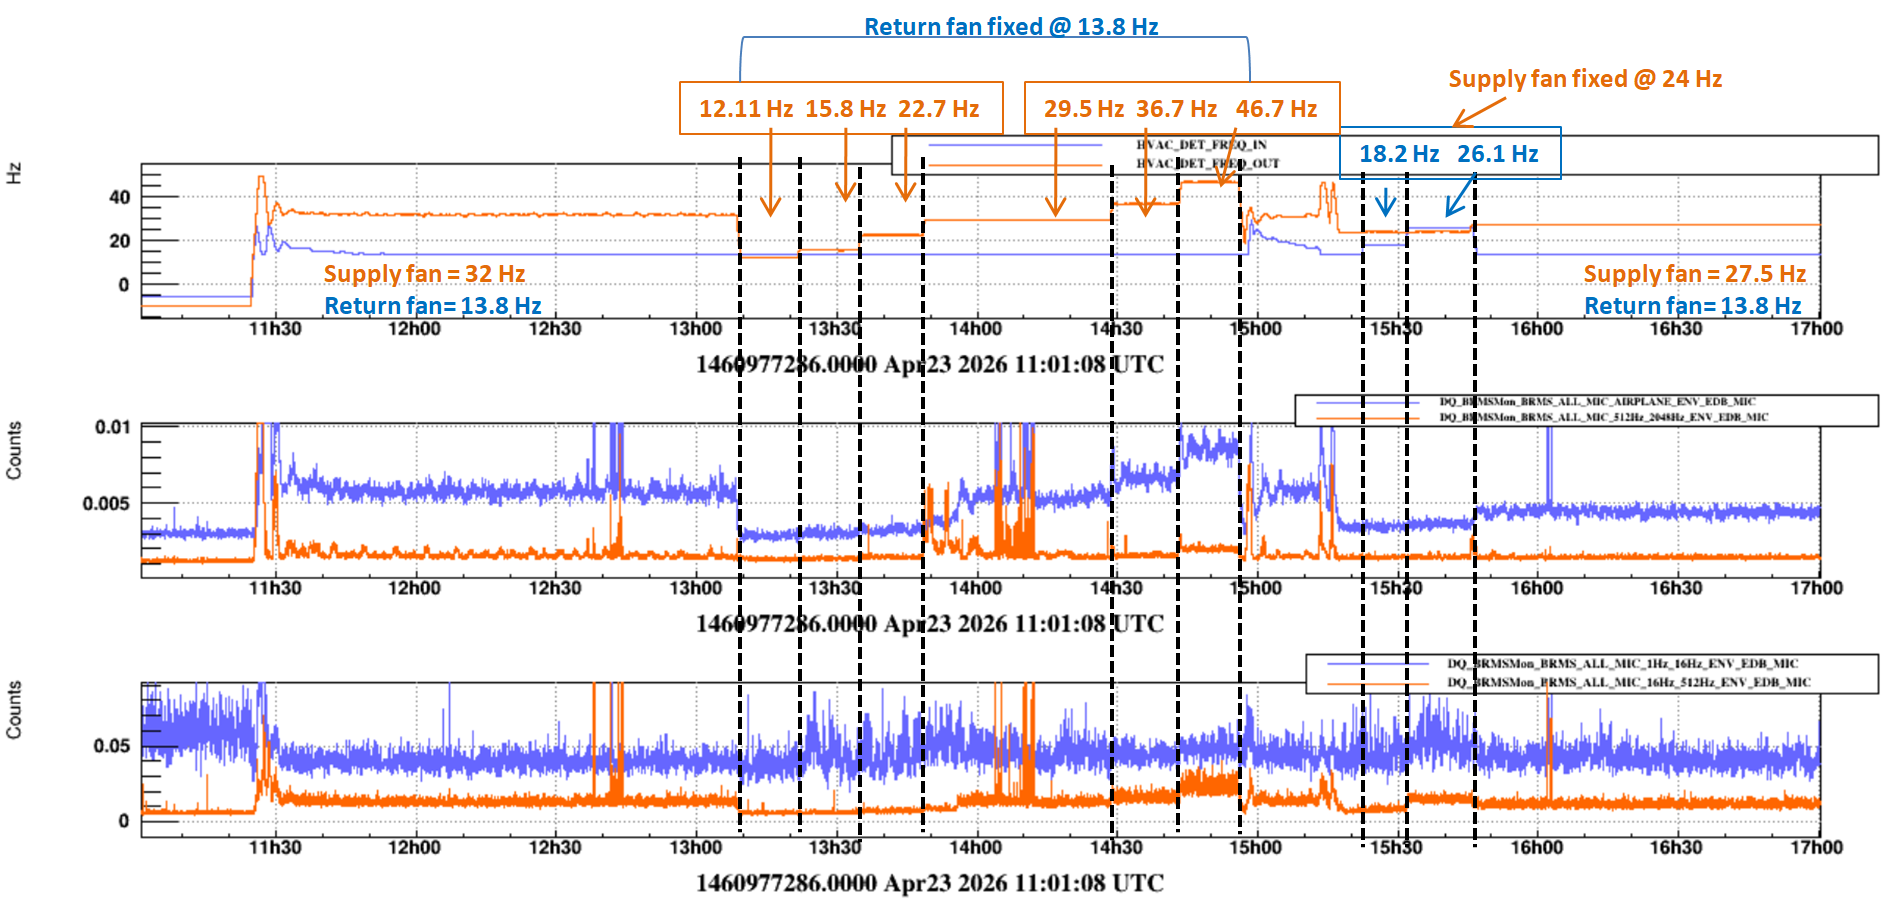
- The AHU operating mode was changed from automatic to manual. In this configuration, the supply and return air fan speeds were fixed at values of 27.4 Hz and 13.8 Hz, respectively.
- All supply and return air distribution valves were switched from automatic mode, corresponding to the specific openings reported in Table of elog 68181, to a fixed opening of 5%.
- Additional tests were performed by varying the opening percentage only for the valves serving the Mini-Tower Area A (DET area), while the remaining valves were kept fixed at 5% opening and the fan frequencies were maintained at fixed values.
- At the end of the test, all valves and the AHU were restored to automatic operation.
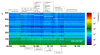
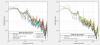
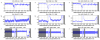
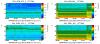
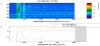
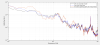
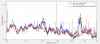
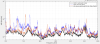
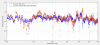
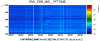
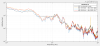
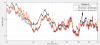
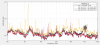
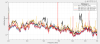
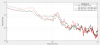
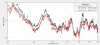
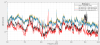
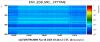
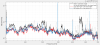
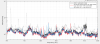
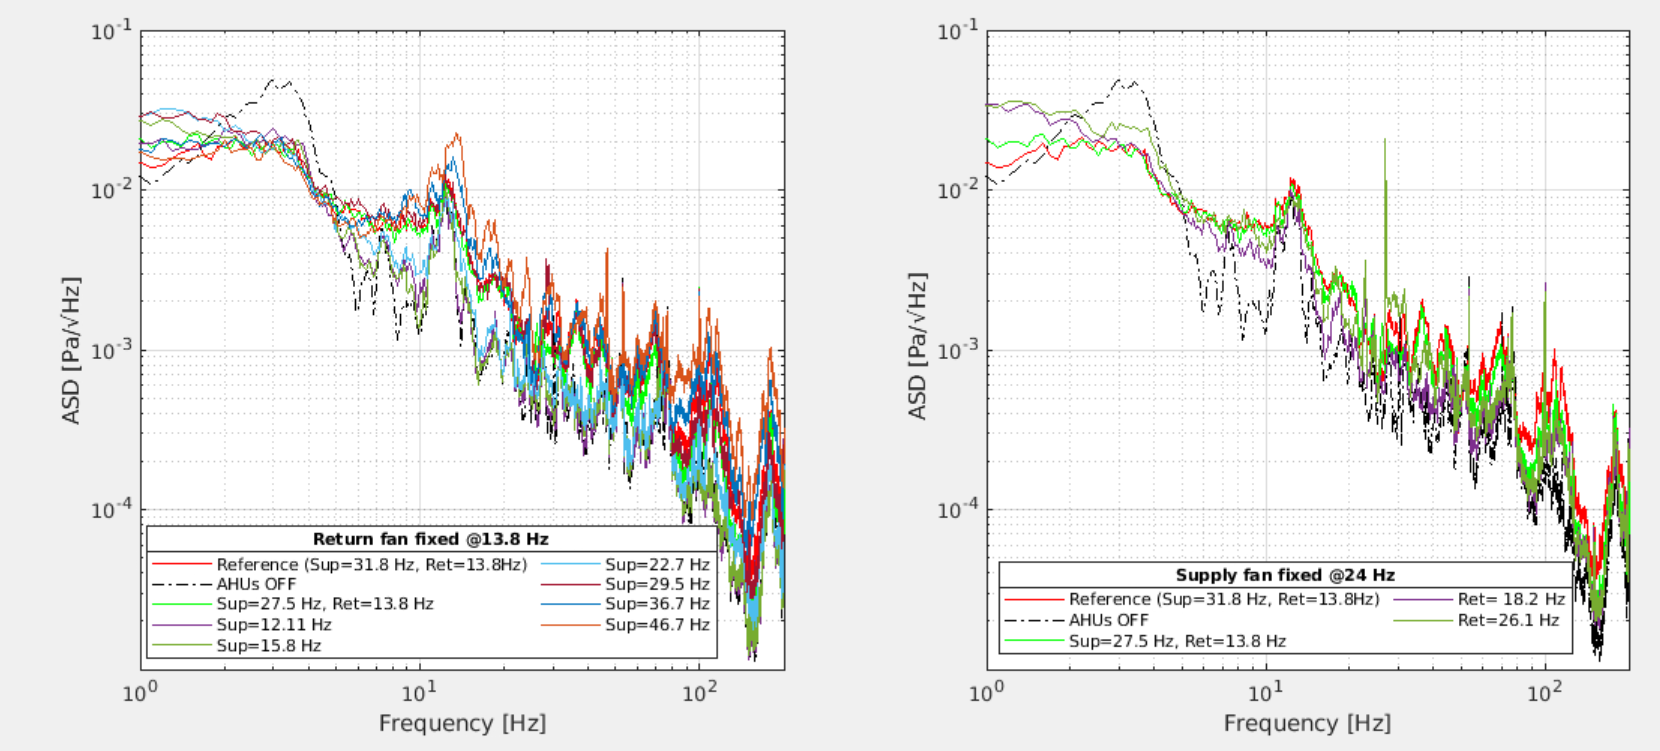
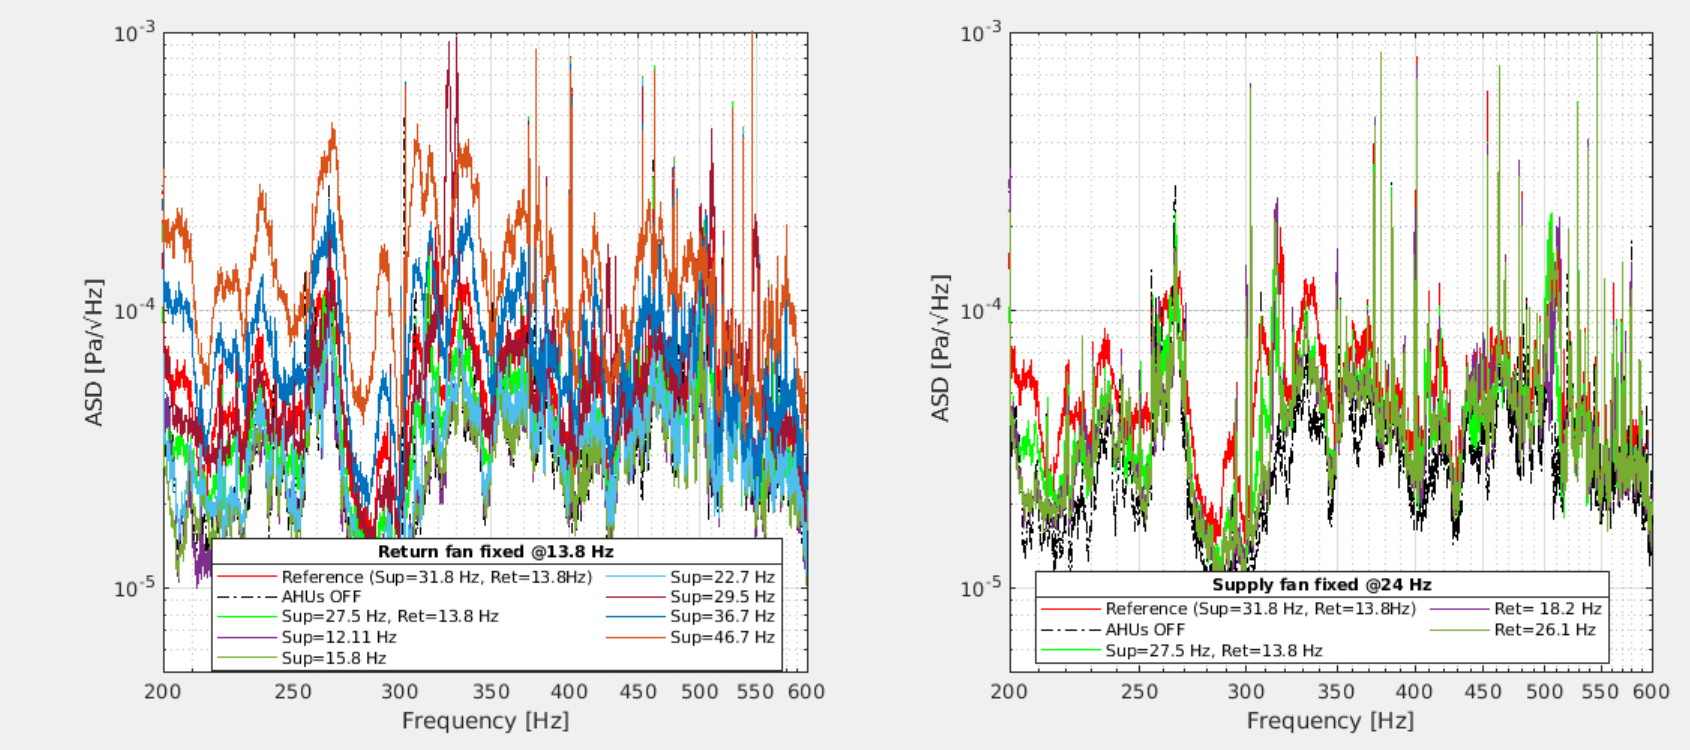
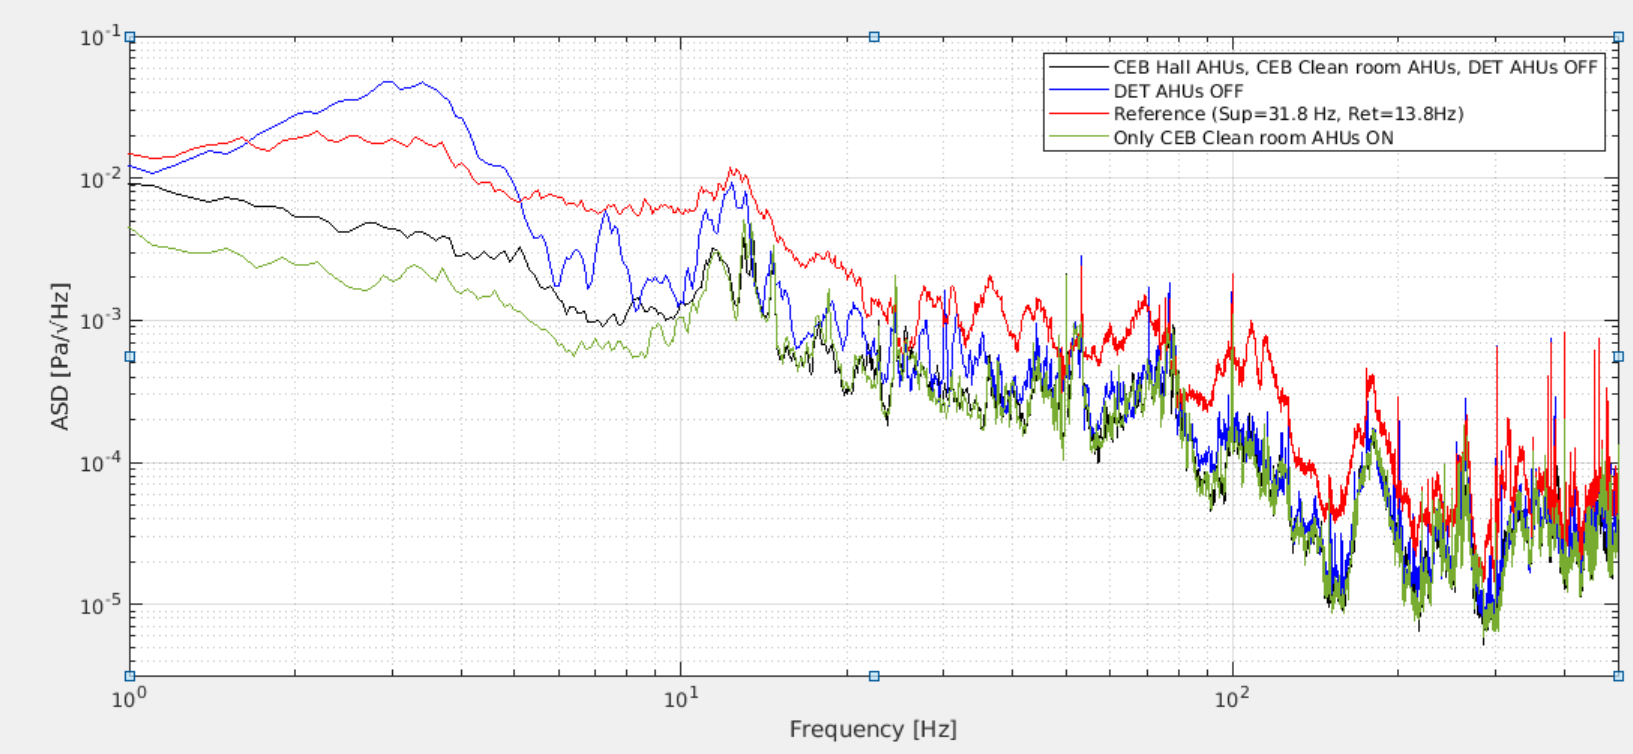
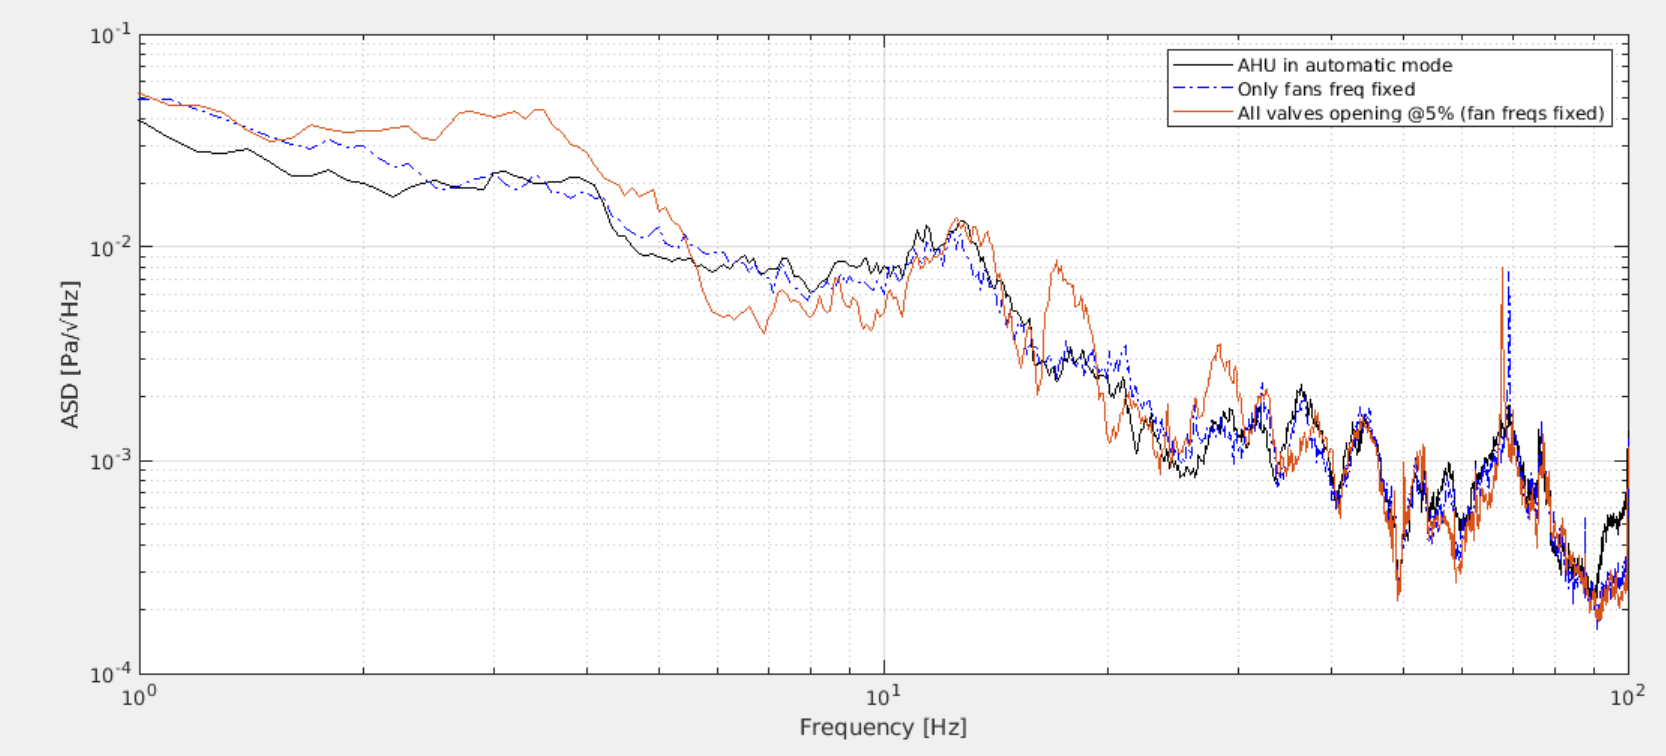
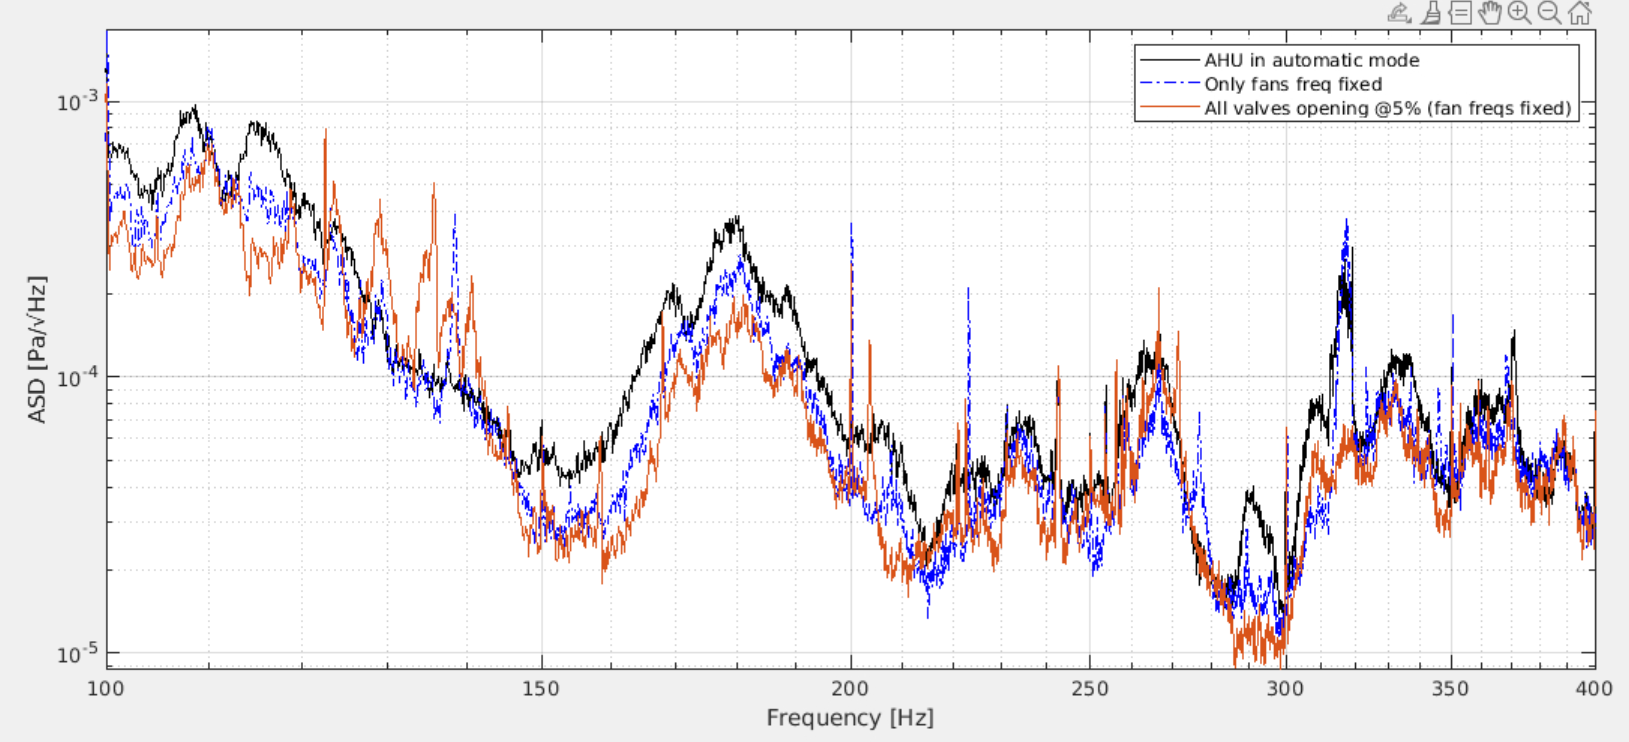
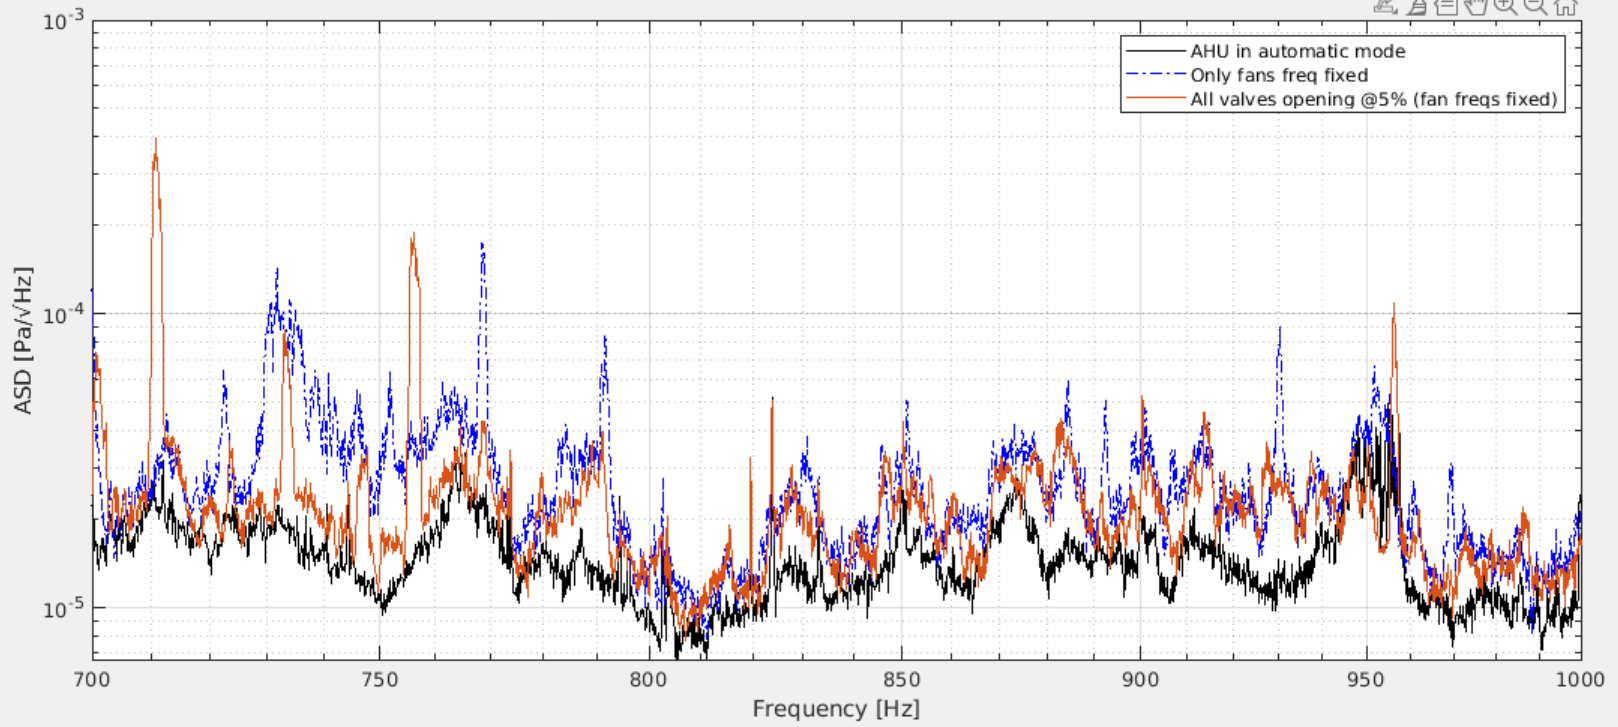
Figures 1, 2, 3, 4 show zoomed views of the acoustic spectra measured by the microphone ENV_EDB_MIC during the transition from automatic operation to fixed fan frequencies and valve openings. The frequency ranges displayed are: Figure 1 (1–100 Hz), Figure 2 (100–400 Hz), Figure 3 (400–700 Hz), and Figure 4 (700–1000 Hz).
The colored curves correspond to three different operating configurations of the AHU system:
- black curve: supply and return fans, as well as all valves, operating in automatic mode.
- red curve: supply and return fan frequencies fixed at 27.4 Hz and 13.8 Hz, respectively, while all valves remained in automatic mode.
- blue curve: same fan configuration as the red curve, with all supply and return air distribution valves additionally set to a fixed opening of 5%.
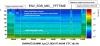
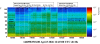
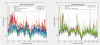
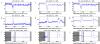
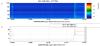
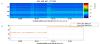
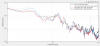
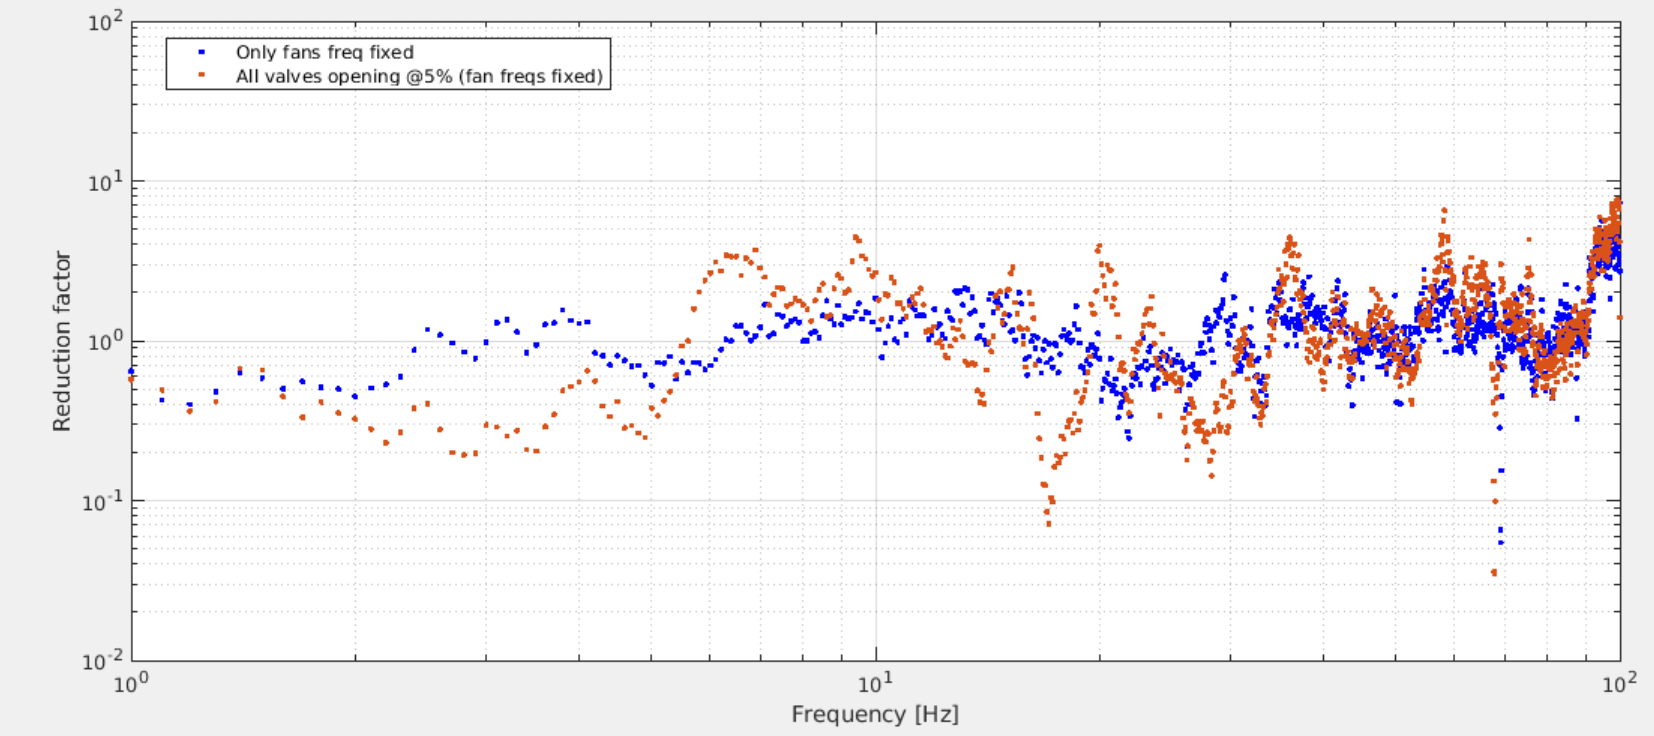
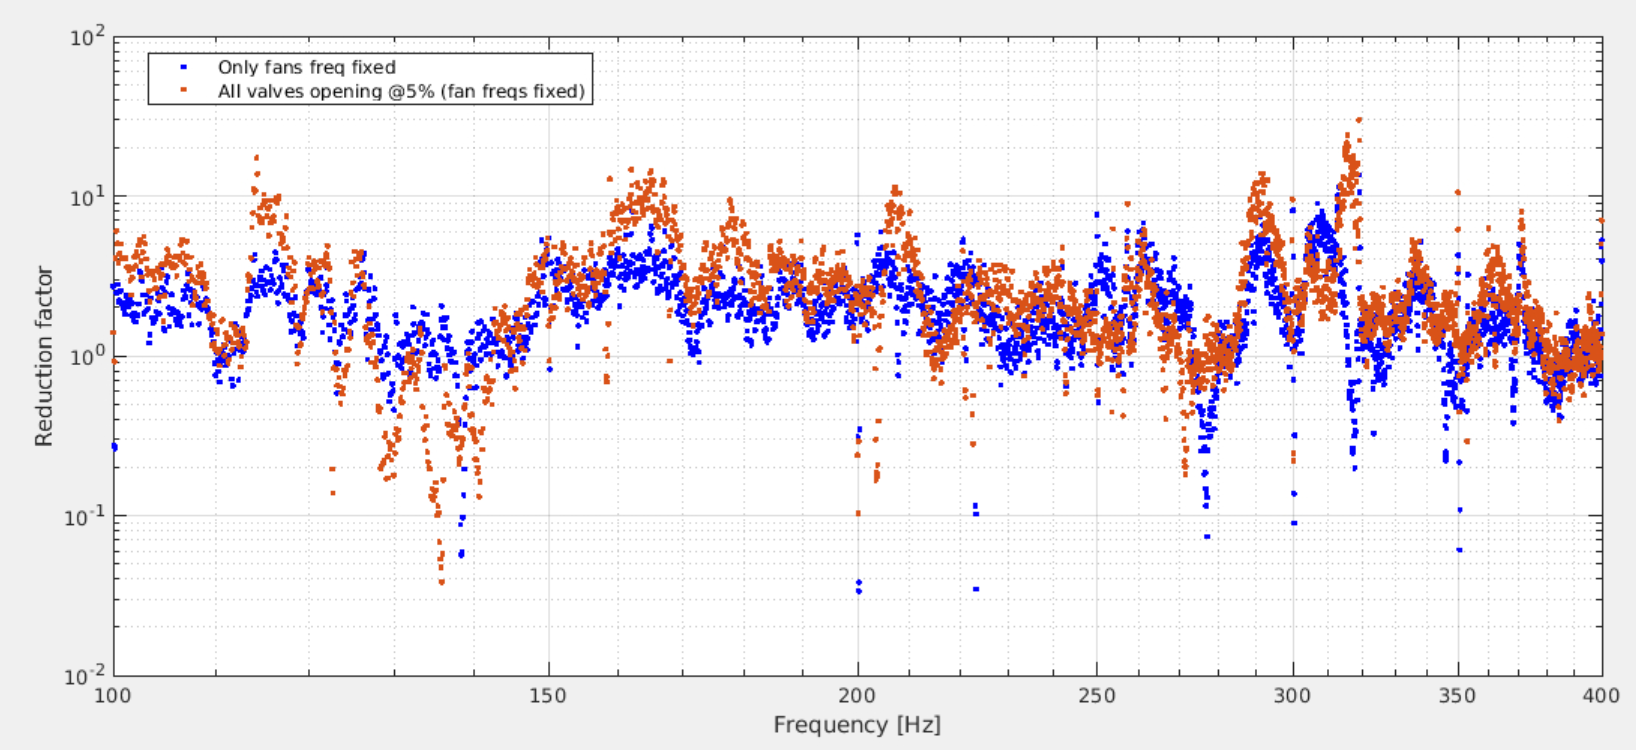
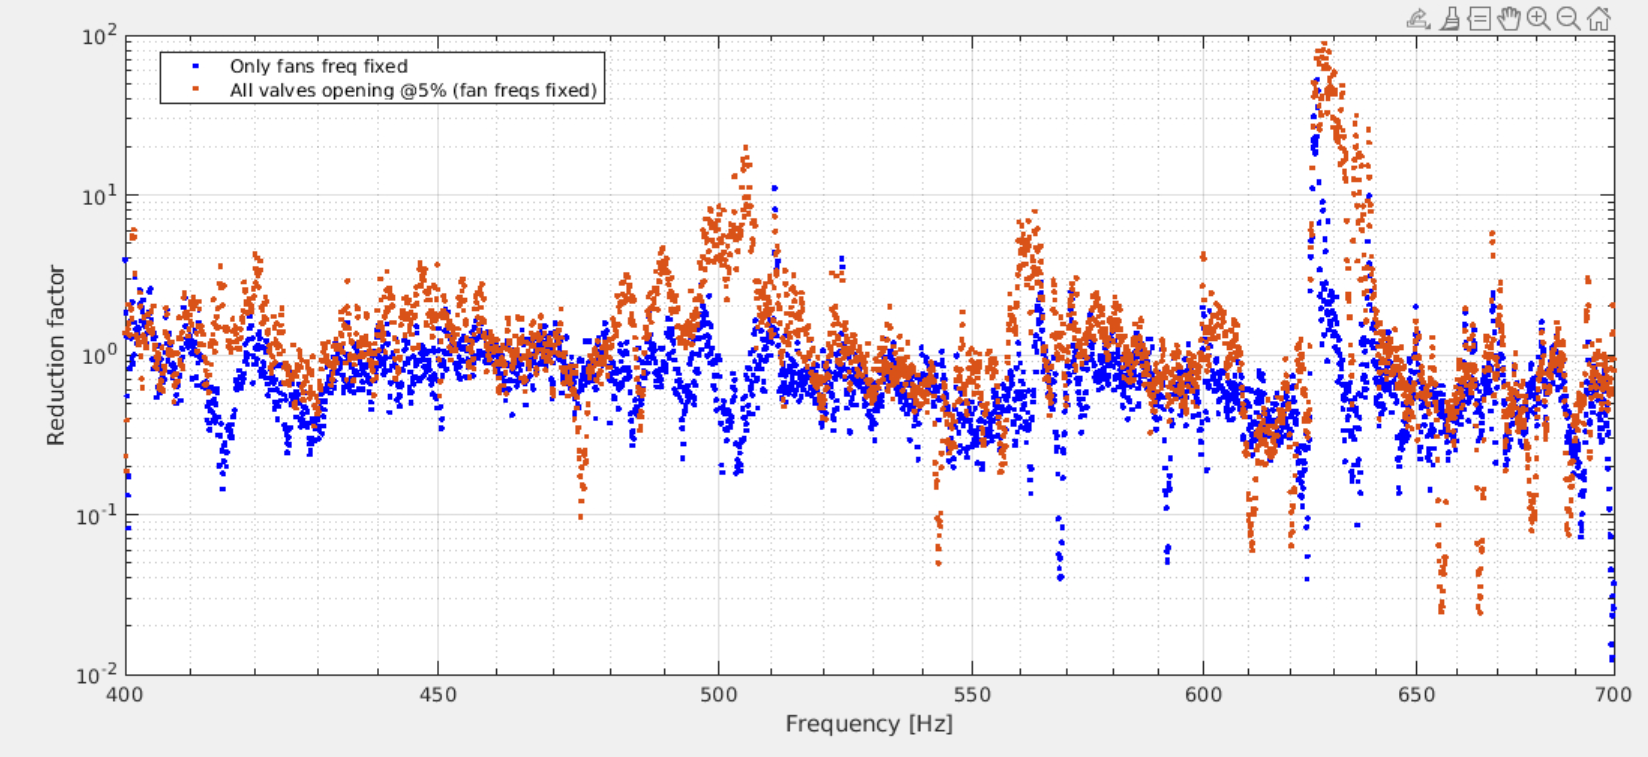
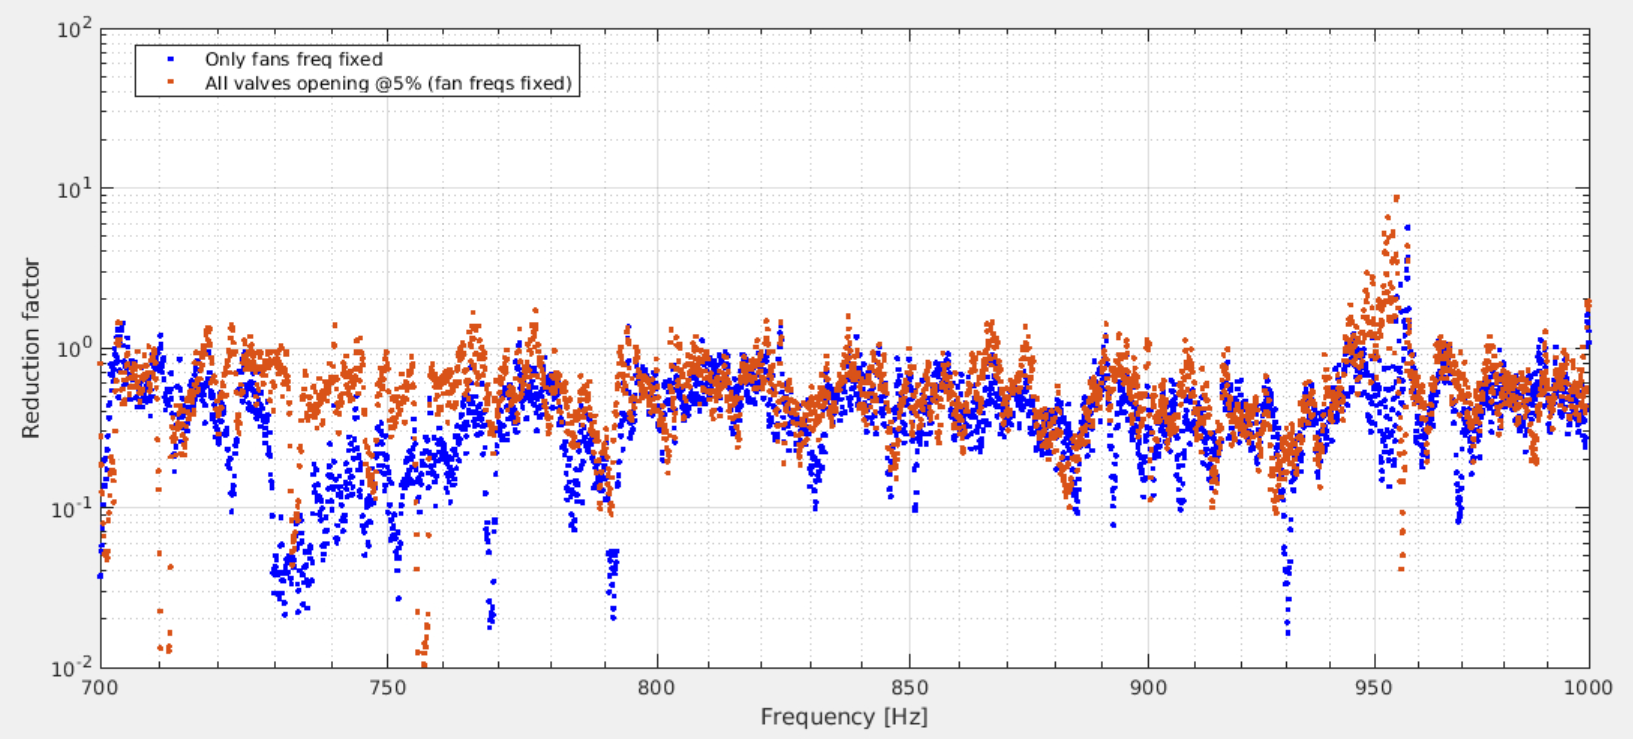
Figures 5, 6, 7, 8 report the corresponding reduction factors with respect to the reference configuration (AHU operating in automatic mode).
Overall, fixing the supply and return fan frequencies does not significantly modify the acoustic spectrum, although a moderate reduction is observed in several frequency bands. A more pronounced effect is obtained when all supply and return air distribution valves are set to a fixed opening of 5%.
The ASD comparison shows a reduction of several broad acoustic structures, particularly below 400 Hz. This observation is confirmed by the reduction factor analysis, which reaches values between 2 and 5 over extended frequency regions. Above 400 Hz, the impact of the modified AHU configuration becomes less evident.
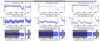
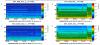
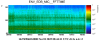
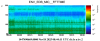
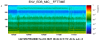
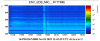
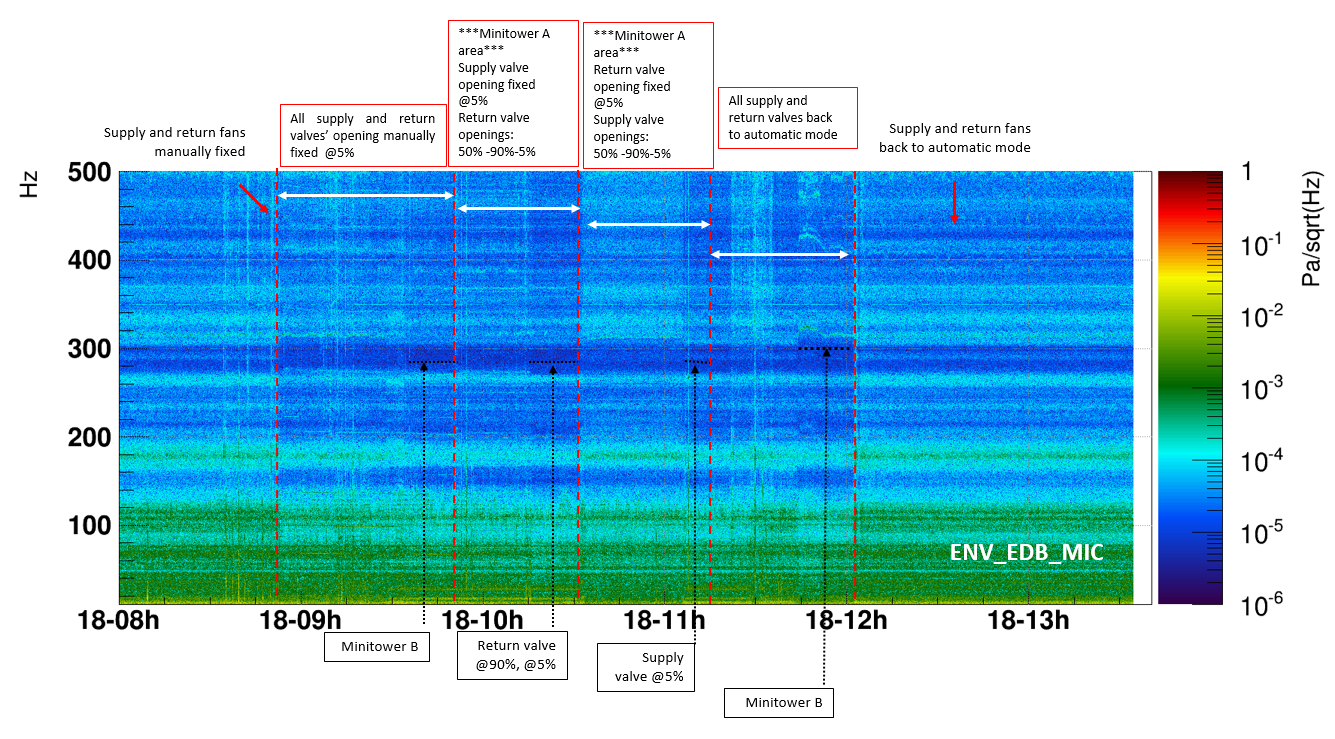
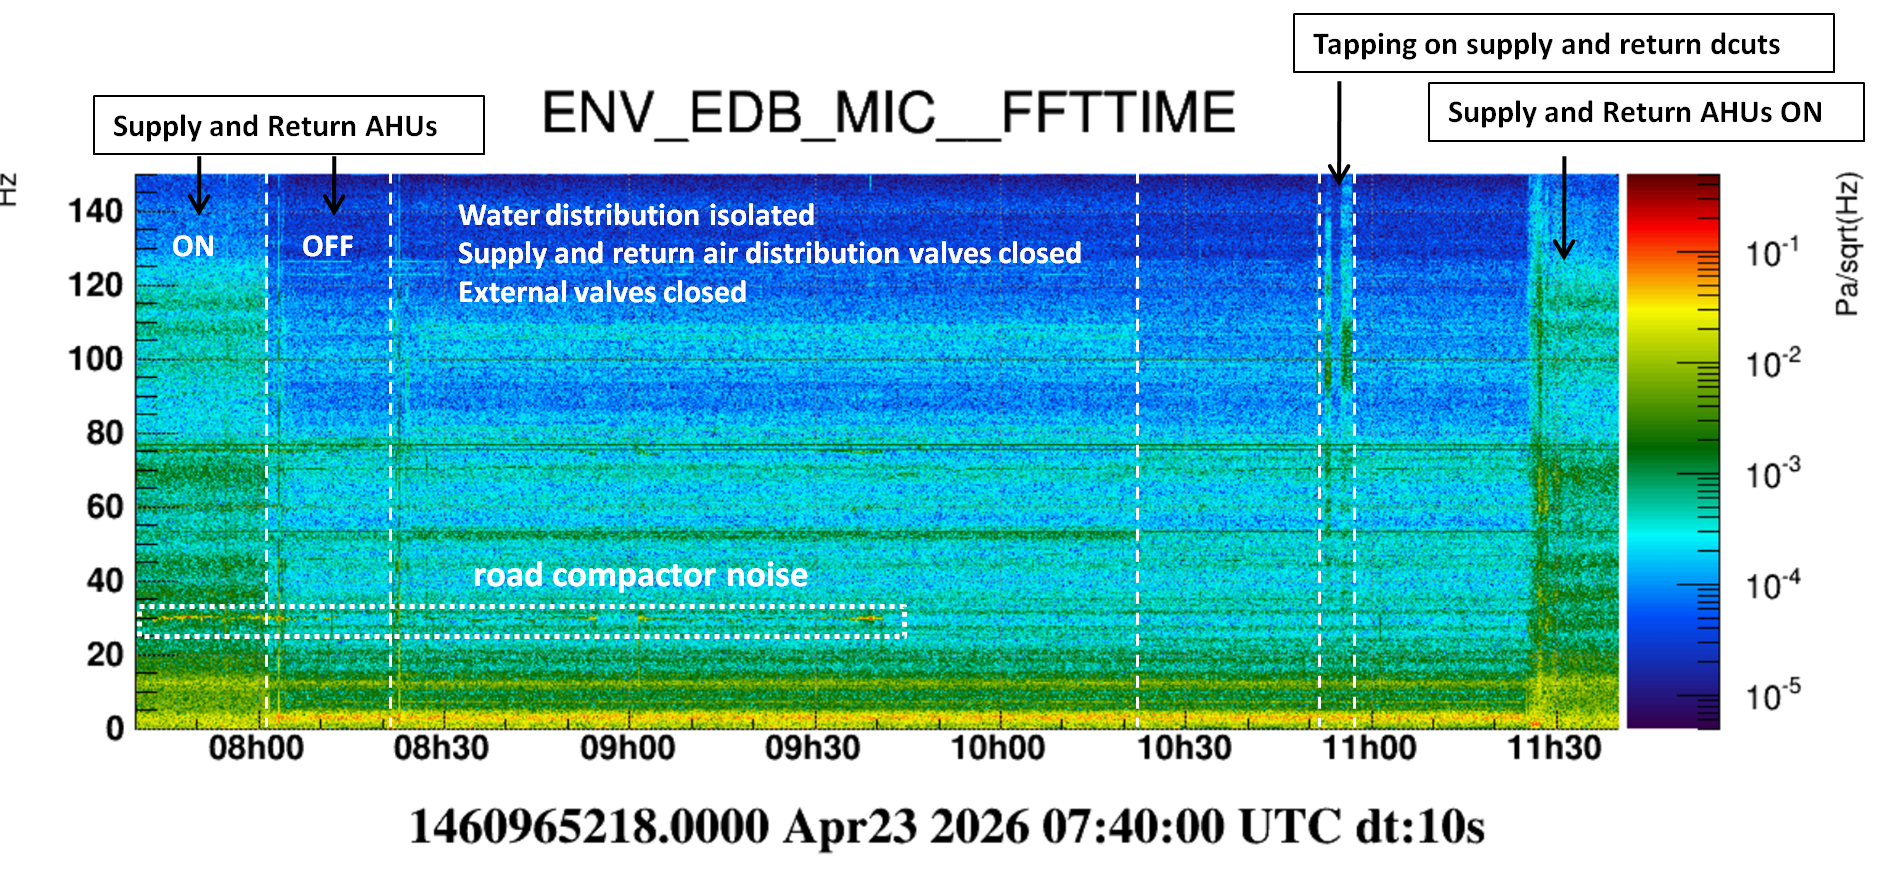
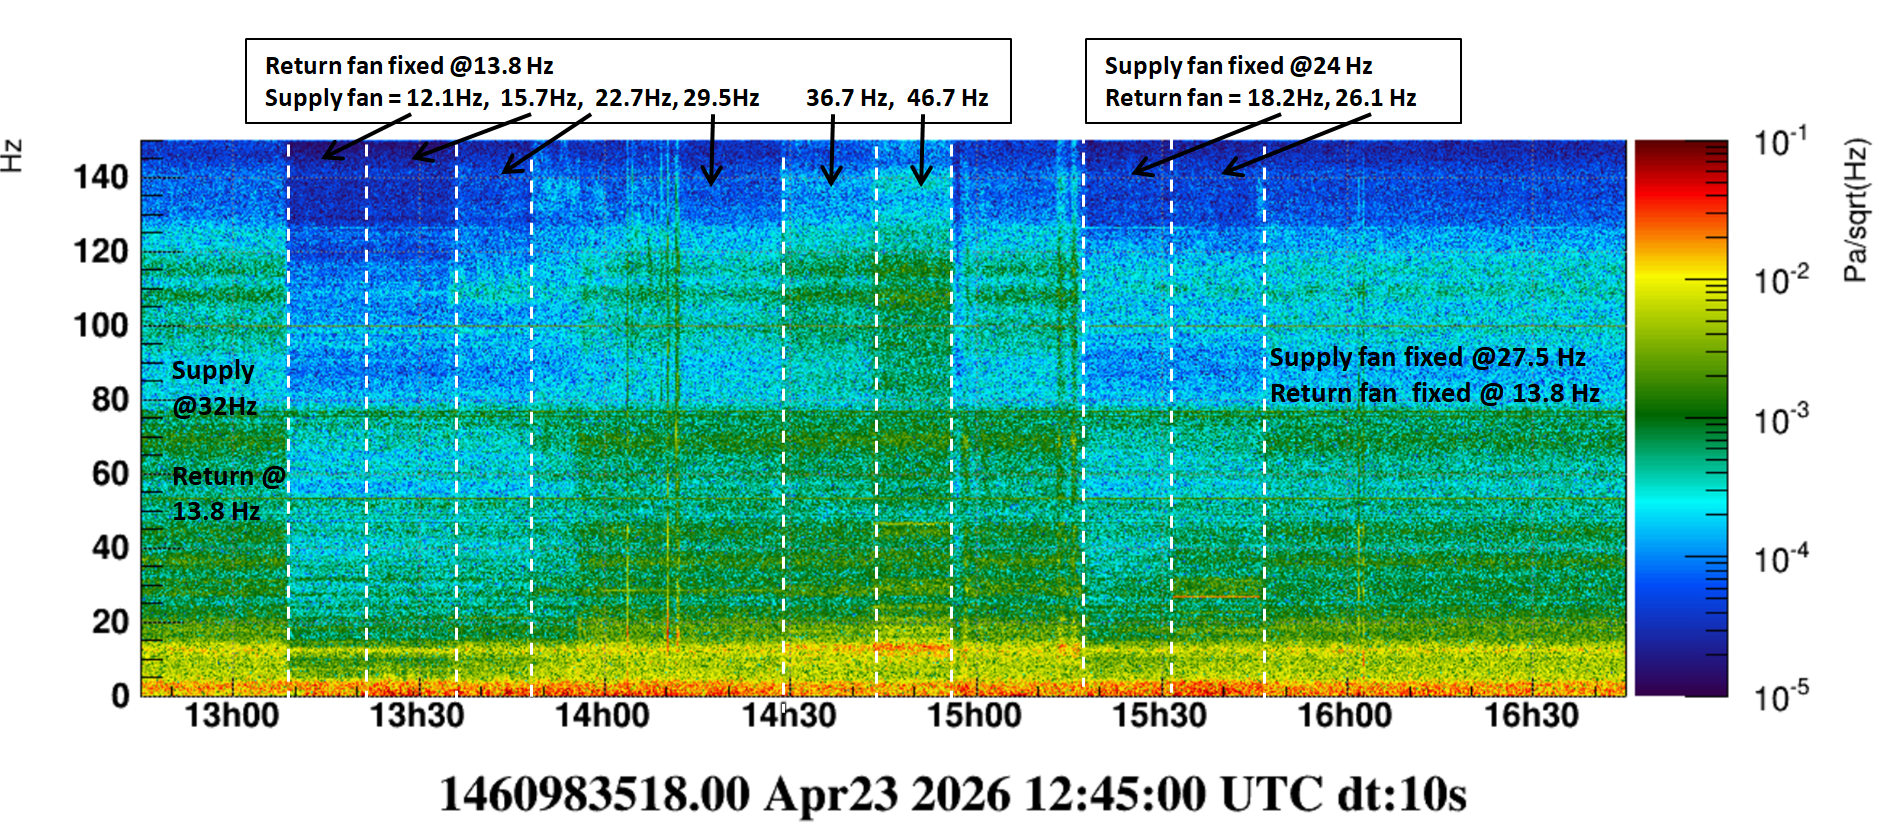
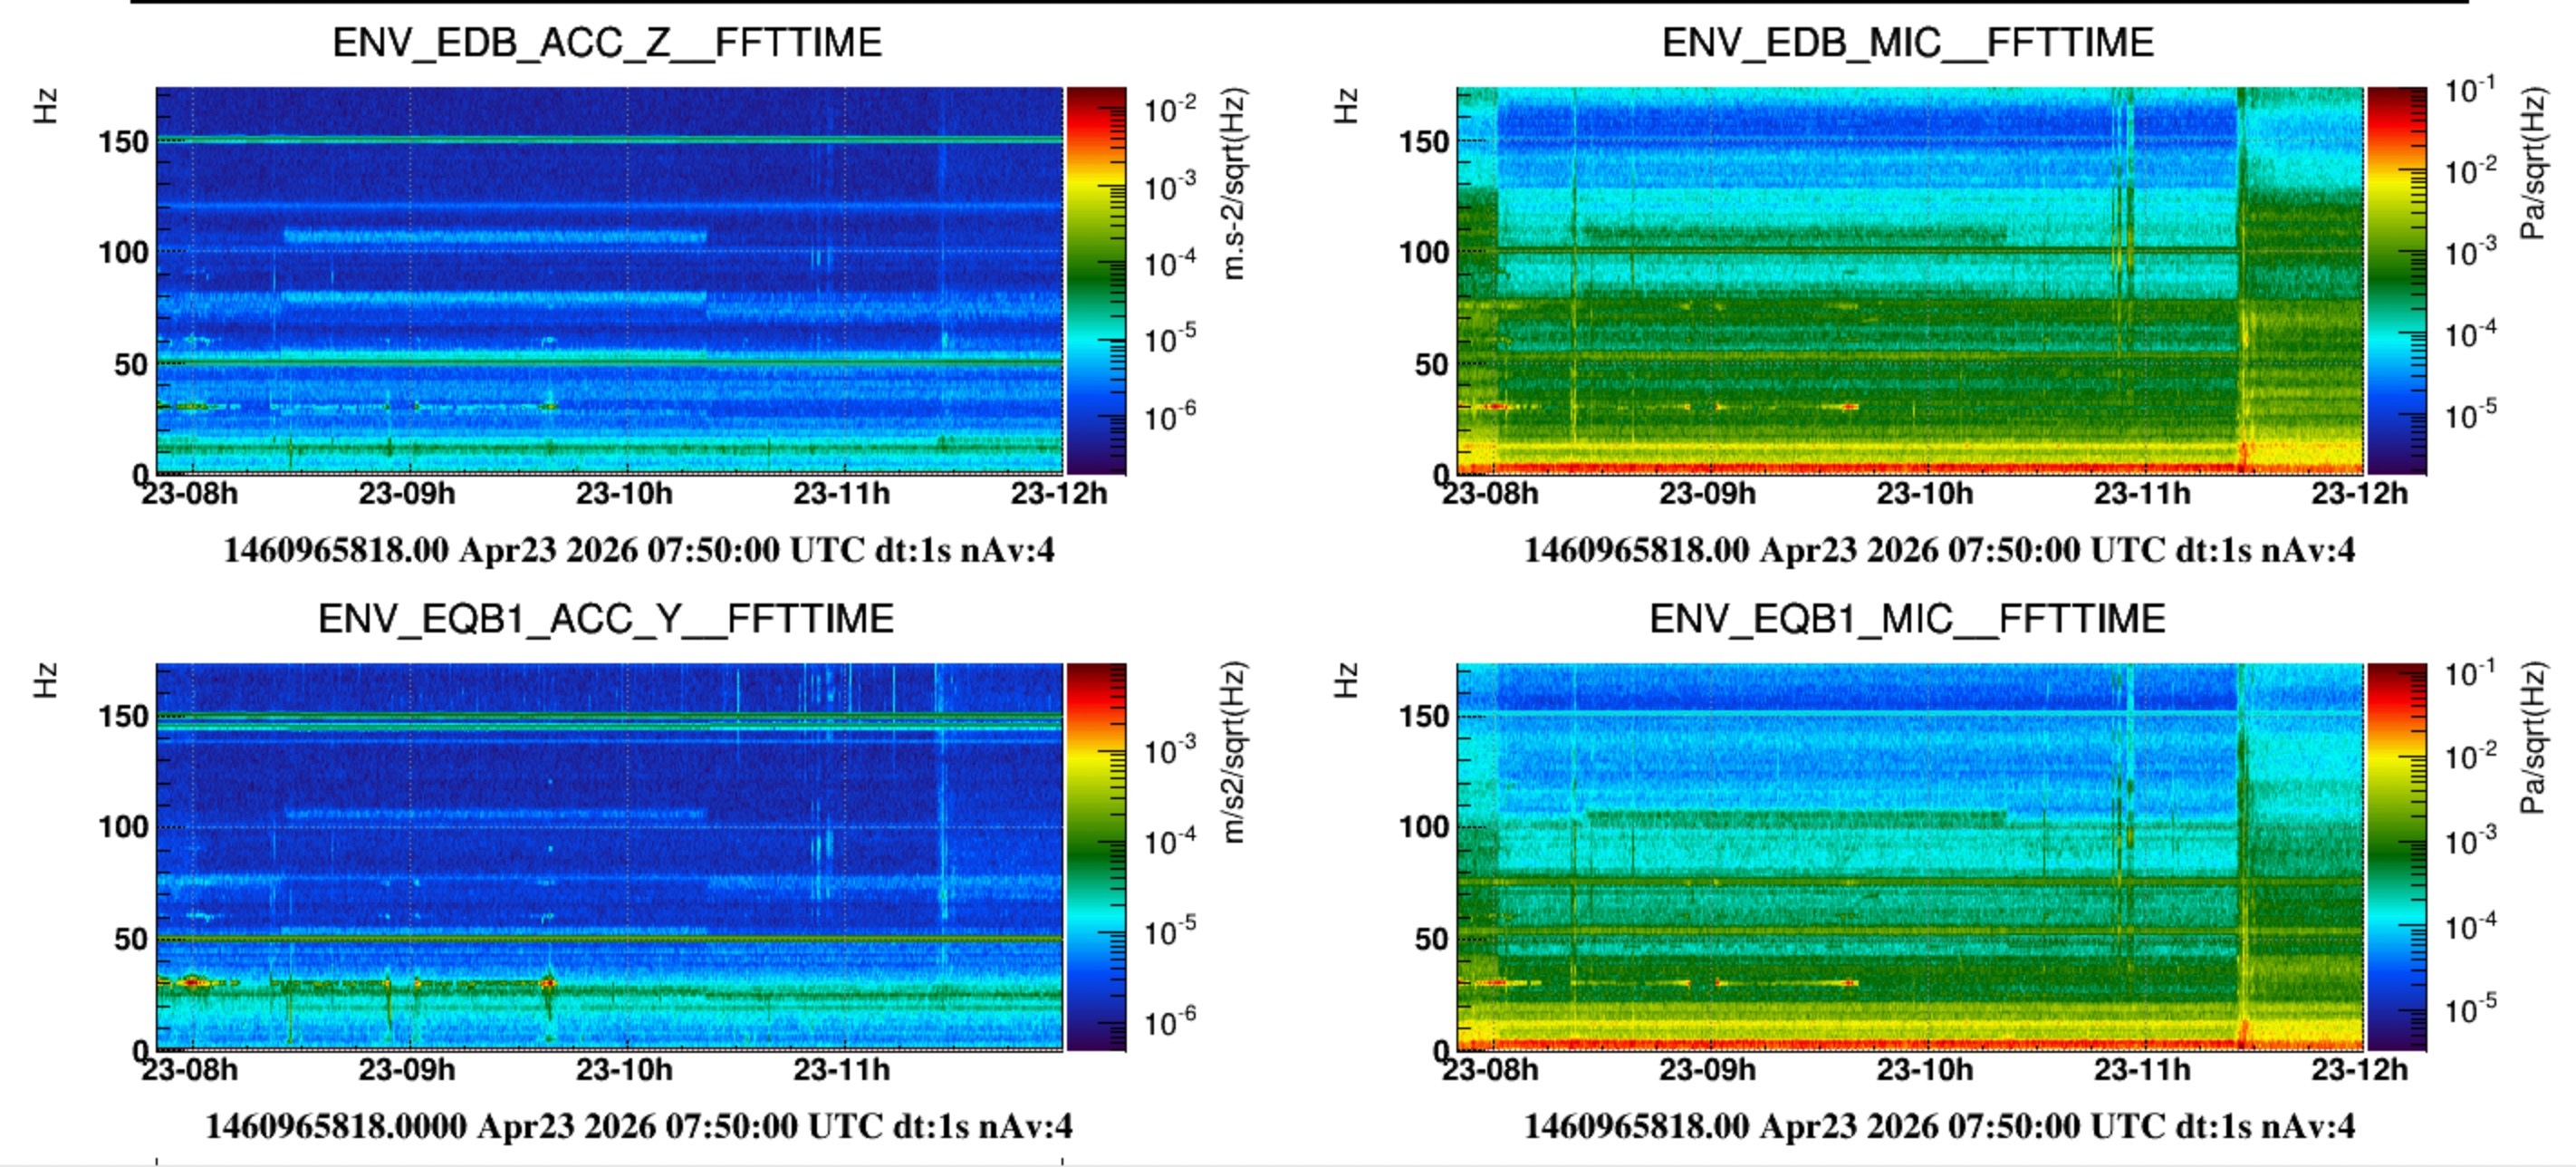
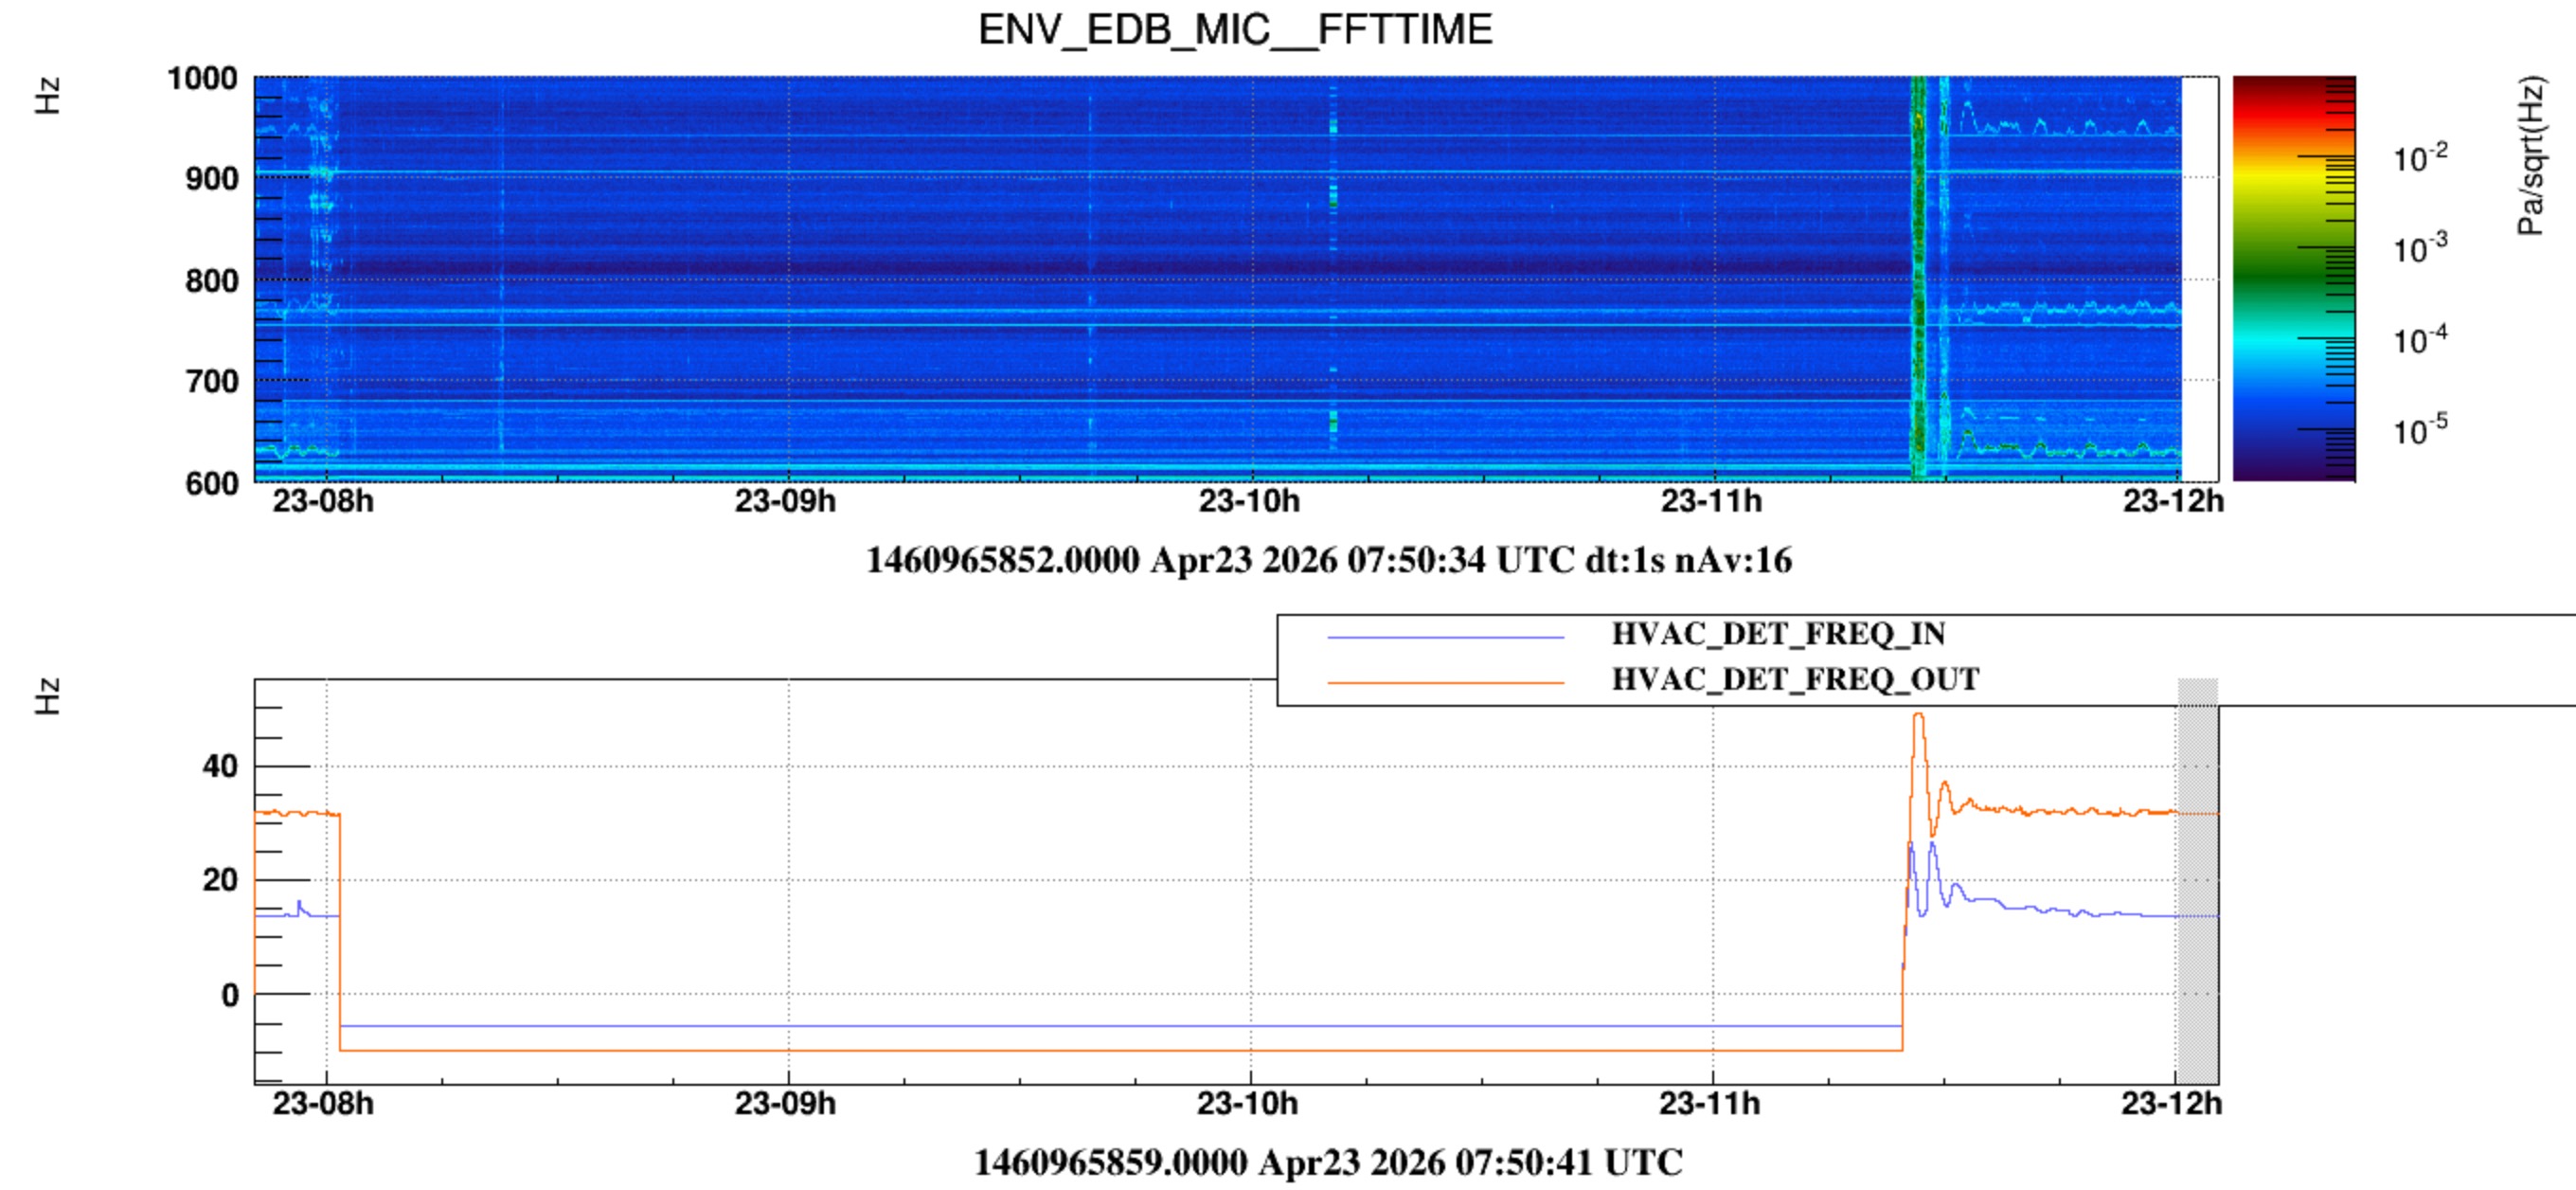
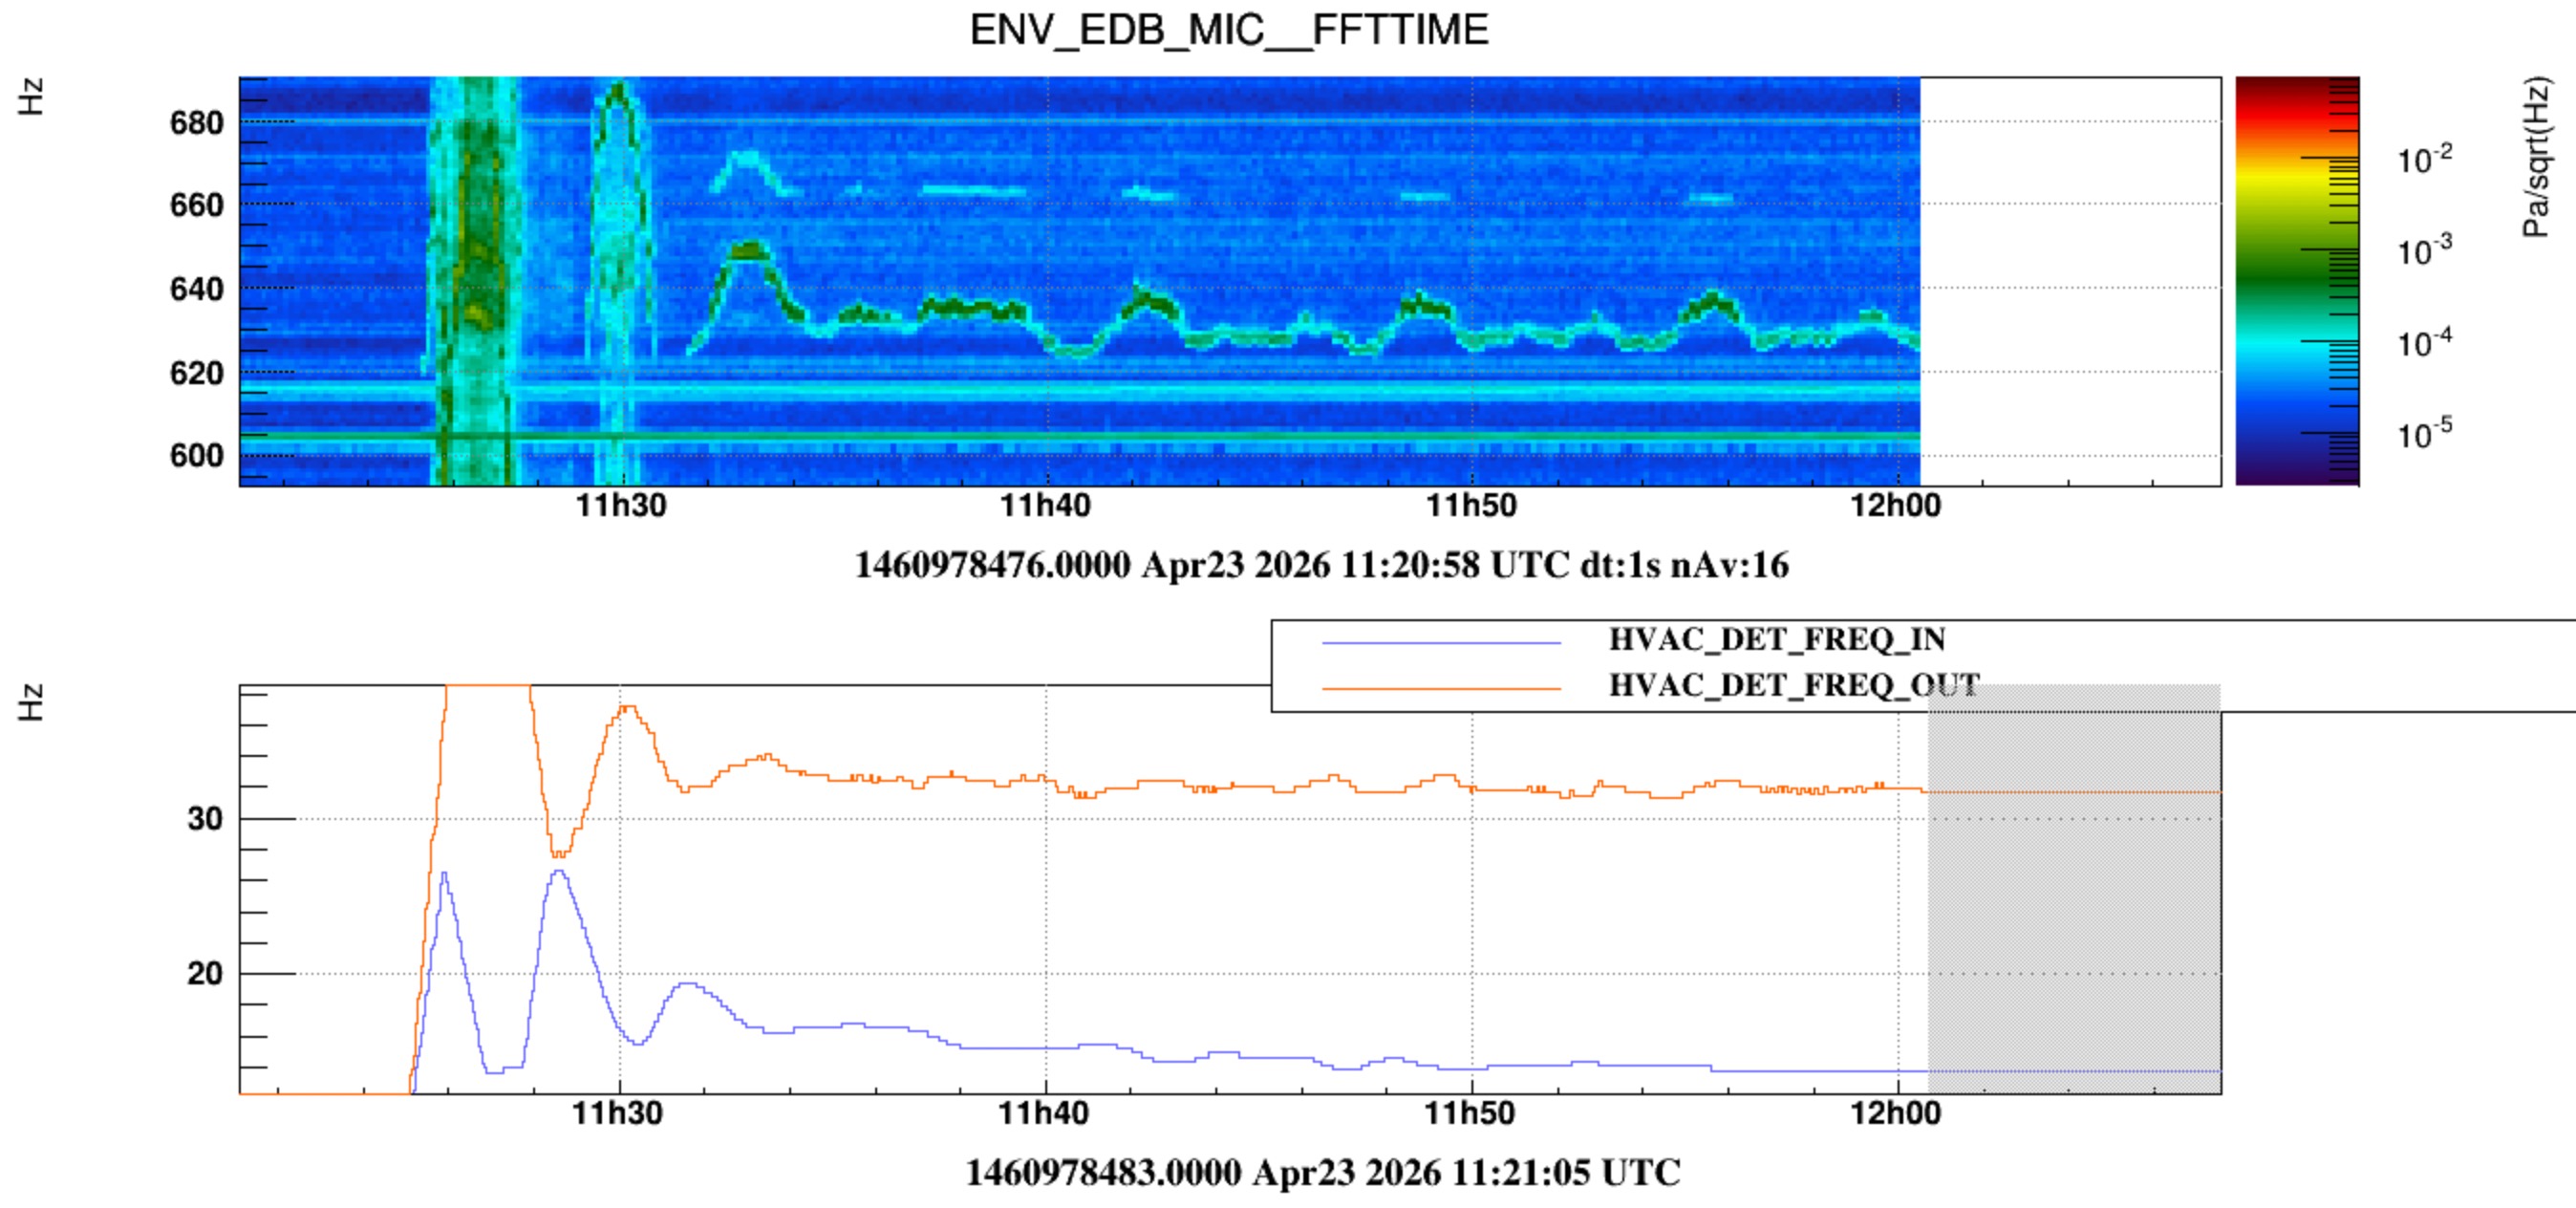
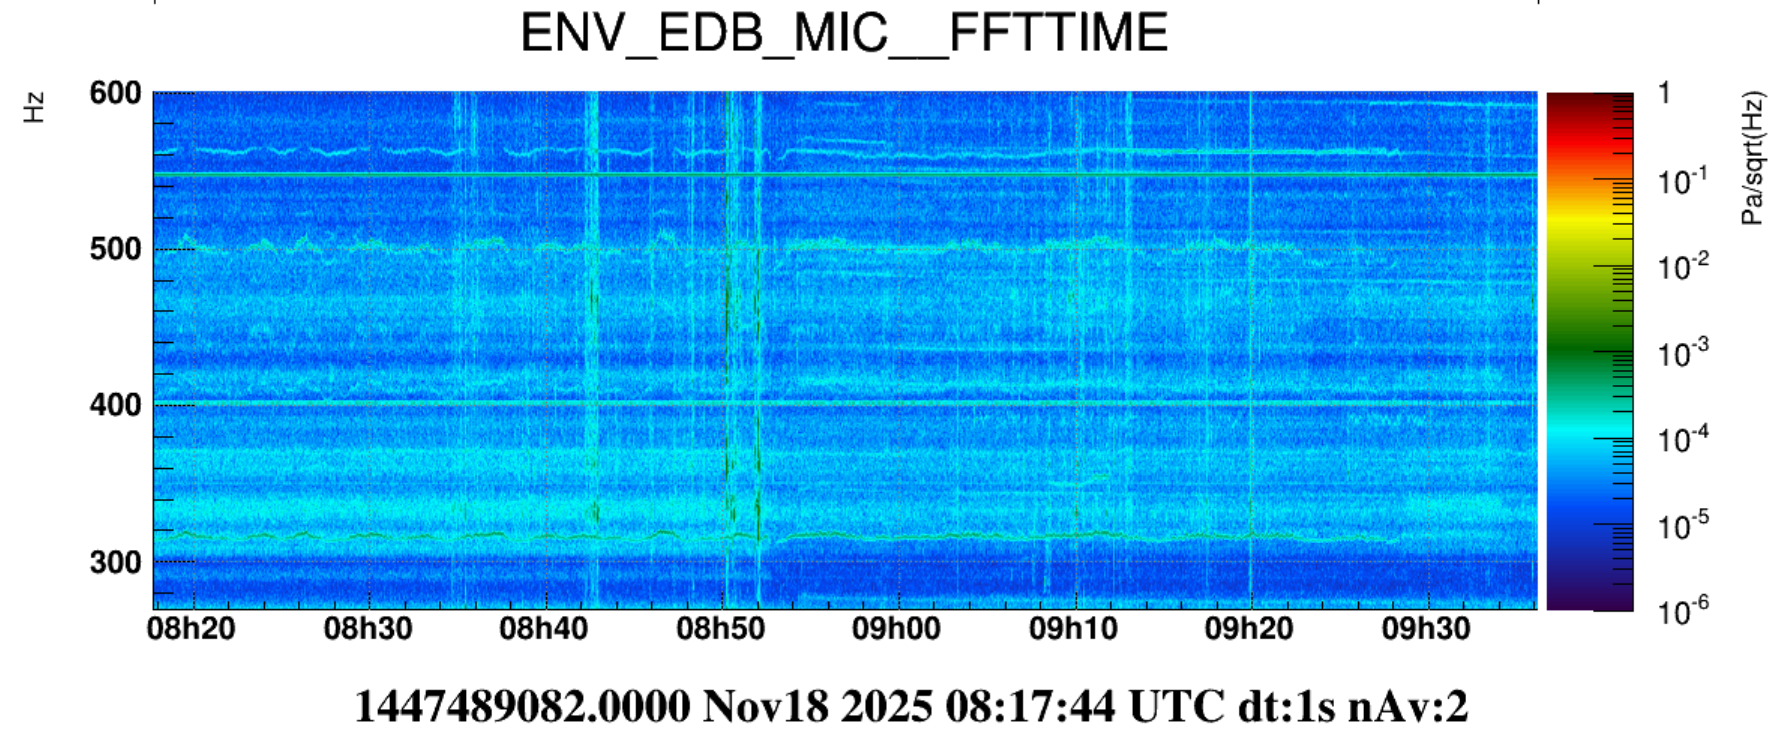
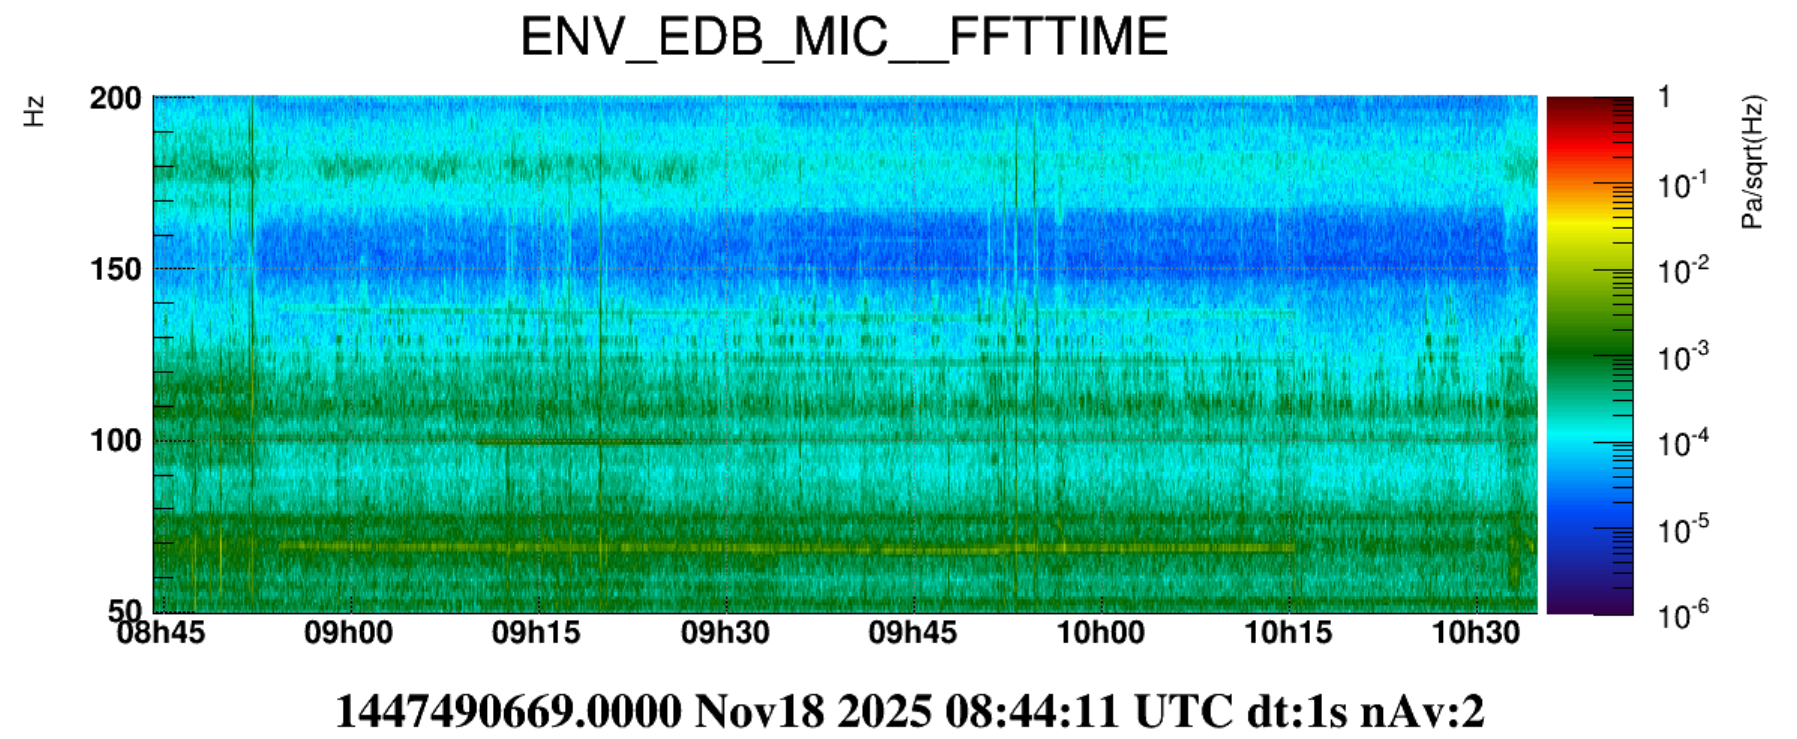
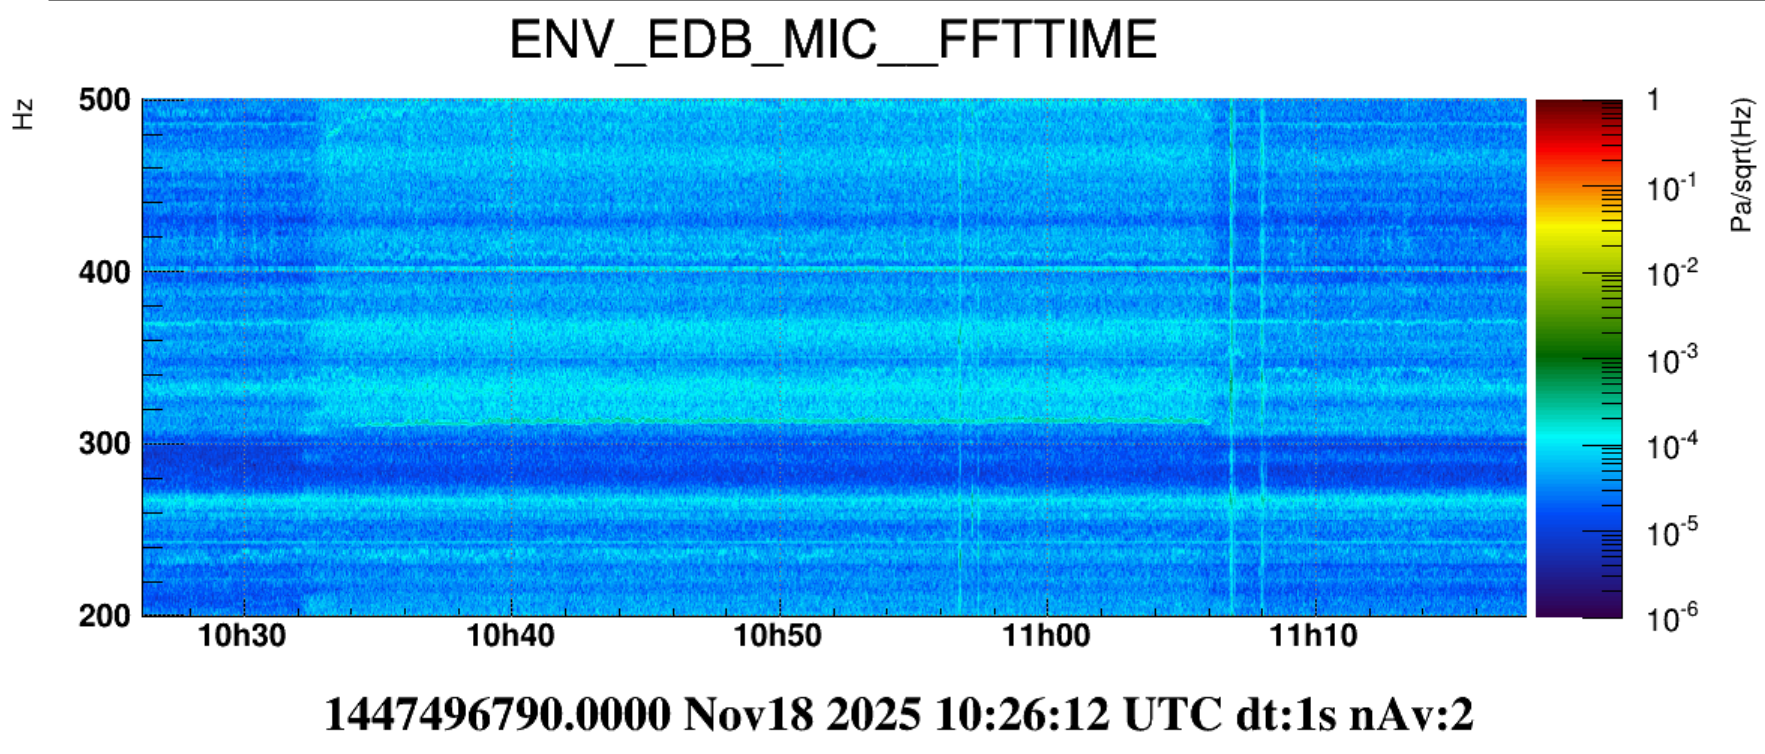
Moreover, the time-frequency maps of Figure 9 and 10, show the presence of several non-stationary spectral features above 300 Hz whose amplitude and frequency evolve throughout this part of the test. Consequently, the large reduction factors observed at specific frequencies are influenced by the temporal evolution of these spectral structures in addition to the changes introduced in the AHU operating configuration.
Overall, the results suggest that the reduction of the valve openings has an impact on the acoustic environment than fixing the fan frequencies alone, providing a measurable reduction of the acoustic noise level, particularly below 400 Hz.
**** Mini-tower A area (DET area) ****
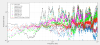
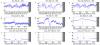
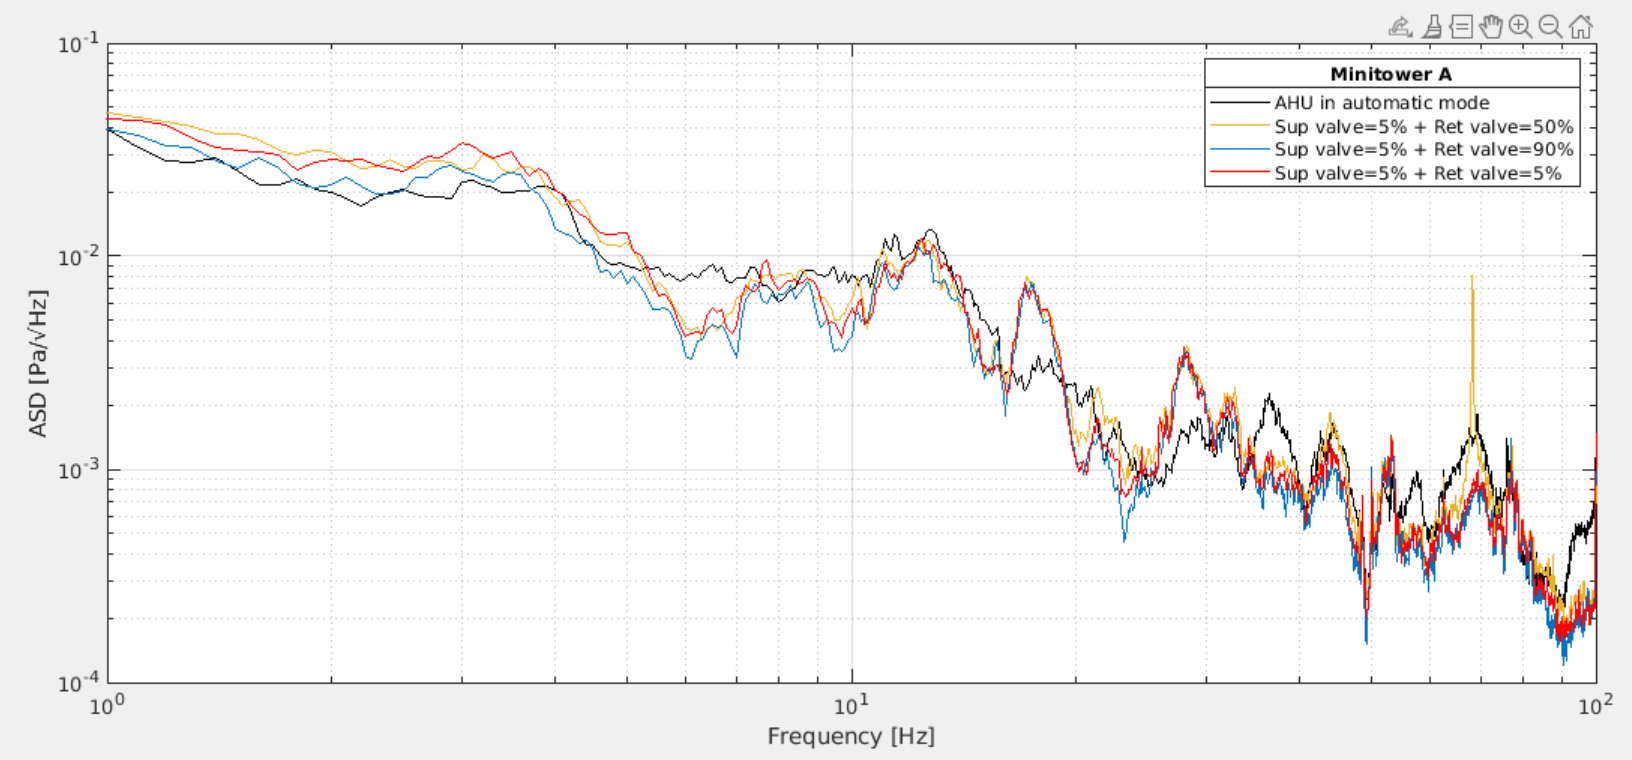
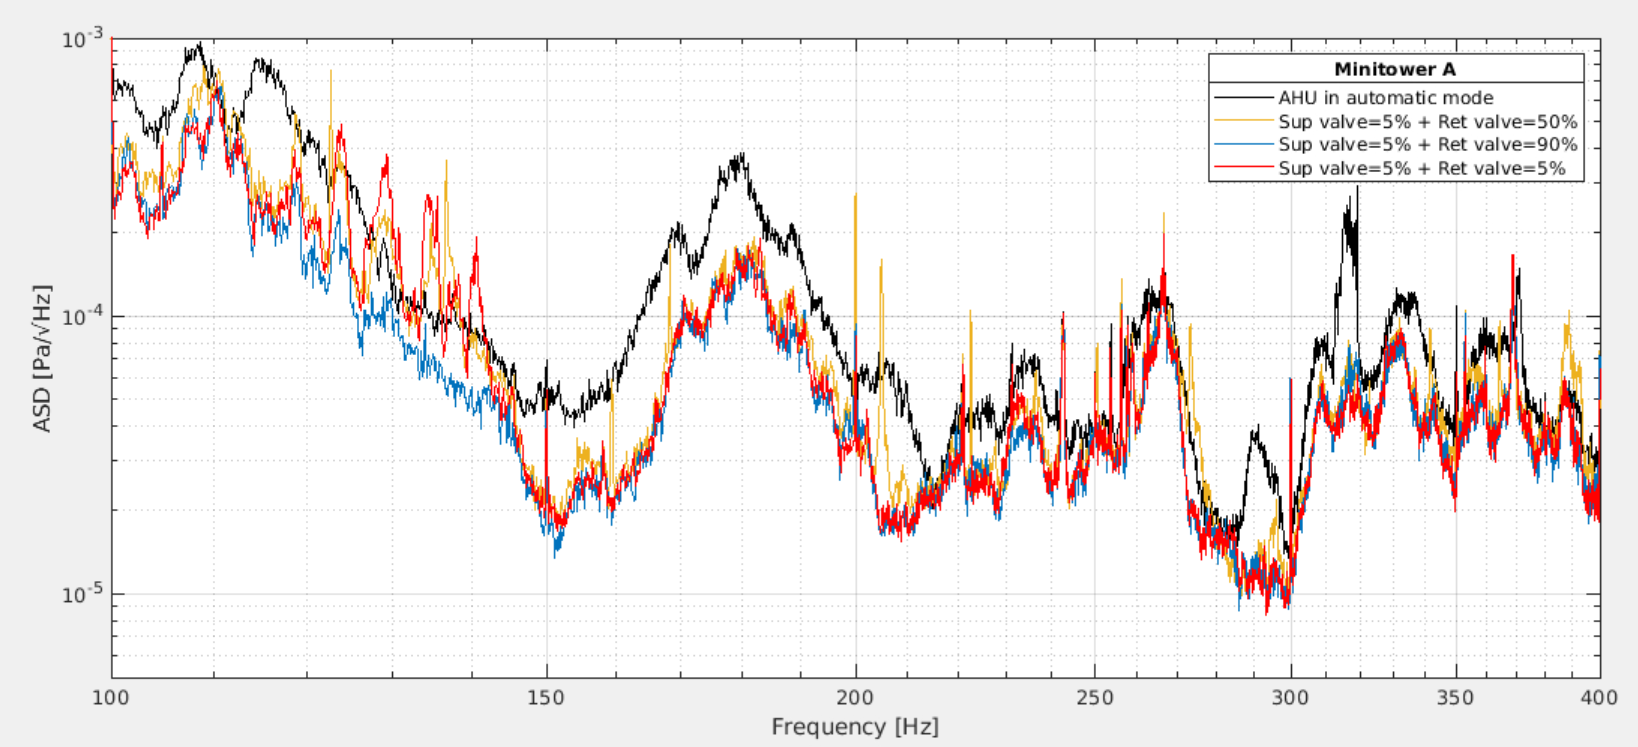
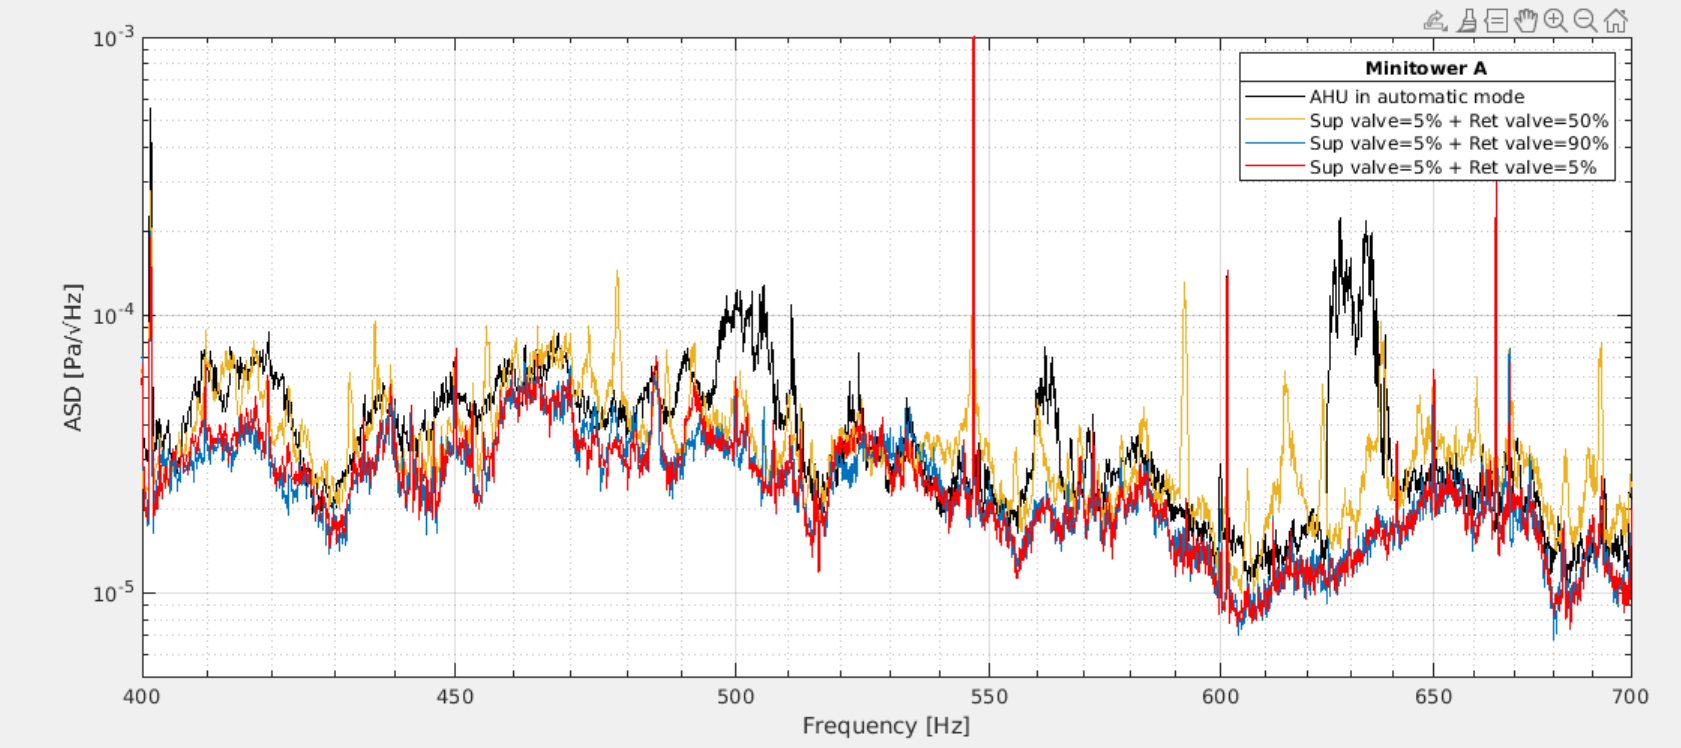
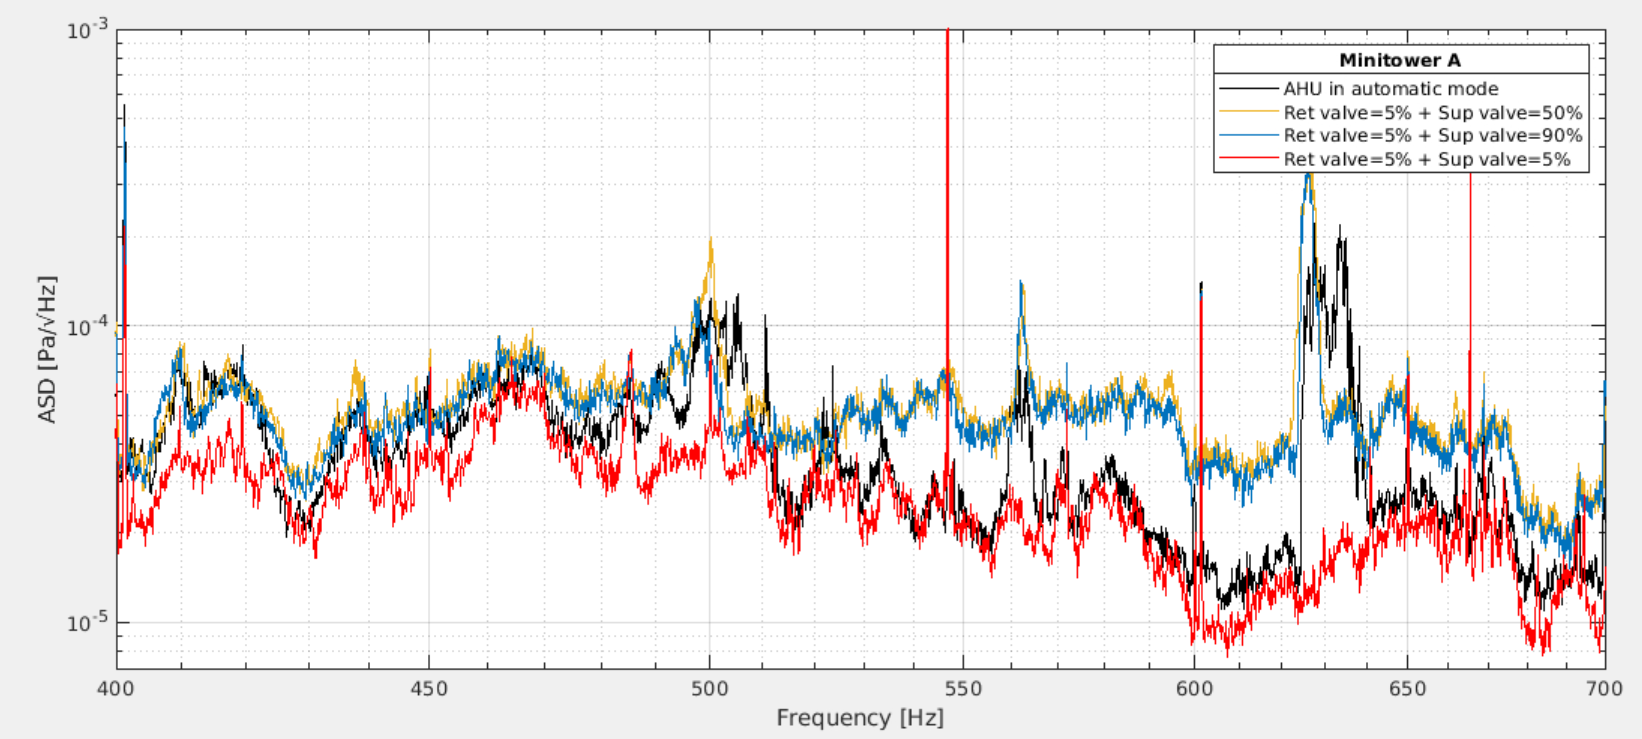
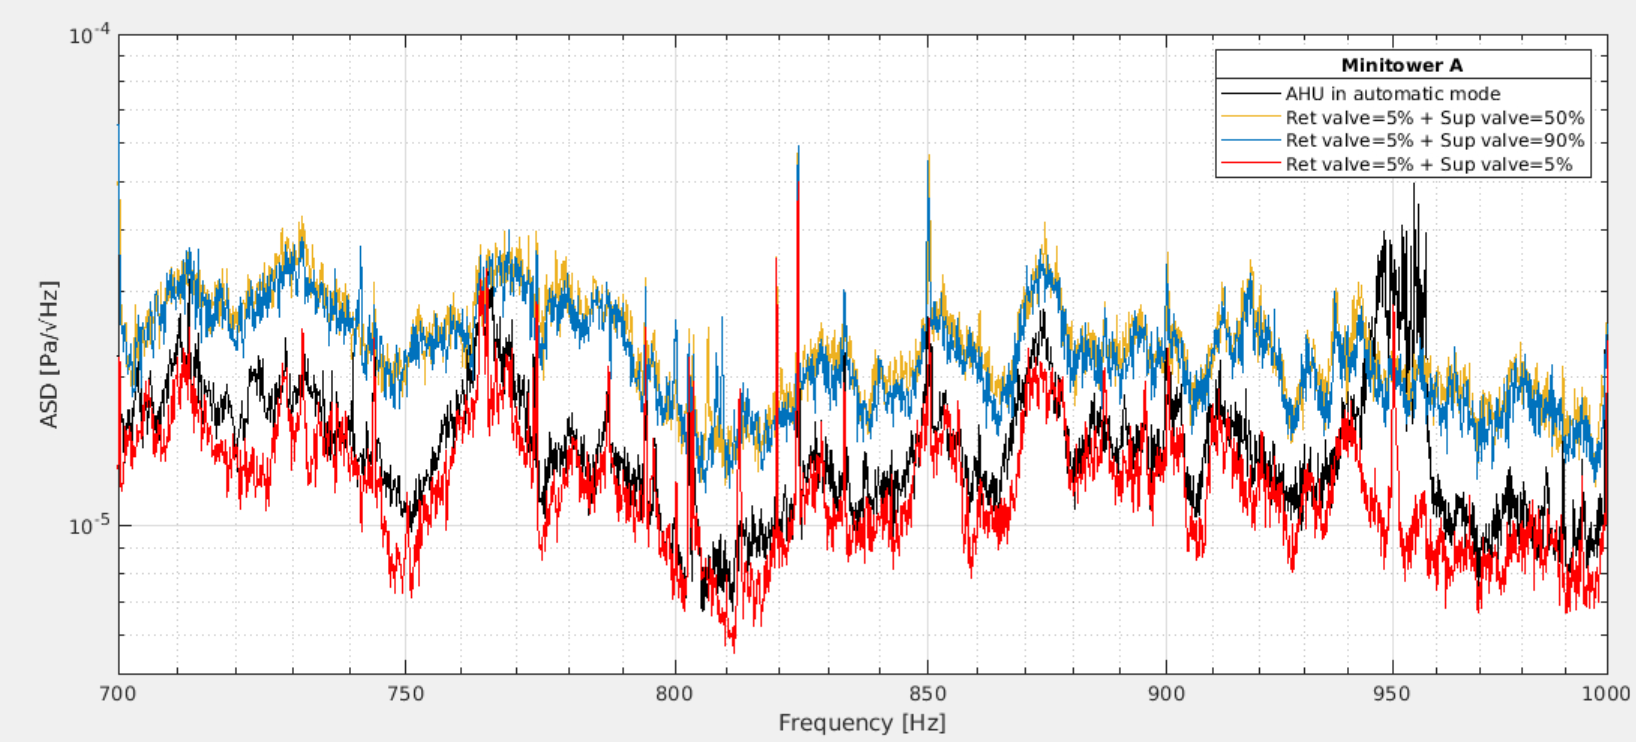
Figures 11, 12, 13, 14 show zoomed views of the acoustic spectra in the same frequency ranges reported previously, measured while varying the opening of the MiniTower A return air valves (50%, 90%, and 5%) and keeping the supply air valves fixed at 5% opening.
The acoustic spectra measured during the MiniTower A valve scan show that all tested manual configurations provide a reduction of the broadband acoustic noise with respect to the nominal automatic operation (black curve), particularly below 400 Hz. The configuration with the return valve set to 90% opening (blue curve) generally provides the lowest acoustic ASD over a large fraction of the investigated frequency range. In contrast, the configuration with the return valve set to 50% (yellow curve) introduces several additional narrow-band features above 400 Hz.
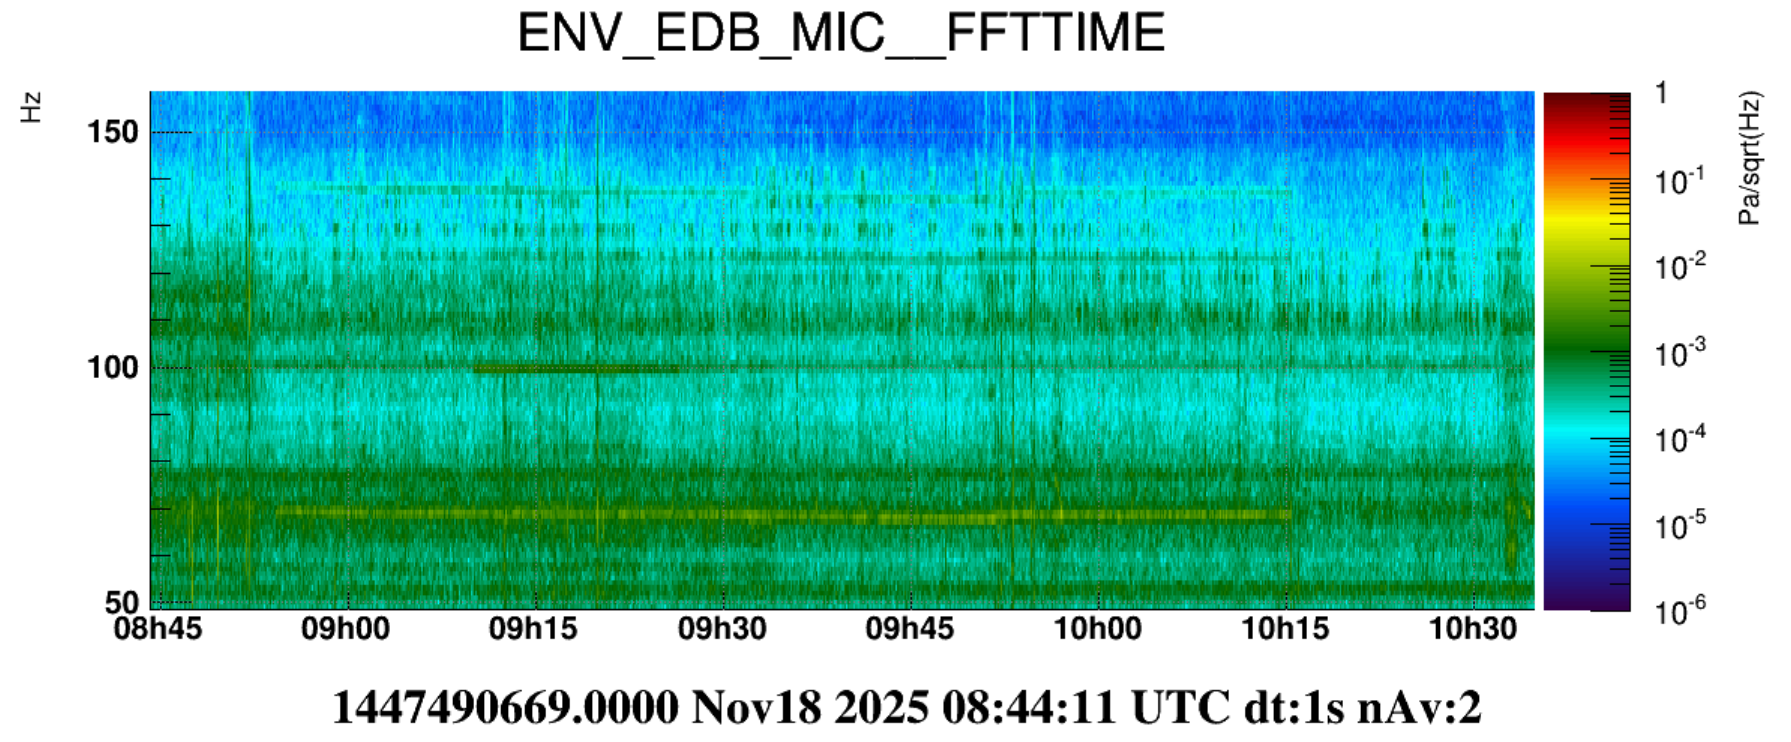
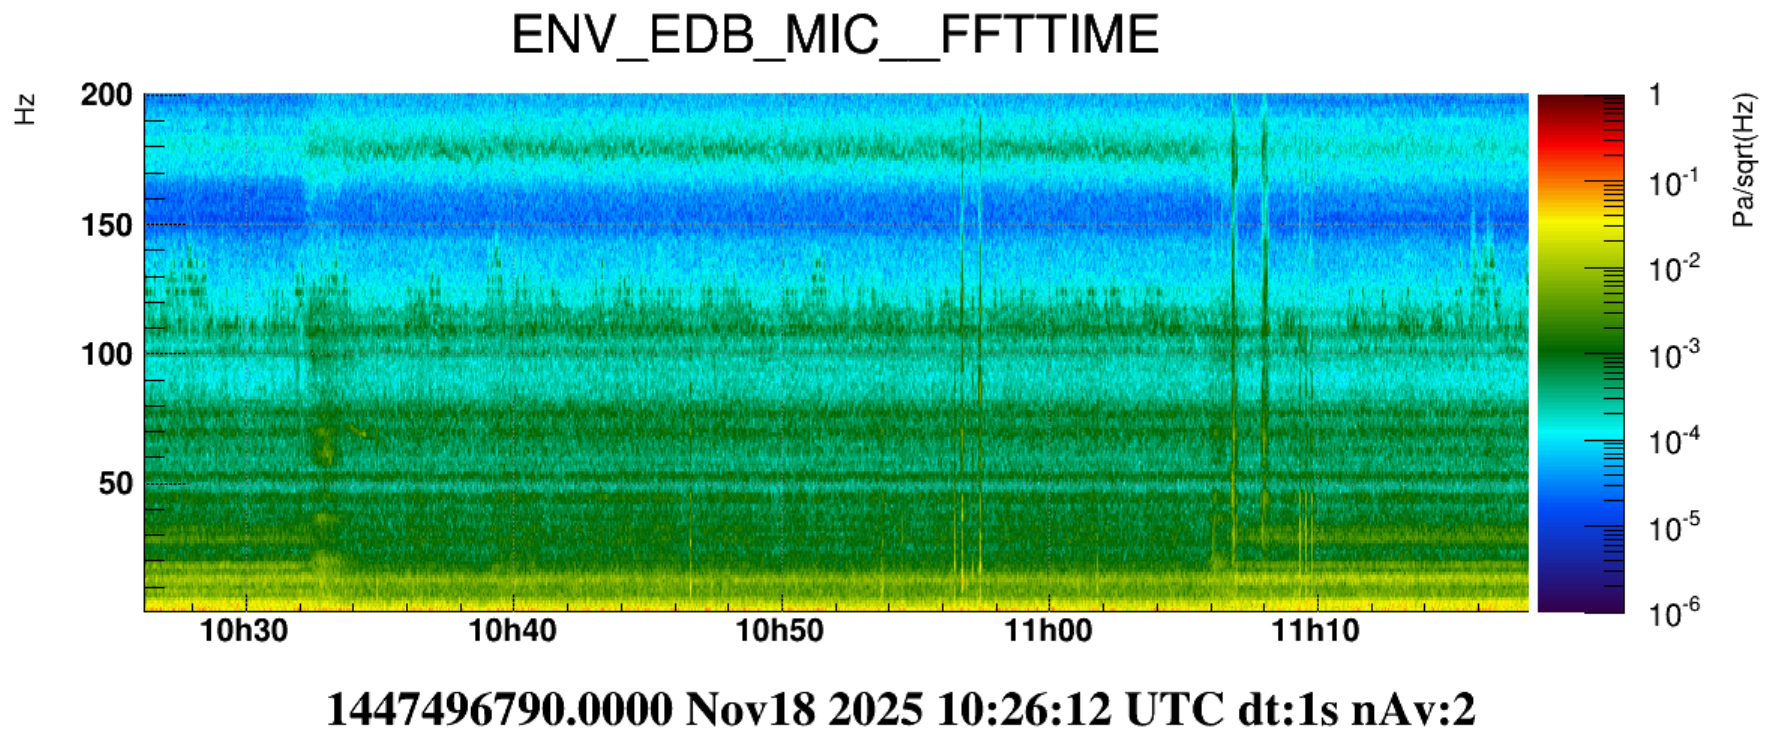
The time-frequency analysis (Figures 15, 16, 17) confirms that several spectral structures appearing above approximately 400 Hz are correlated with specific valve configurations and evolve following the changes introduced during the test.
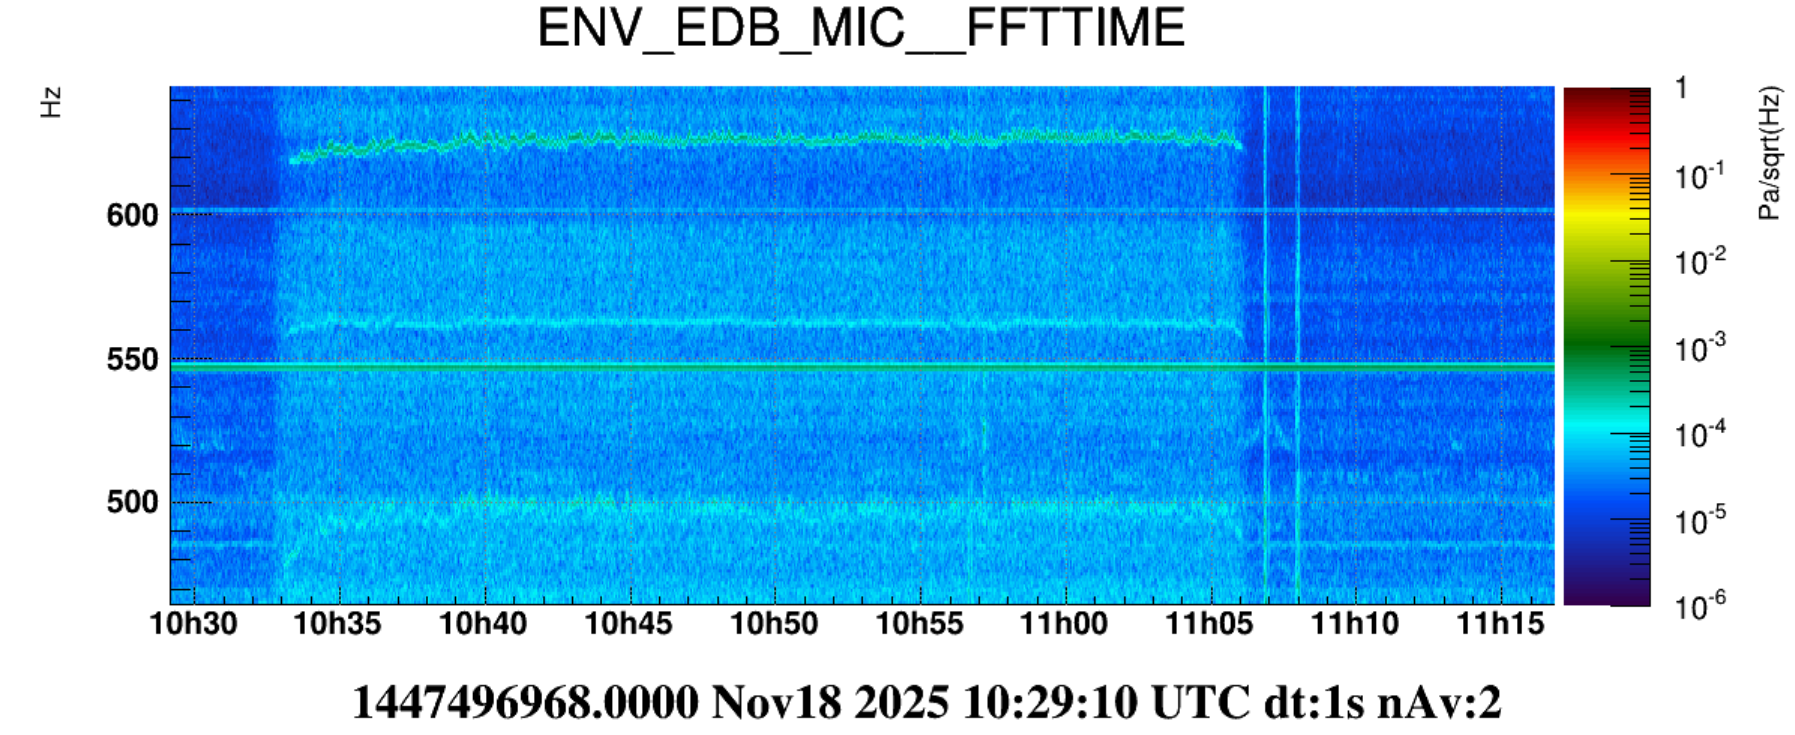
Moreover, Figure 17 shows that the group of spectral lines observed in the 600–1k Hz region during the configuration with the return air valve set to 90% disappears approximately five minutes after switching the valve opening from 90% to 5% (10:15 UTC).
Figures 18, 19, 20, 21 show the acoustic spectra measured during the last part of the test, where the return air valve opening was kept fixed at 5% and the supply air valve opening was varied between 50%, 90%, and 5%.
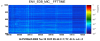
The comparison shows that the configuration with both supply and return air valves set to 5% (red curve) provides the lowest acoustic ASD over most of the investigated frequency range. This reduction is particularly visible between 100 and 400 Hz, where several broad structures observed in automatic mode and in the configurations with larger supply valve openings are significantly reduced. The same configuration also reduces the level of several spectral structures, especially in the 300–650 Hz region as shown in the spectrograms Figure 22, 23, 24.
In contrast, the configurations with the supply valve set to 50% (yellow curve) or 90% (blue curve) show higher acoustic levels and are often comparable to, or above, the automatic-mode reference.
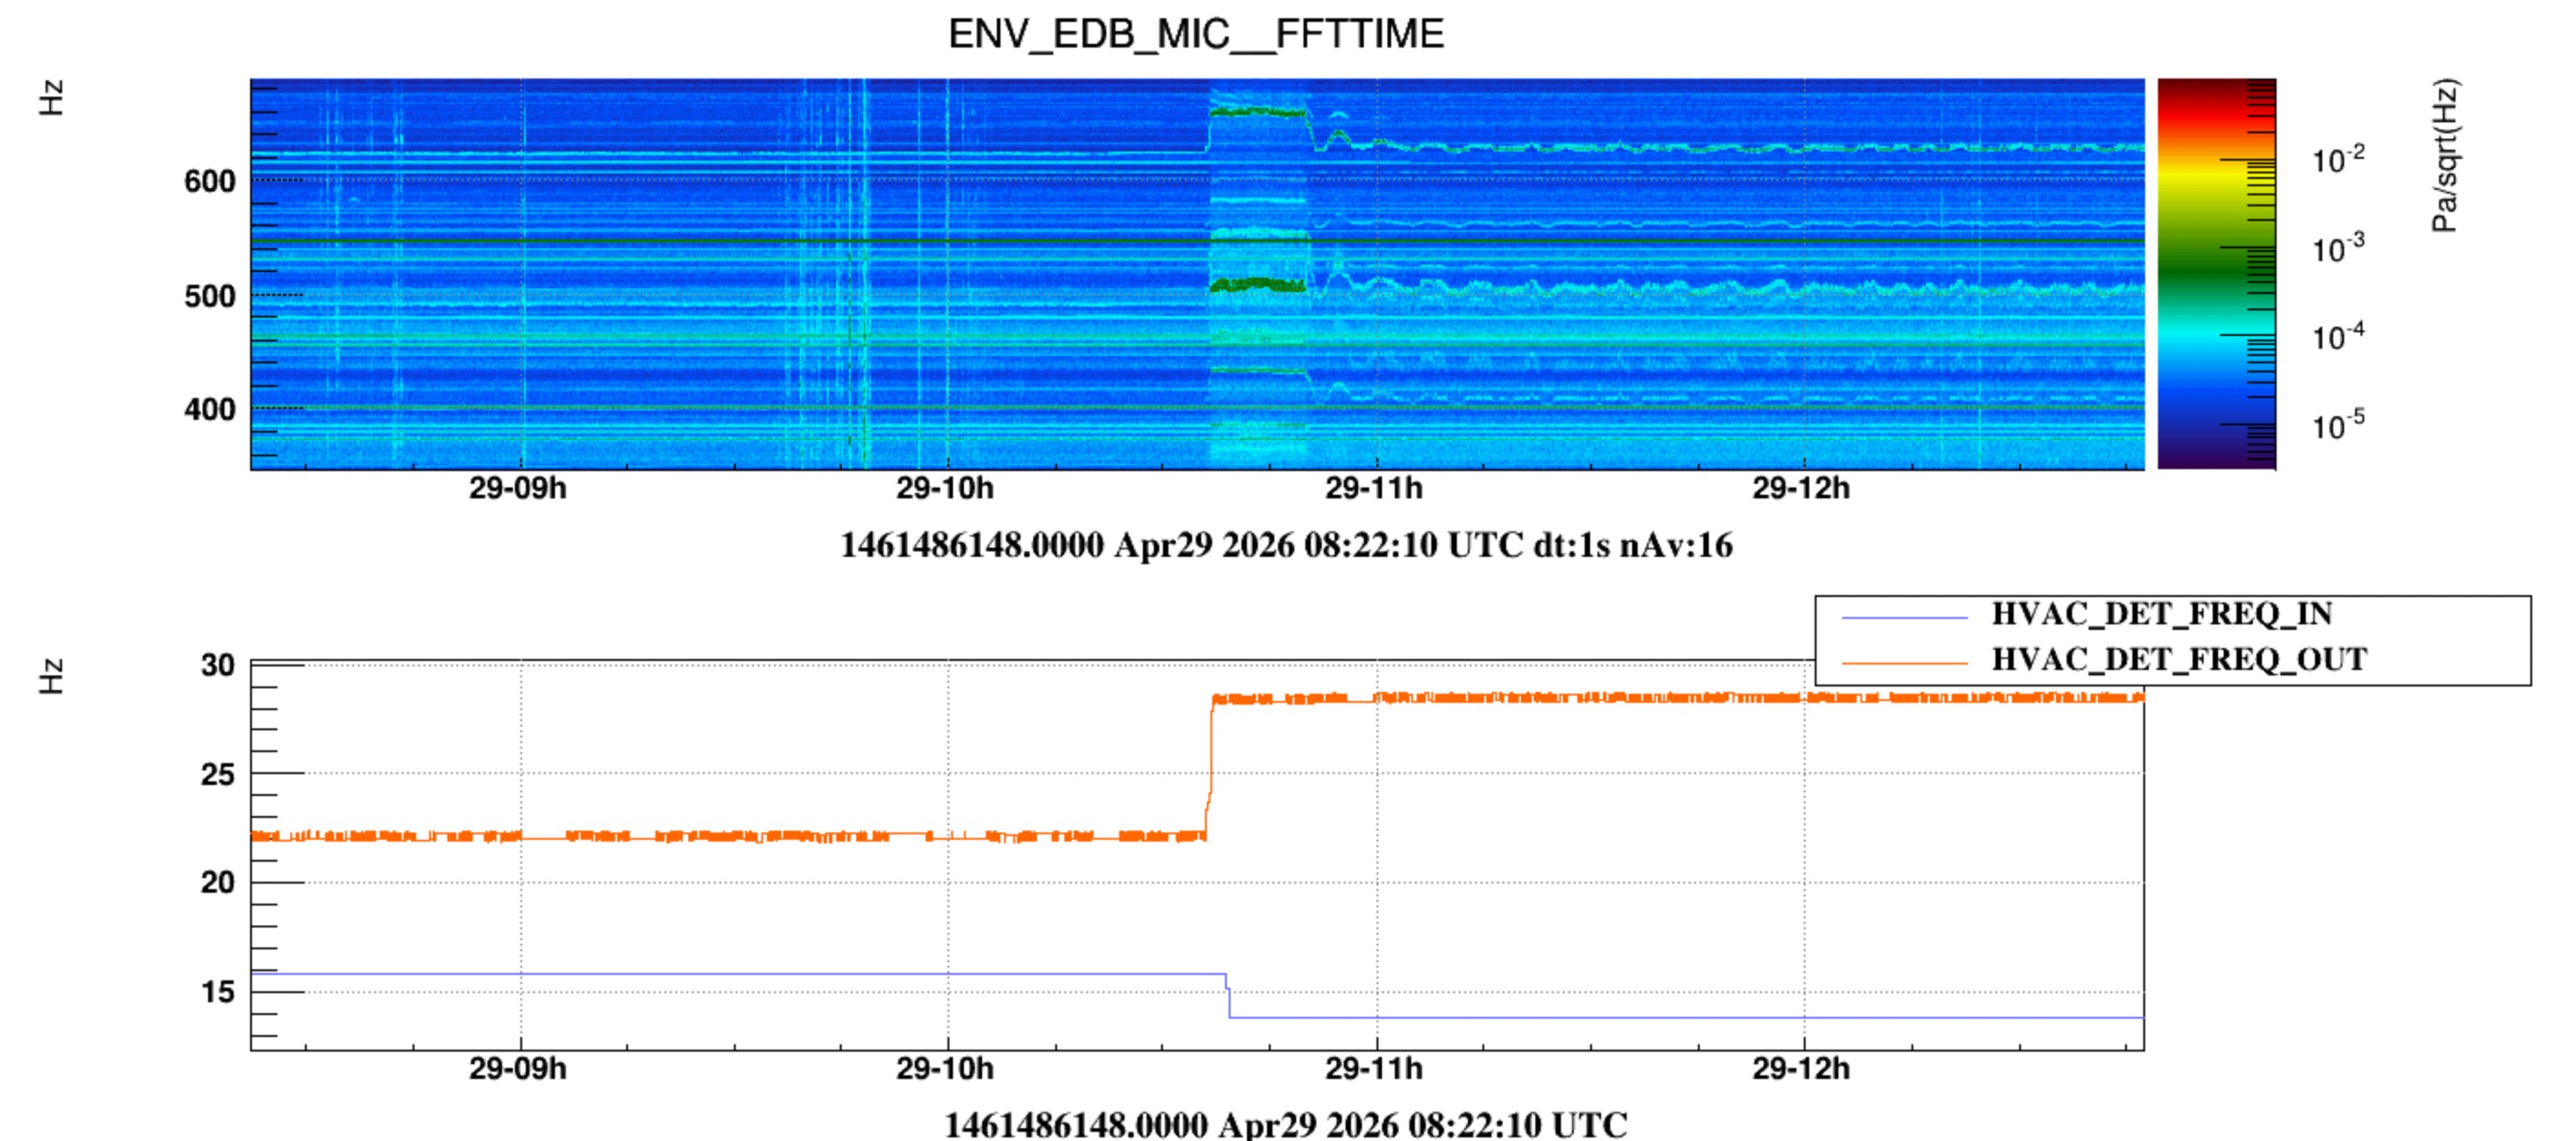
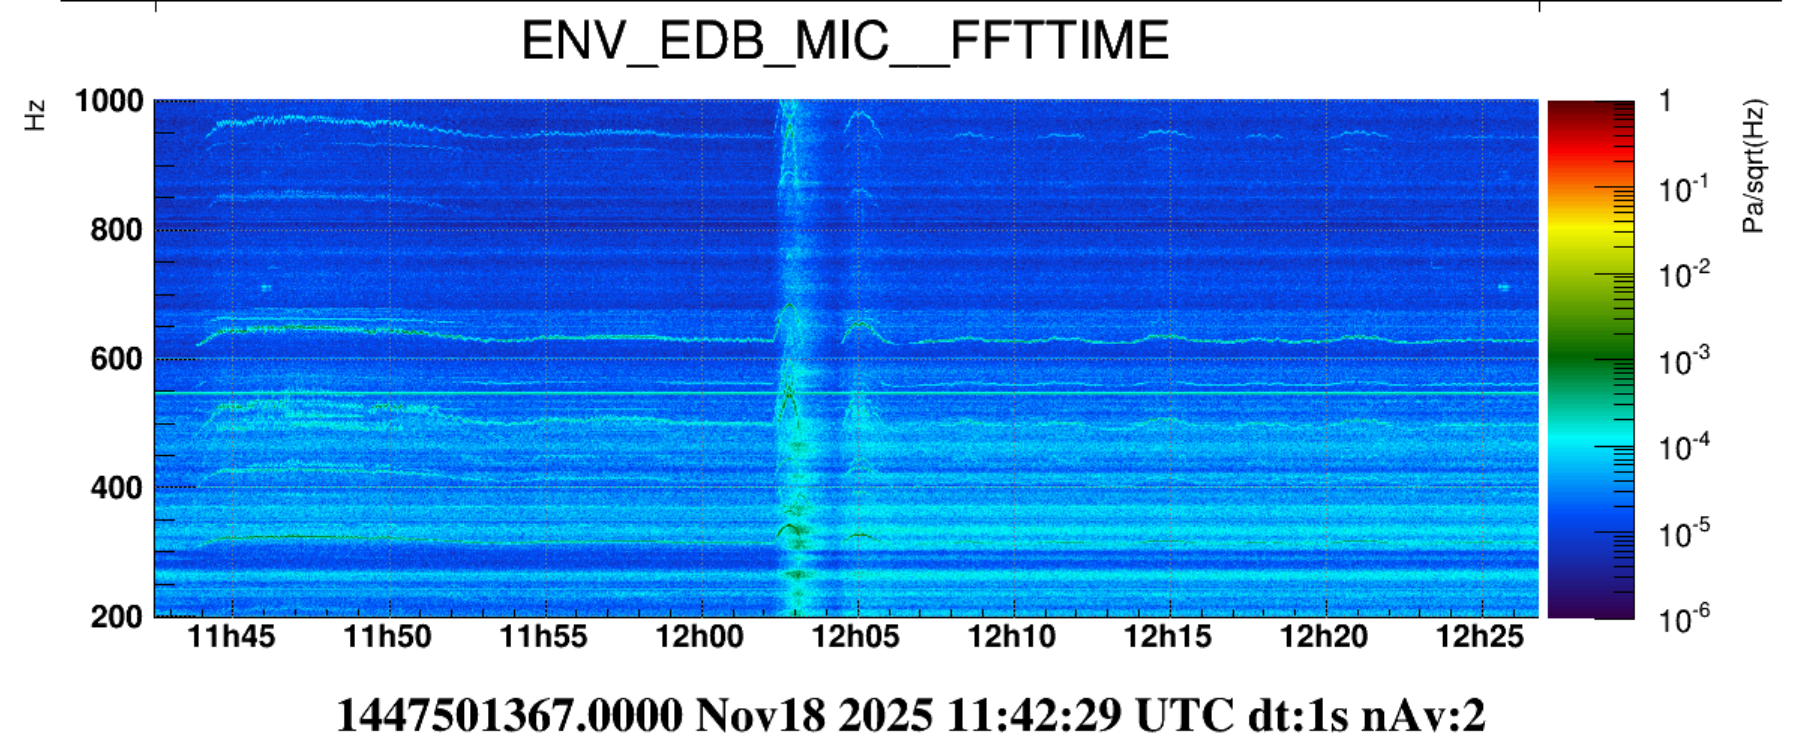
An additional TF map (Figure 25) during the restoration of the MiniTower B valves to automatic operation (11:45 UTC) shows the reappearance of several narrow-band spectral features that had previously disappeared when both MiniTower A and MiniTower B valves were operated in manual mode. The temporal coincidence suggests that these structures may be associated with the airflow distribution of the MiniTower B branch. This behavior is particularly visible for the spectral features observed between approximately 300 Hz and 650 Hz.
**** Summary ****
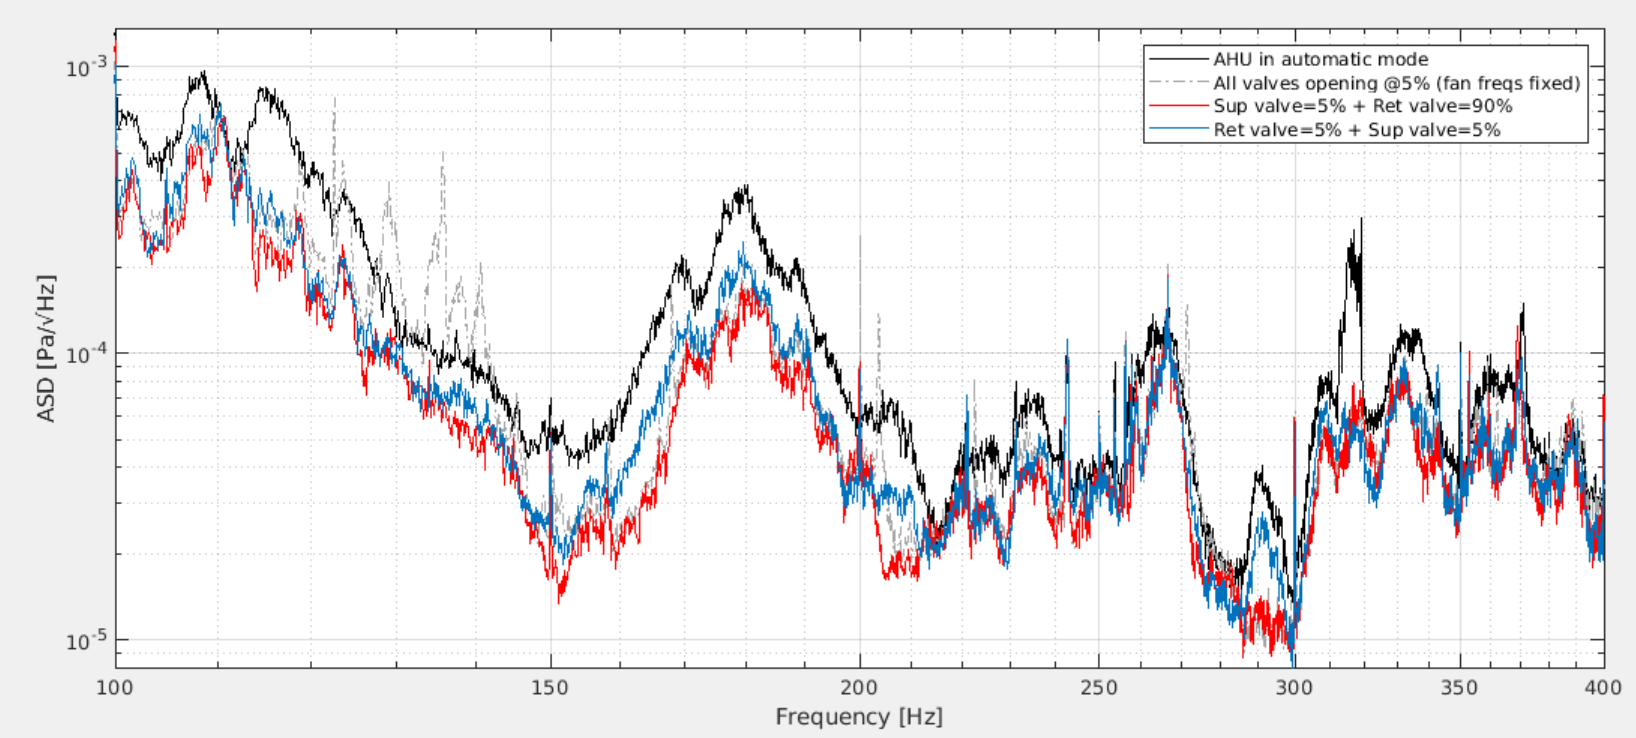
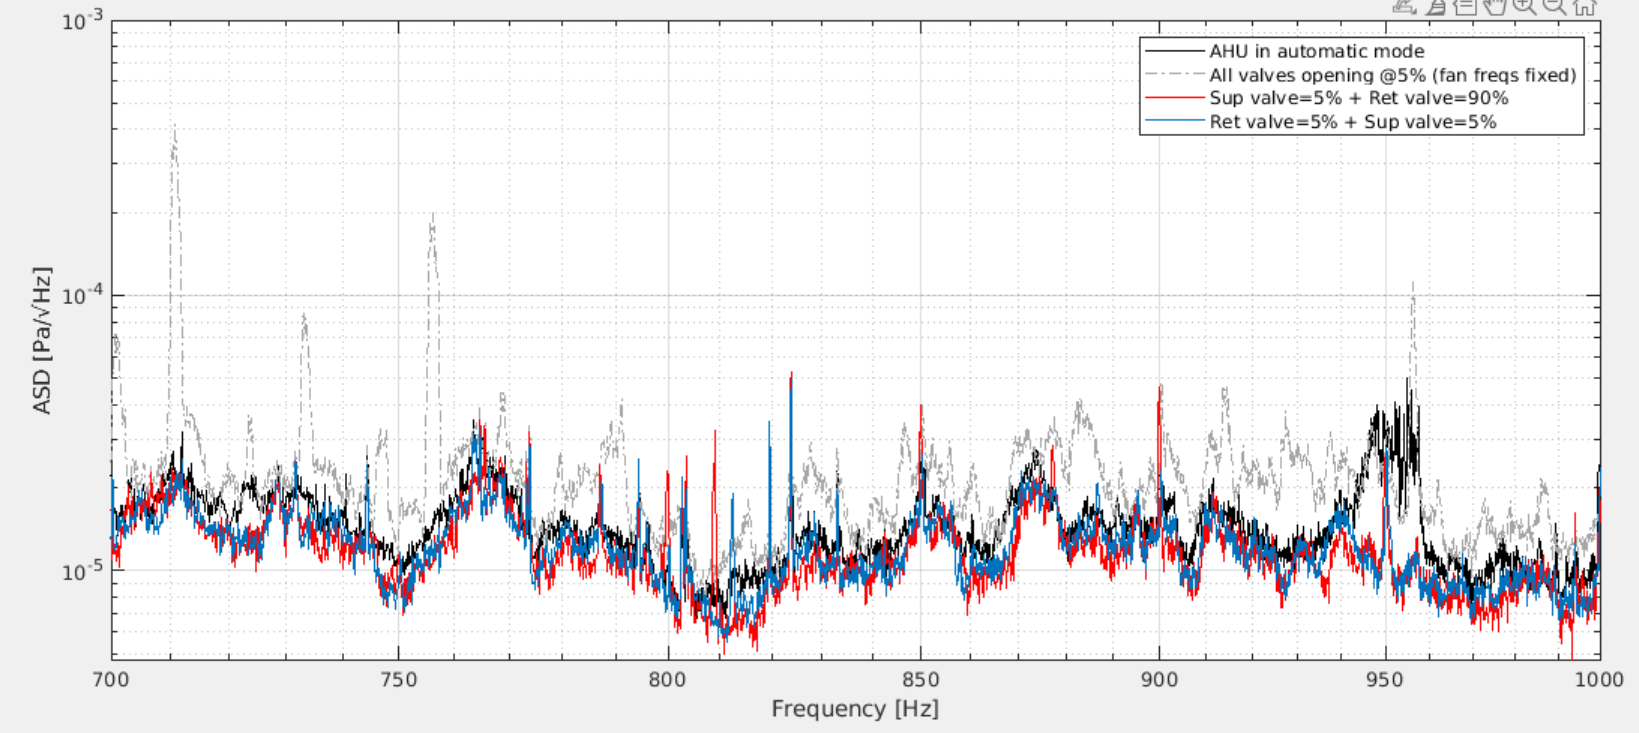
Figures 26,27,28, 29 show the acoustic spectra for the nominal automatic operation (black curve), the configuration with all valves fixed at 5% opening (gray curve), and the two most favorable Mini-Tower A configurations identified during the test: supply valve at 5% with return valve at 90% (red curve), and supply valve at 5% with return valve at 5% (blue curve).
- The comparison shows that the nominal automatic operation is not the quietest configuration.
- The configuration with all valves fixed at 5% opening also provides a reduction in some bands, but it introduces additional narrow-band structures, especially above 400 Hz. This suggests that forcing all valves to the same low opening is not necessarily the optimal acoustic configuration.
- Among the tested configurations, the most favorable ones are those with the Mini-Tower A supply valve fixed at 5%, namely supply 5% / return 90% and supply 5% / return 5%. However, the nominally identical 5% / 5% configuration obtained during the return-valve scan (return fixed at 5% and supply varied) resulted in lower acoustic levels than the 5% / 5% configuration obtained during the supply-valve scan (supply fixed at 5% and return varied). This indicates that the acoustic response may depend not only on the final valve openings, but also on the sequence of valve adjustments and/or on the airflow stabilization time.
The results suggest that an optimized valve configuration could reduce the acoustic noise in the DET area with respect to the nominal automatic operation. Further dedicated tests are required to verify the reproducibility of the most promising configurations and to assess their long-term impact on the stability of the clean-room environmental parameters.


