Reports 1-1 of 1 Clear search Modify search
AdV-TCS (Point Absorbers Mitigation)
nardecchia, spinicelli, tomelleri, tringali - 0:48 Friday 25 July 2025 (67367) Print this report
IPATSiA: measurements in LN2

This afternoon, we continued the shift that started on Tuesday, July 22nd (entry 67353). 

The CO2 PA was projected onto two different points on the HR surface along the horizontal direction.

Summary of actions:

-15:10 UTC — Manual unlock of the interferometer performed in order to transition the ITF to LN2 mode.

- 15:19 UTC — CO2 laser switched ON.

- 15:44 UTC — ITF reached LN2 mode.

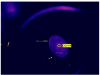
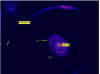
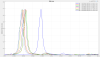
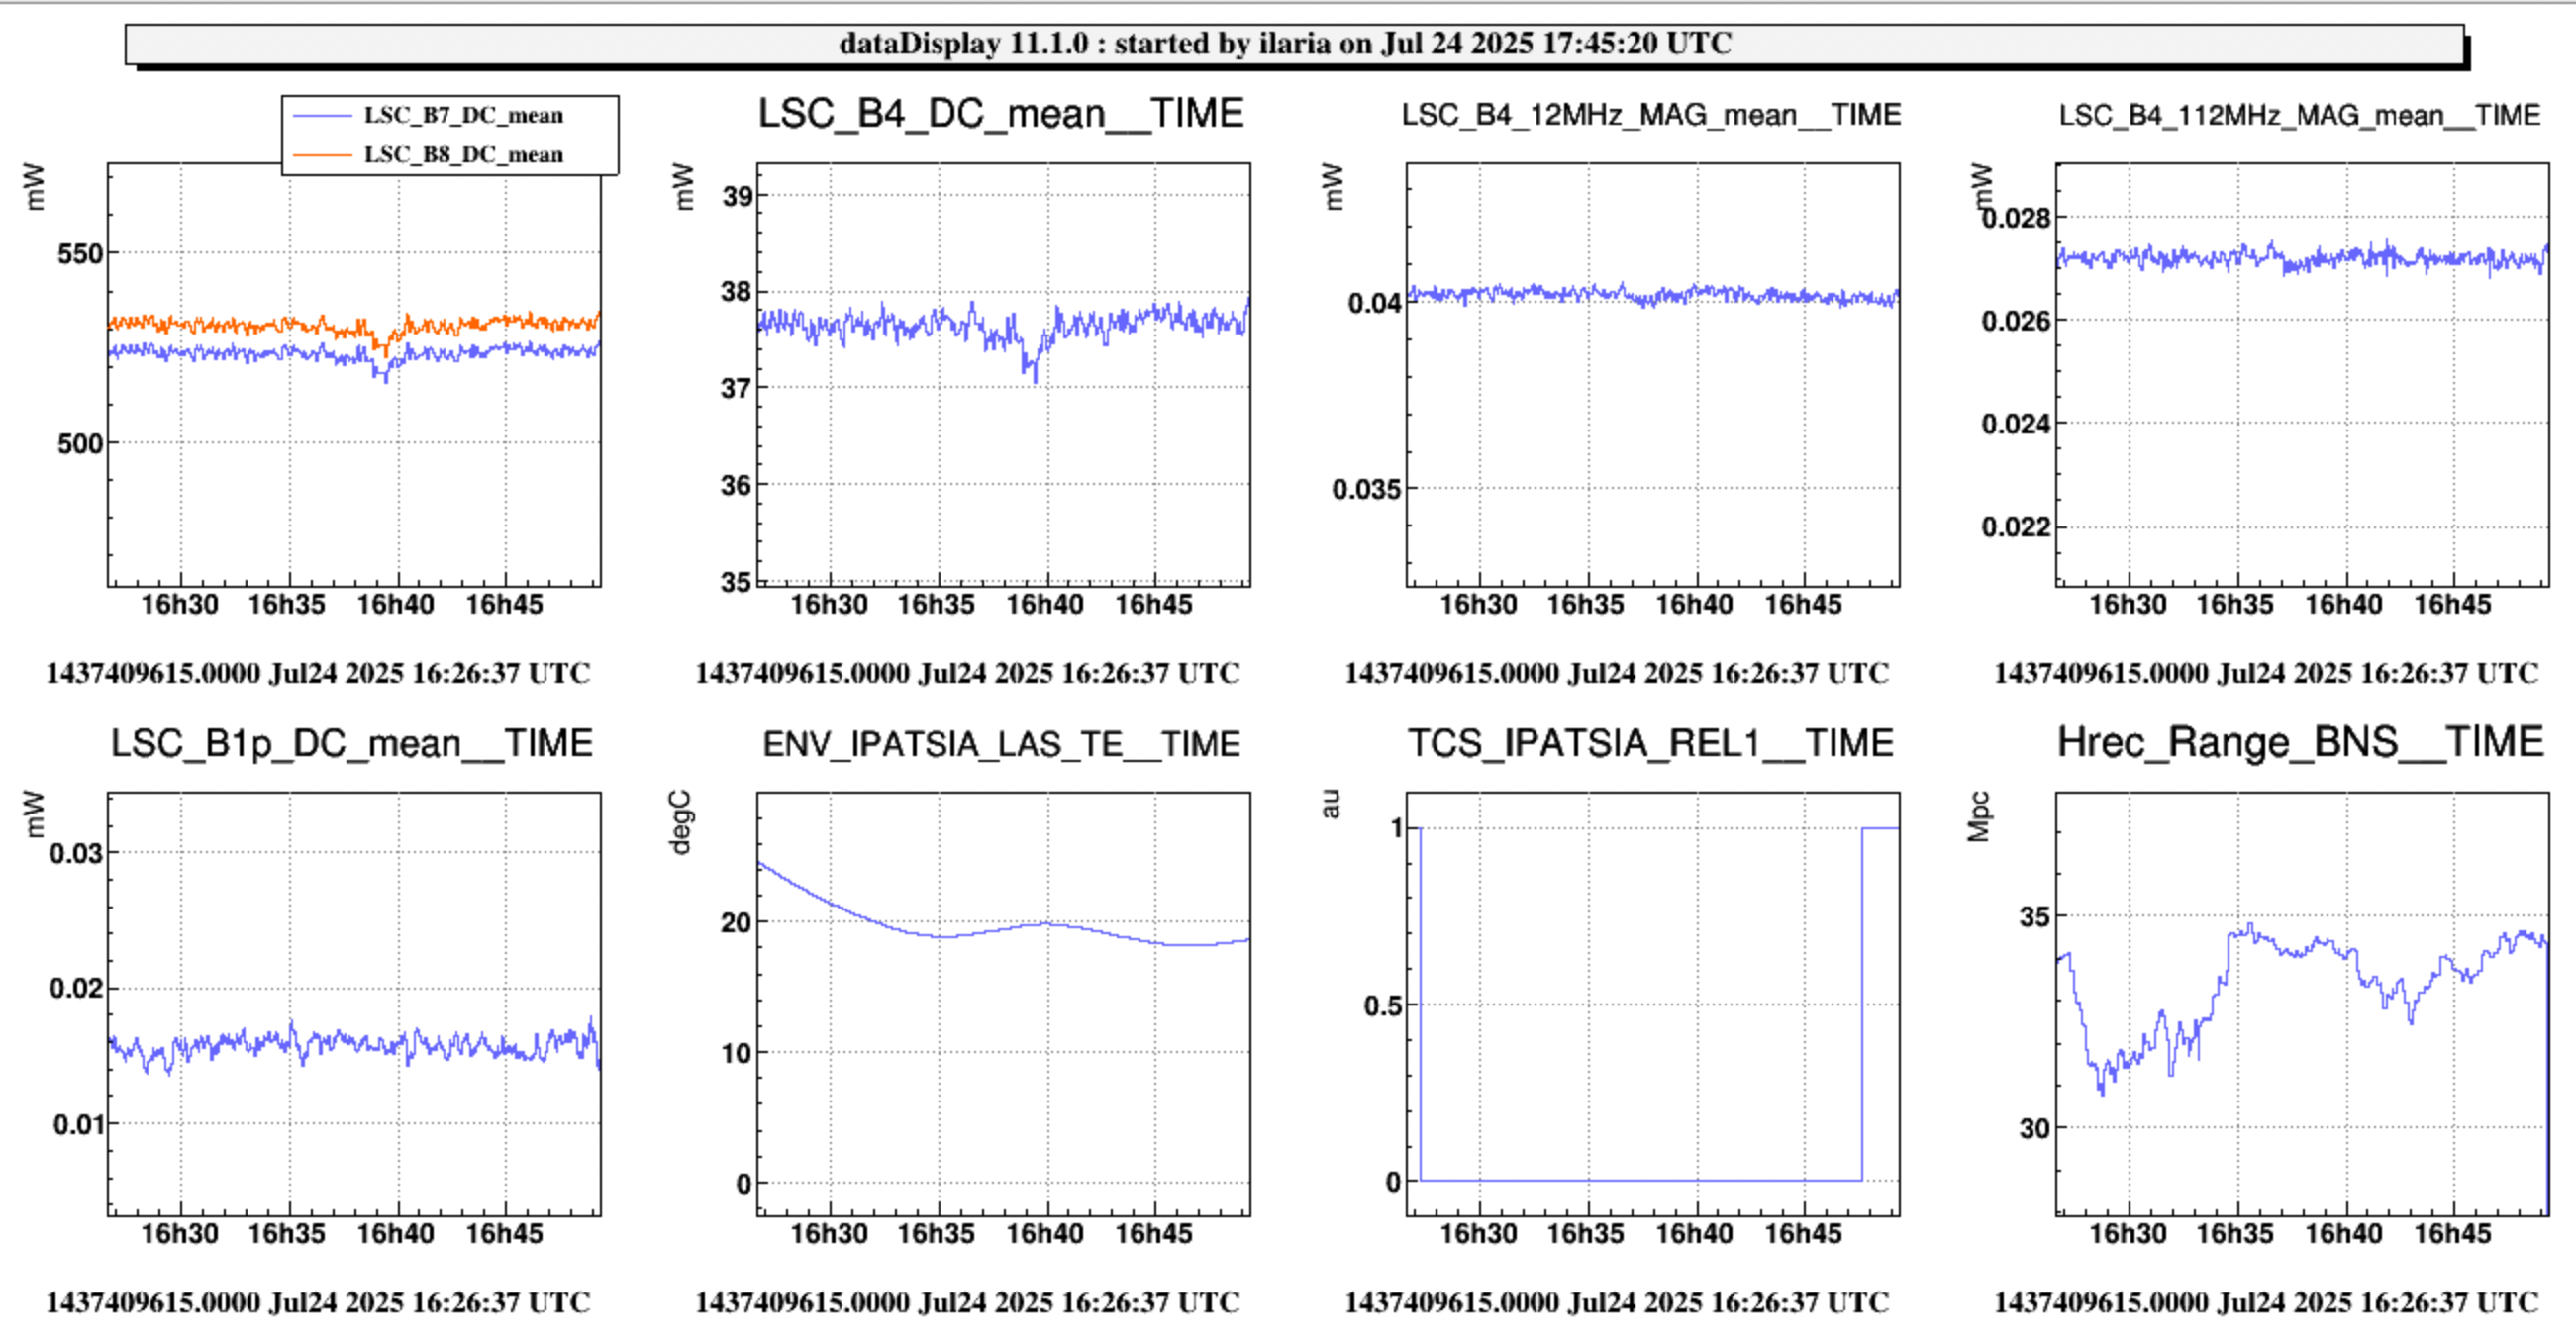
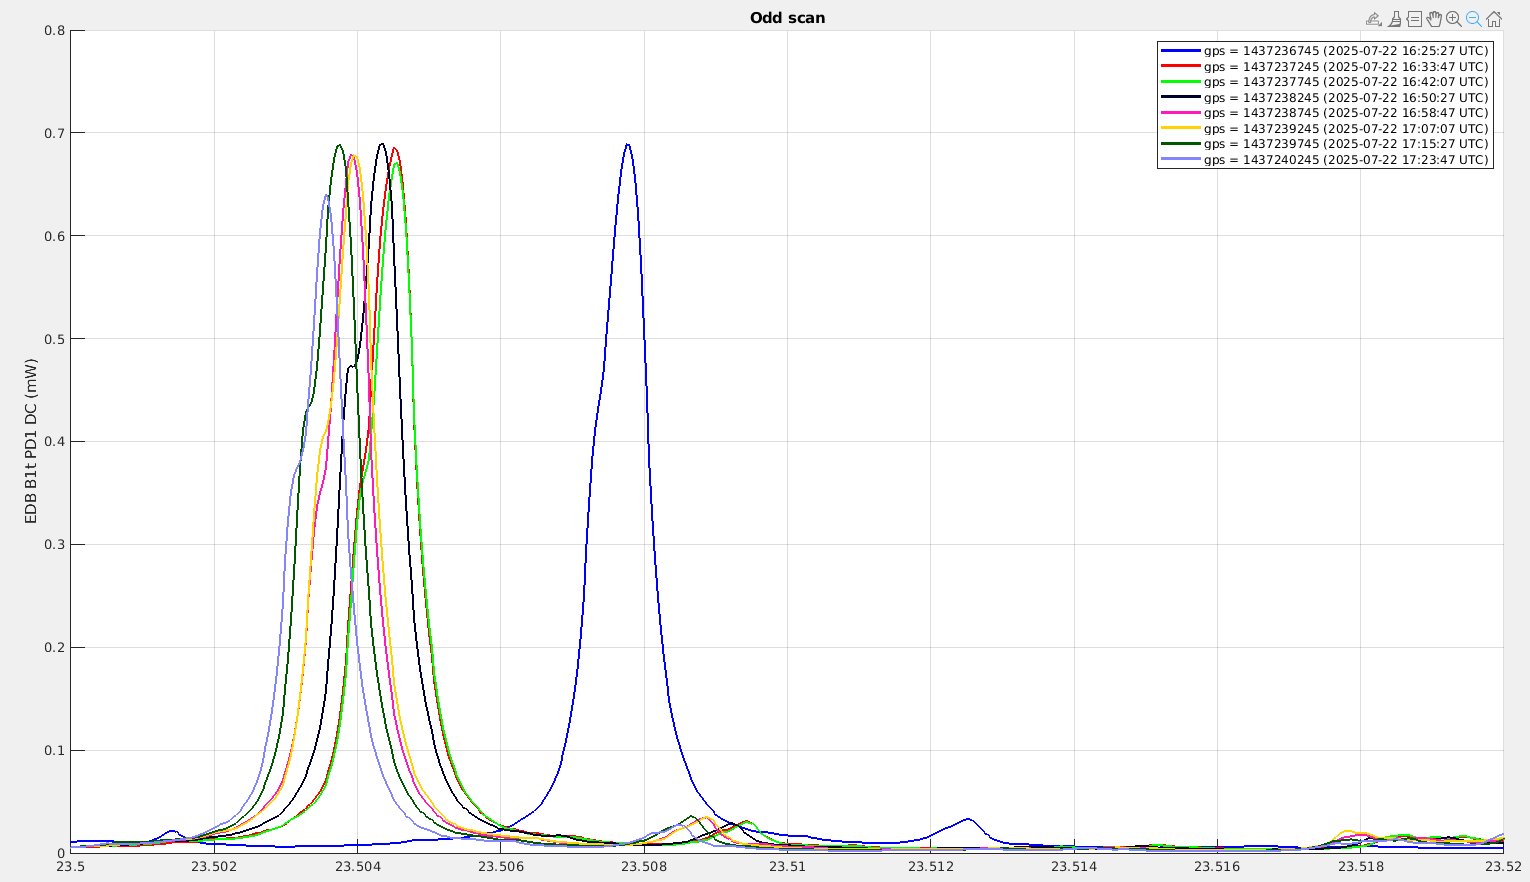
The reference image of the thermal camera without NO CO2 PA is shown in Fig.1. 

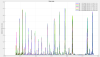
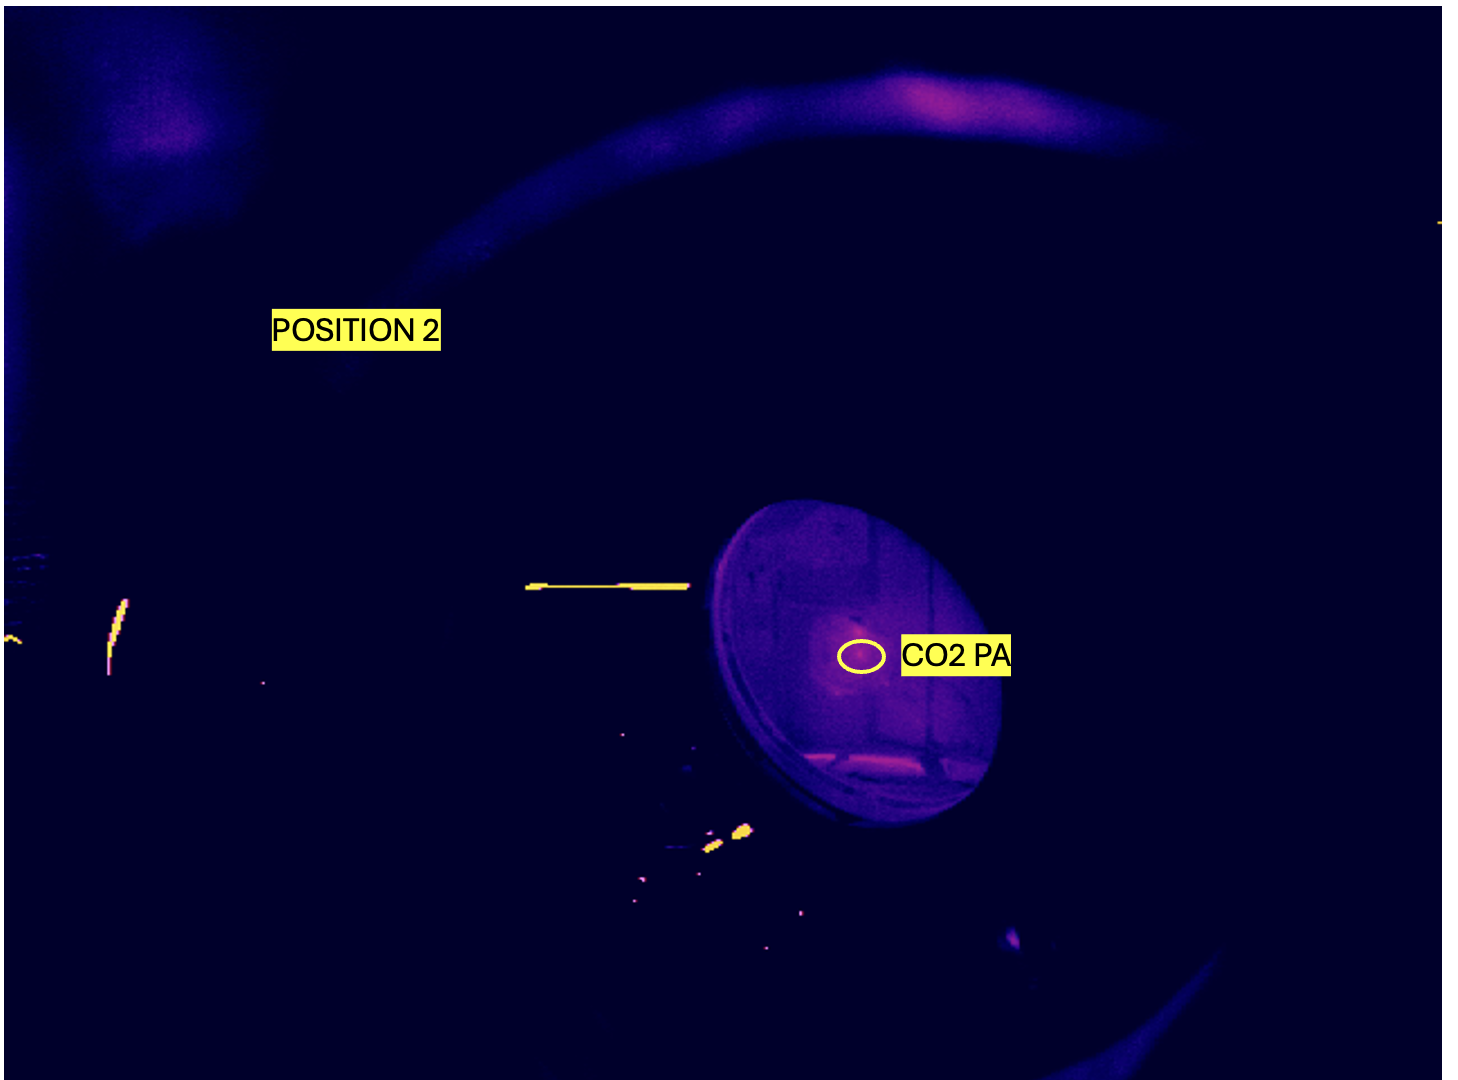
  1. CO2 PA applied in POSITION 1 (see Fig. 2).
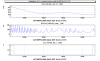
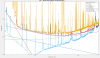
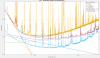
    Approximately 15 mW were applied to the HR surface of the mirror. Let us underline that the power was very unstable due to the difficulties of the chiller to keep the working point (see Fig.3). To improve stability, two options could be considered: shortening the tubes connecting the chiller to the laser, or using the TCS chiller.
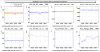
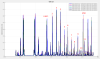
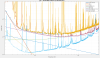
    16:27 UTC — Start shining → TCS_IPATSIA_REL1 = 0
    16:42 UTC — Stop shining → TCS_IPATSIA_REL1 = 1
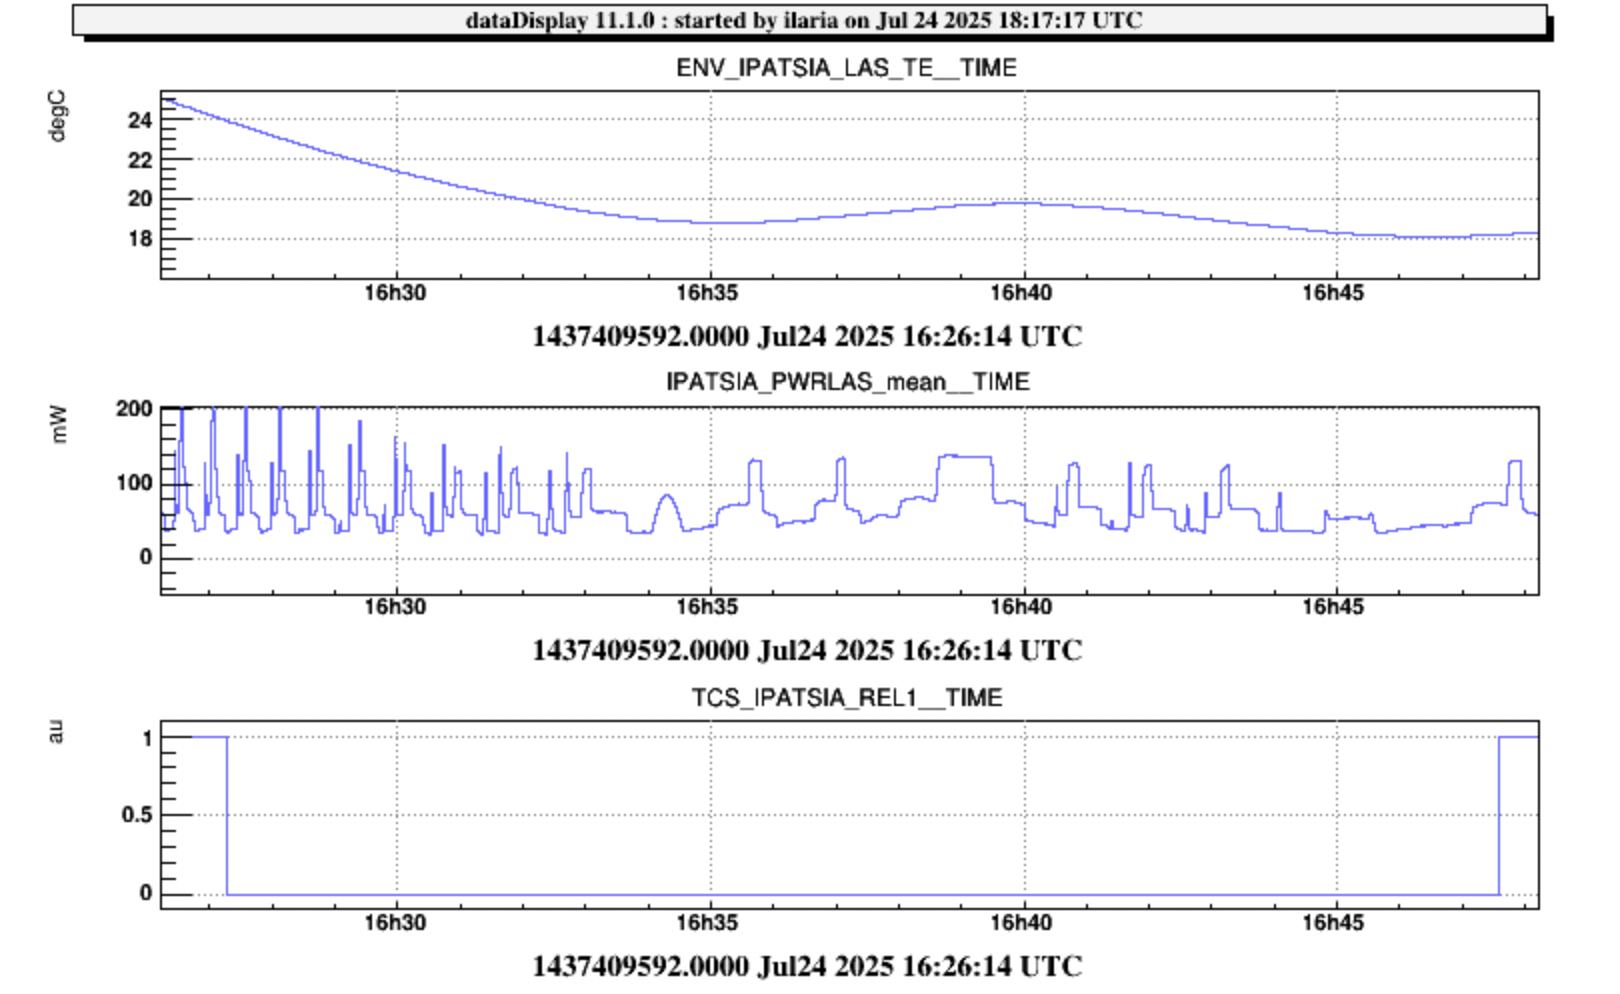
    No evident effects were observed on the main ITF signals during the shining (see Fig.4).

Subsequently, in order to increase the CO2 power injected into the ITF, I accessed the tower base. During this operation, the ITF unlocked at 16:49 UTC (unclear whether related). Later, during the OMC locking phase, the ITF unlocked again at 17:18 UTC. Piernicola identified an unusual oscillation of the EIB after the unlock. He resolved the issue, allowing the re-locking sequence to proceed.

The ITF successfully re-locked in LN2 mode at 18:27 UTC.

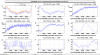
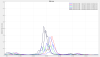
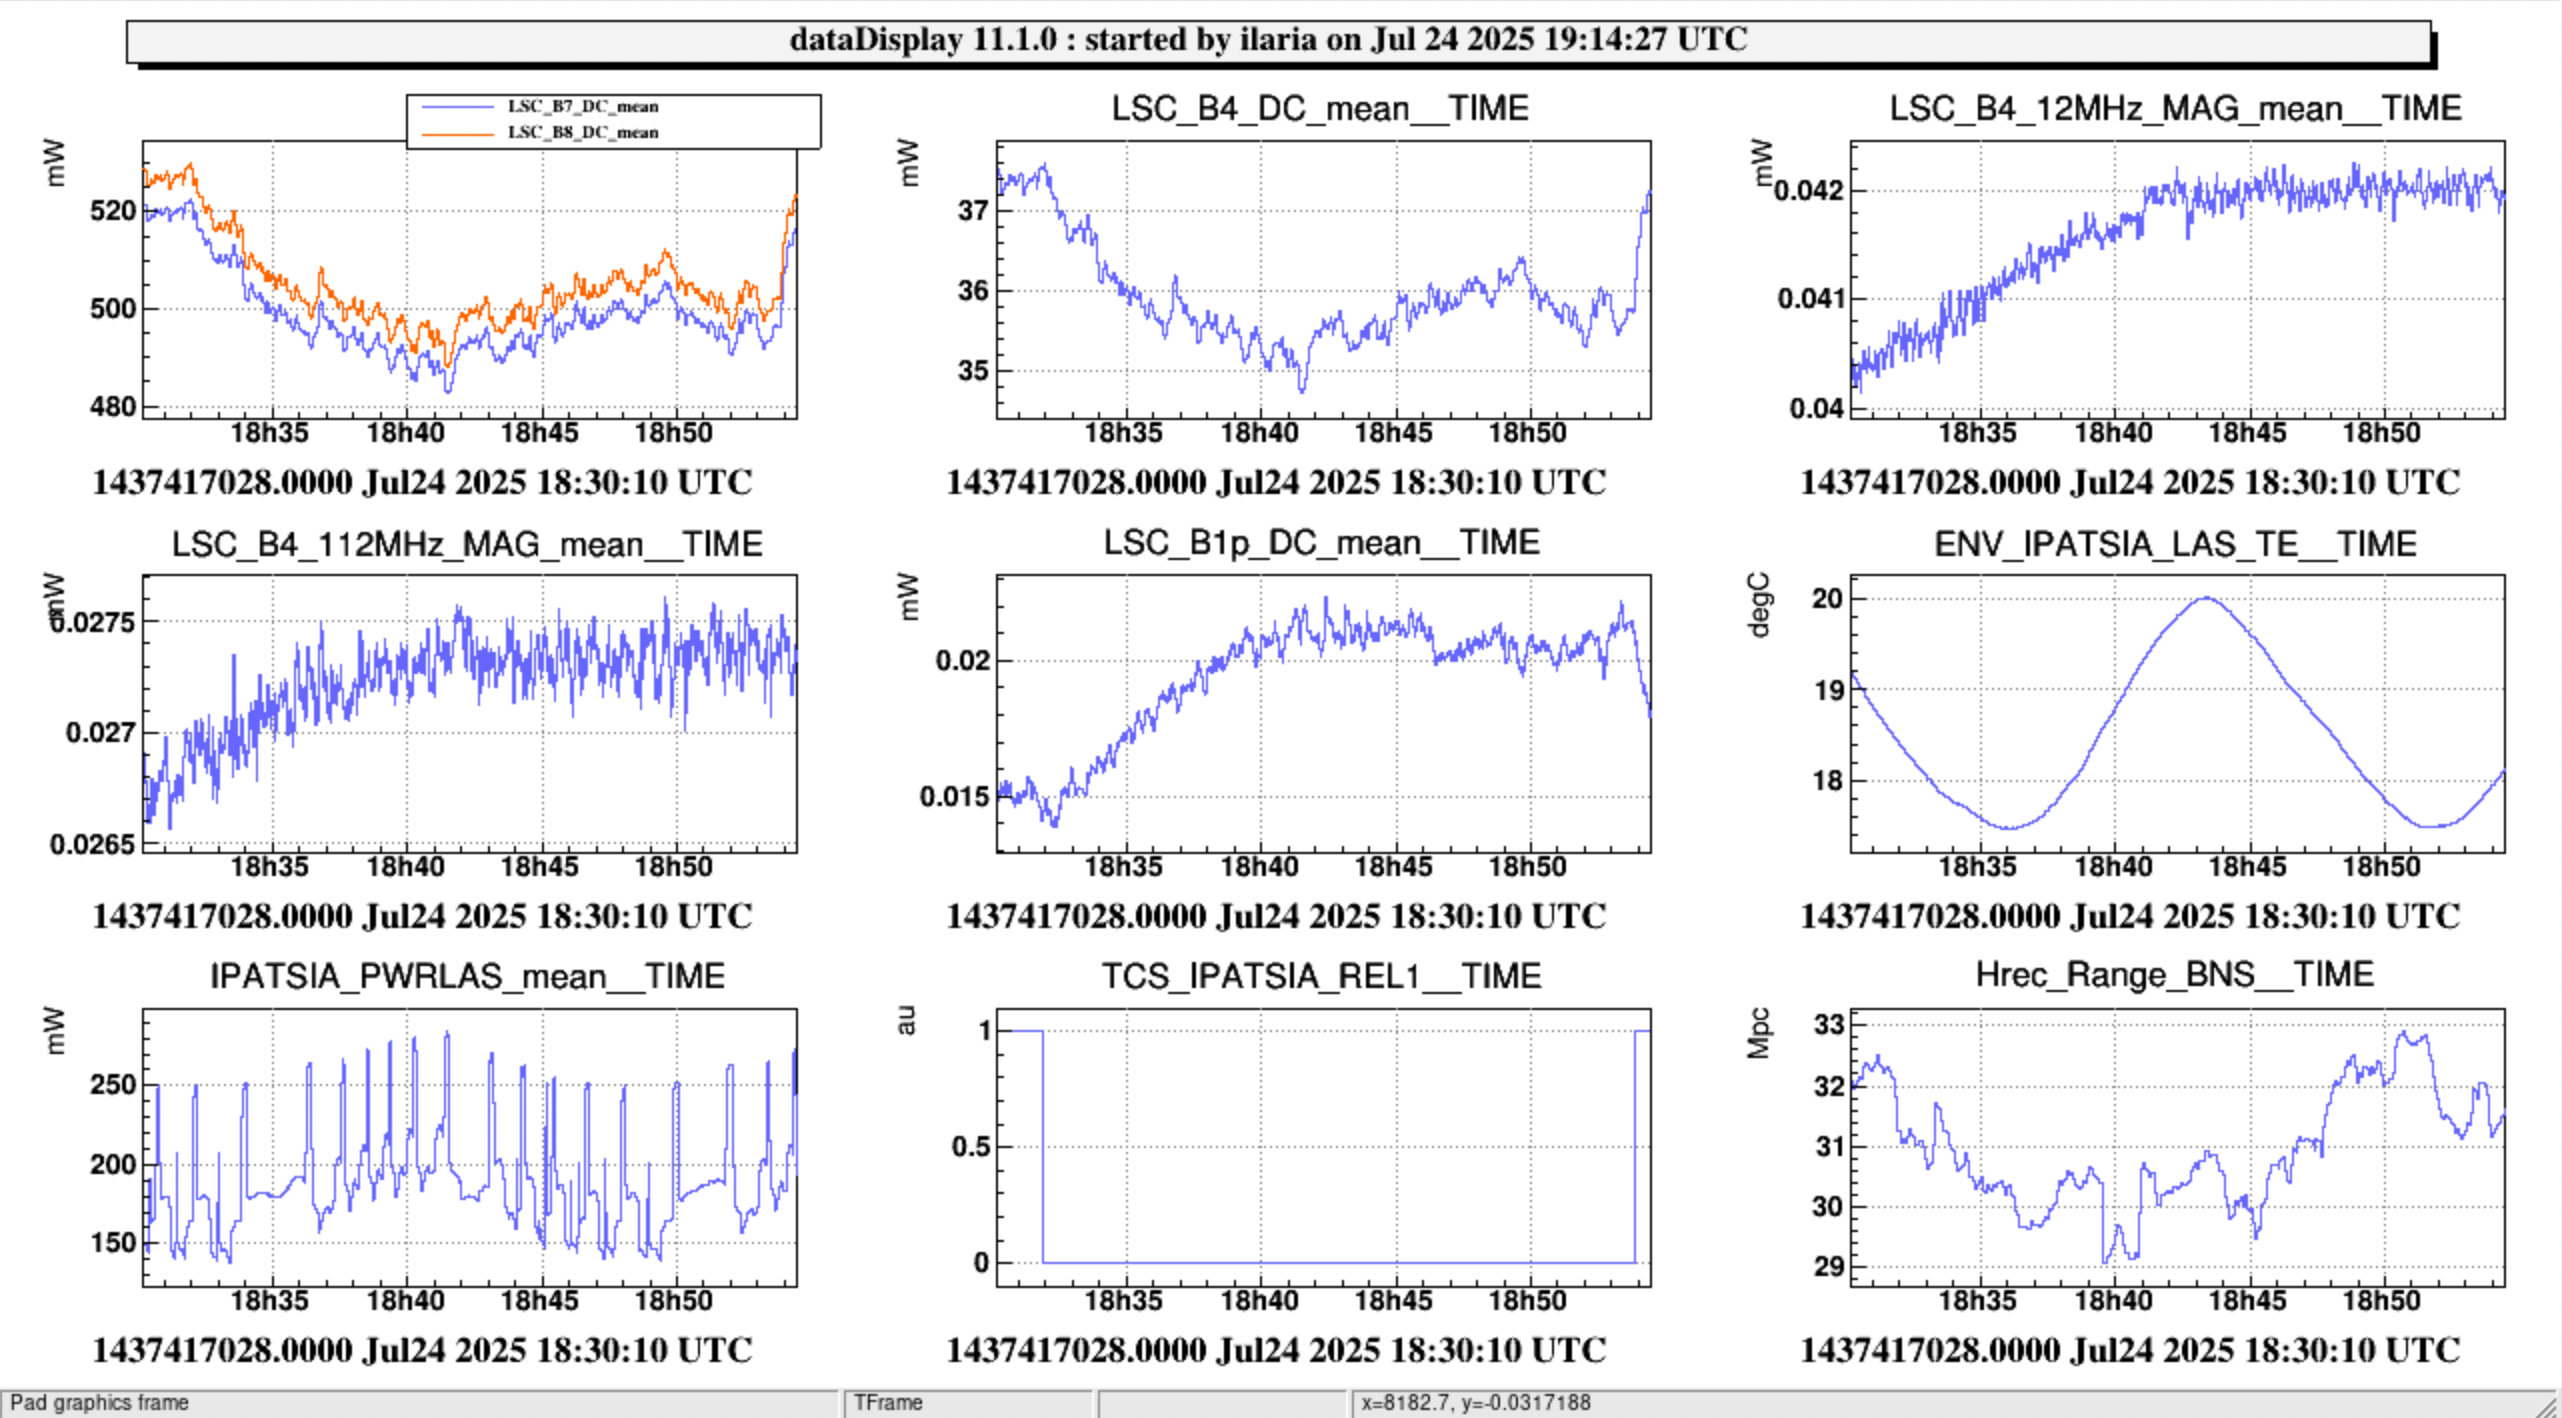
At 18:31 UTC, we applied CO2 PA on the HR surface with the PA still in POSITION 1, but using increased power compared to the previous attempt, 40 mW (see Fig. 5).
At 18.53 UTC, we switched it off. 
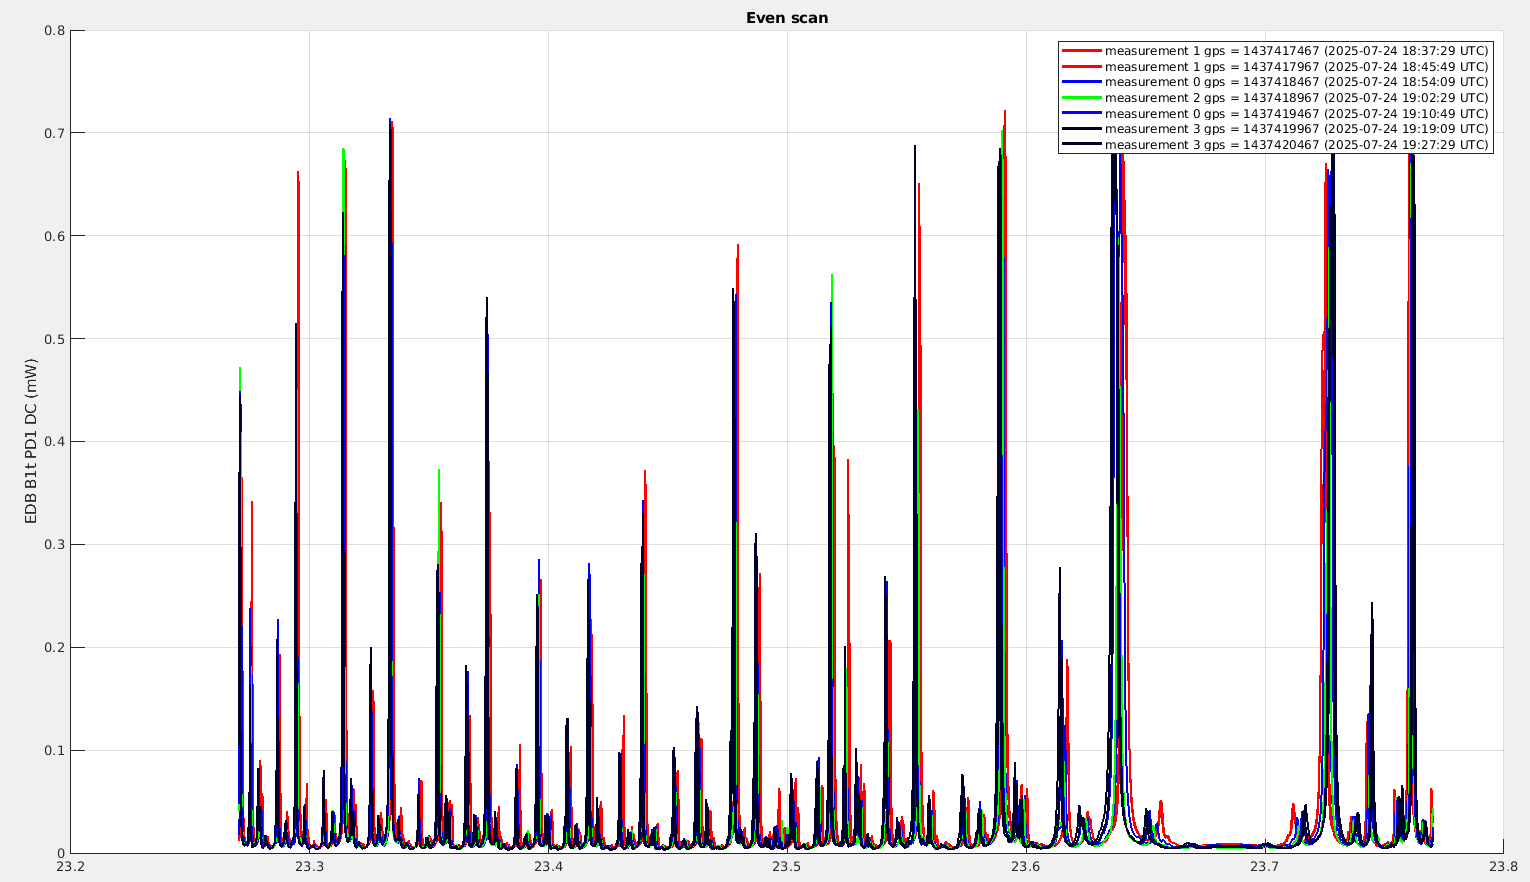
In this case the effect was clearly visible in the ITF signals (see Fig.6 )
Ten minutes after switching it off, we adjusted the horizontal position of the CO2 PA by acting on the  steering mirror.

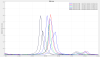
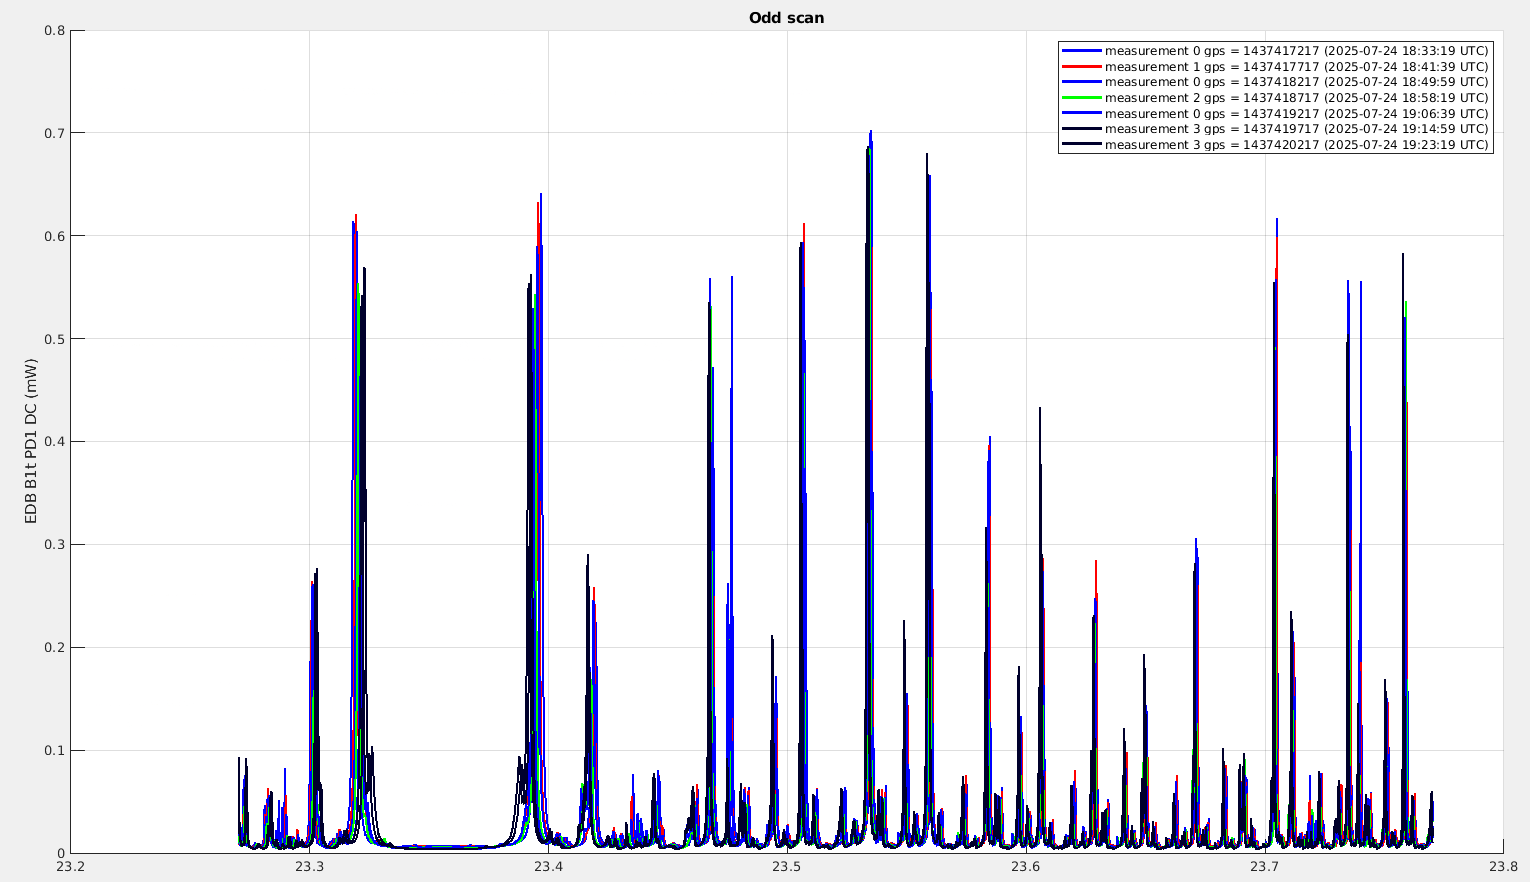
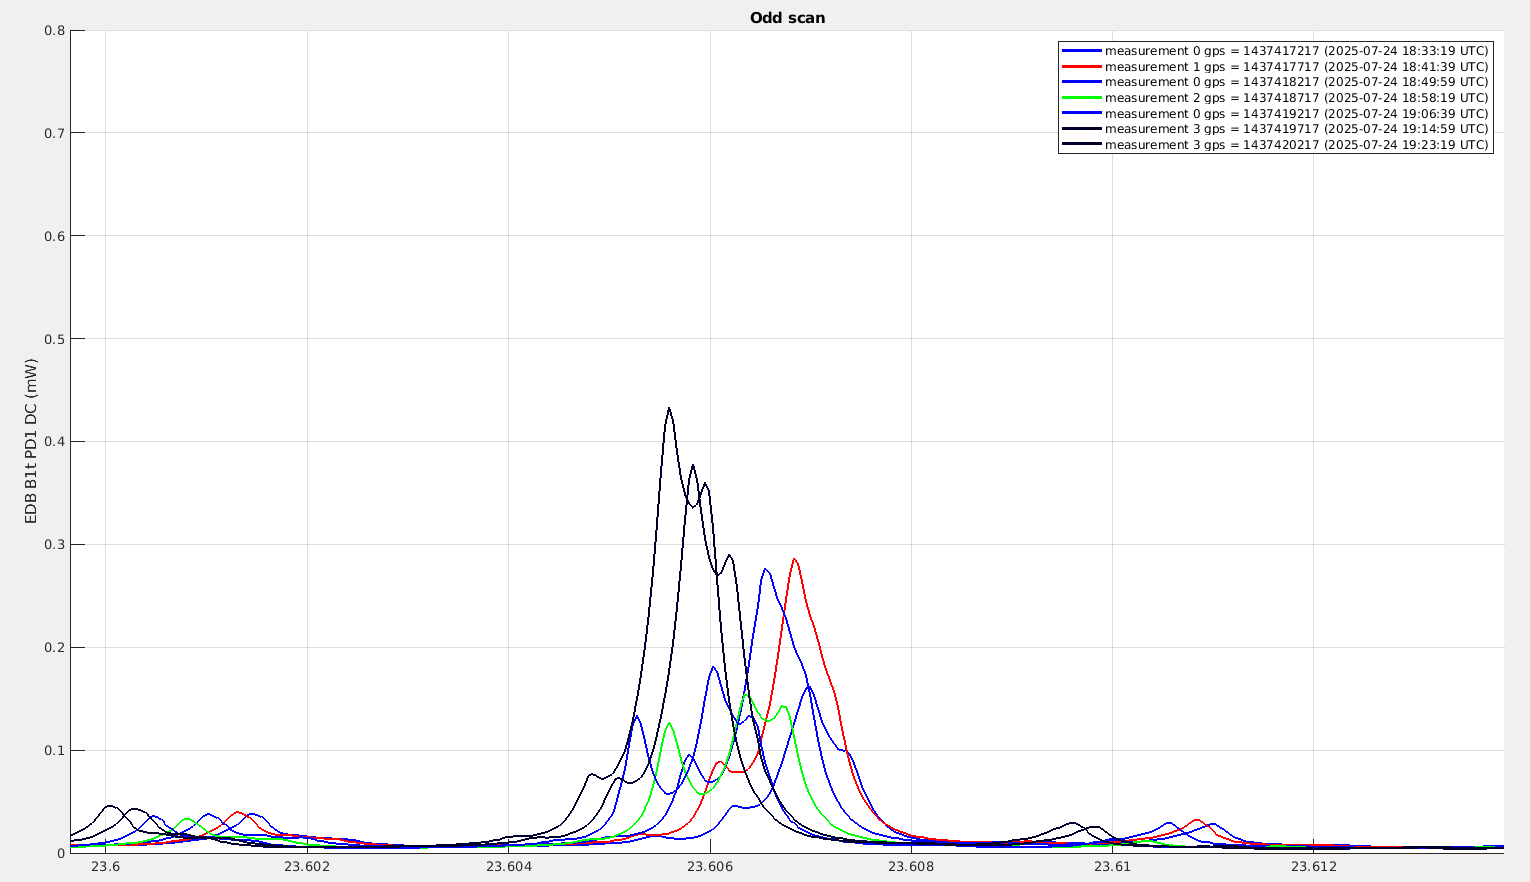
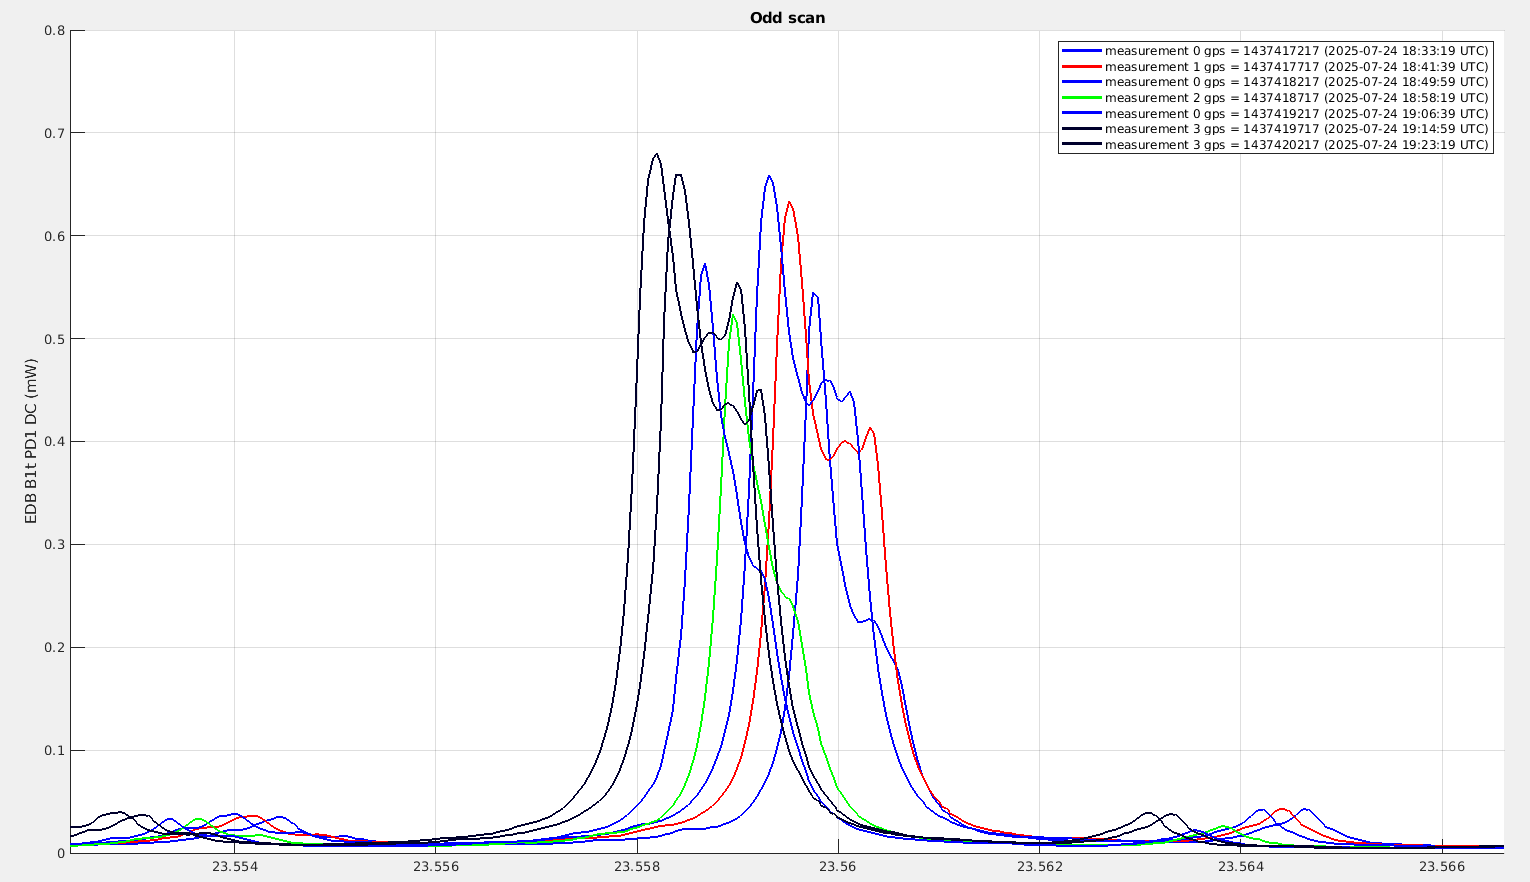
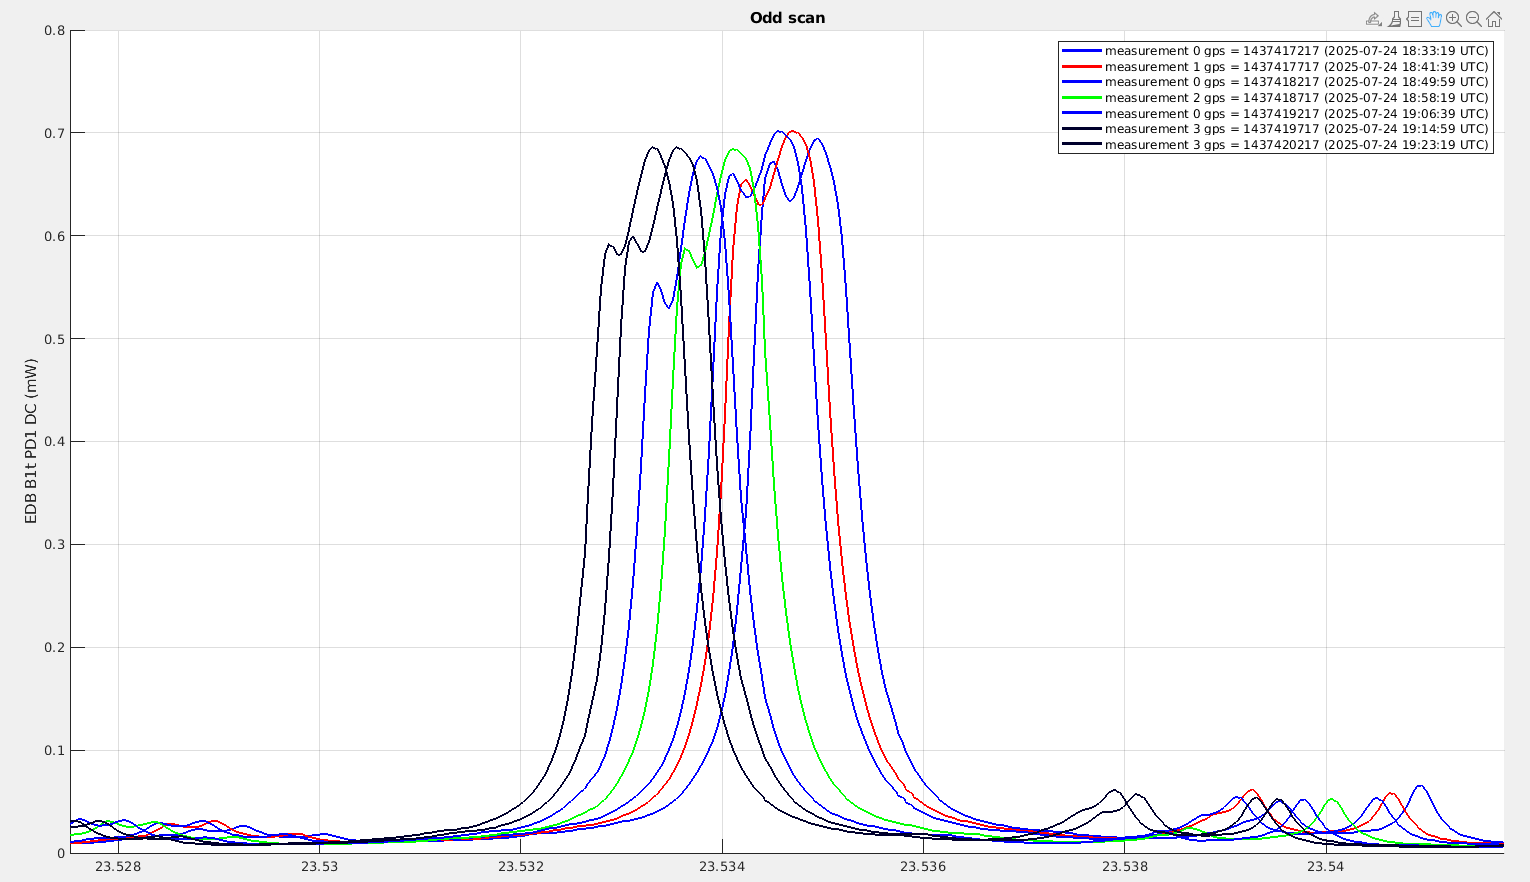
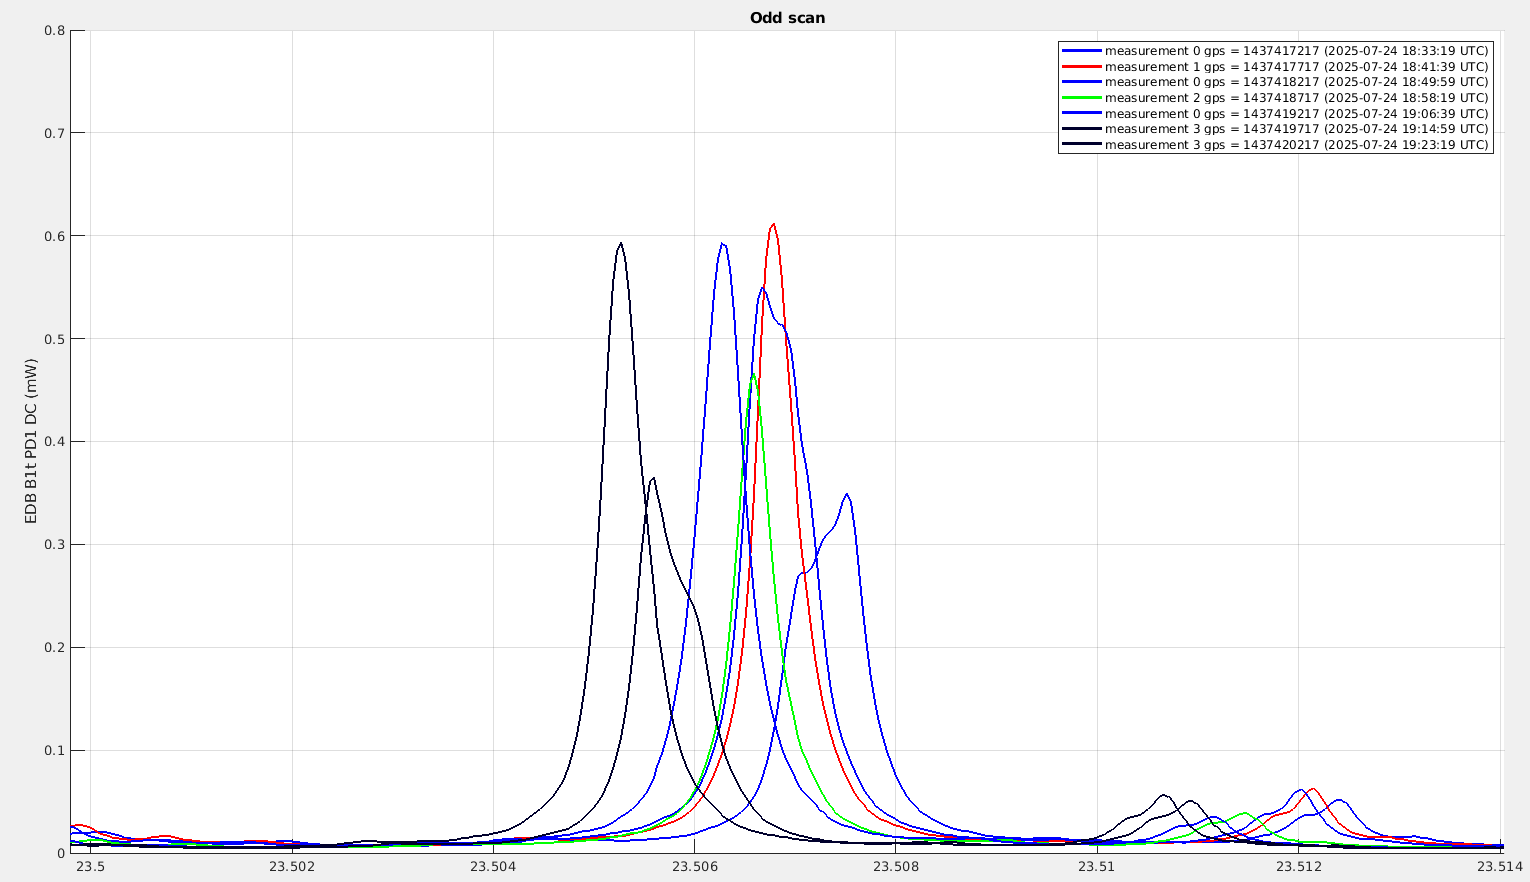
          2. CO2 PA applied in POSITION 2 (see Fig.7)
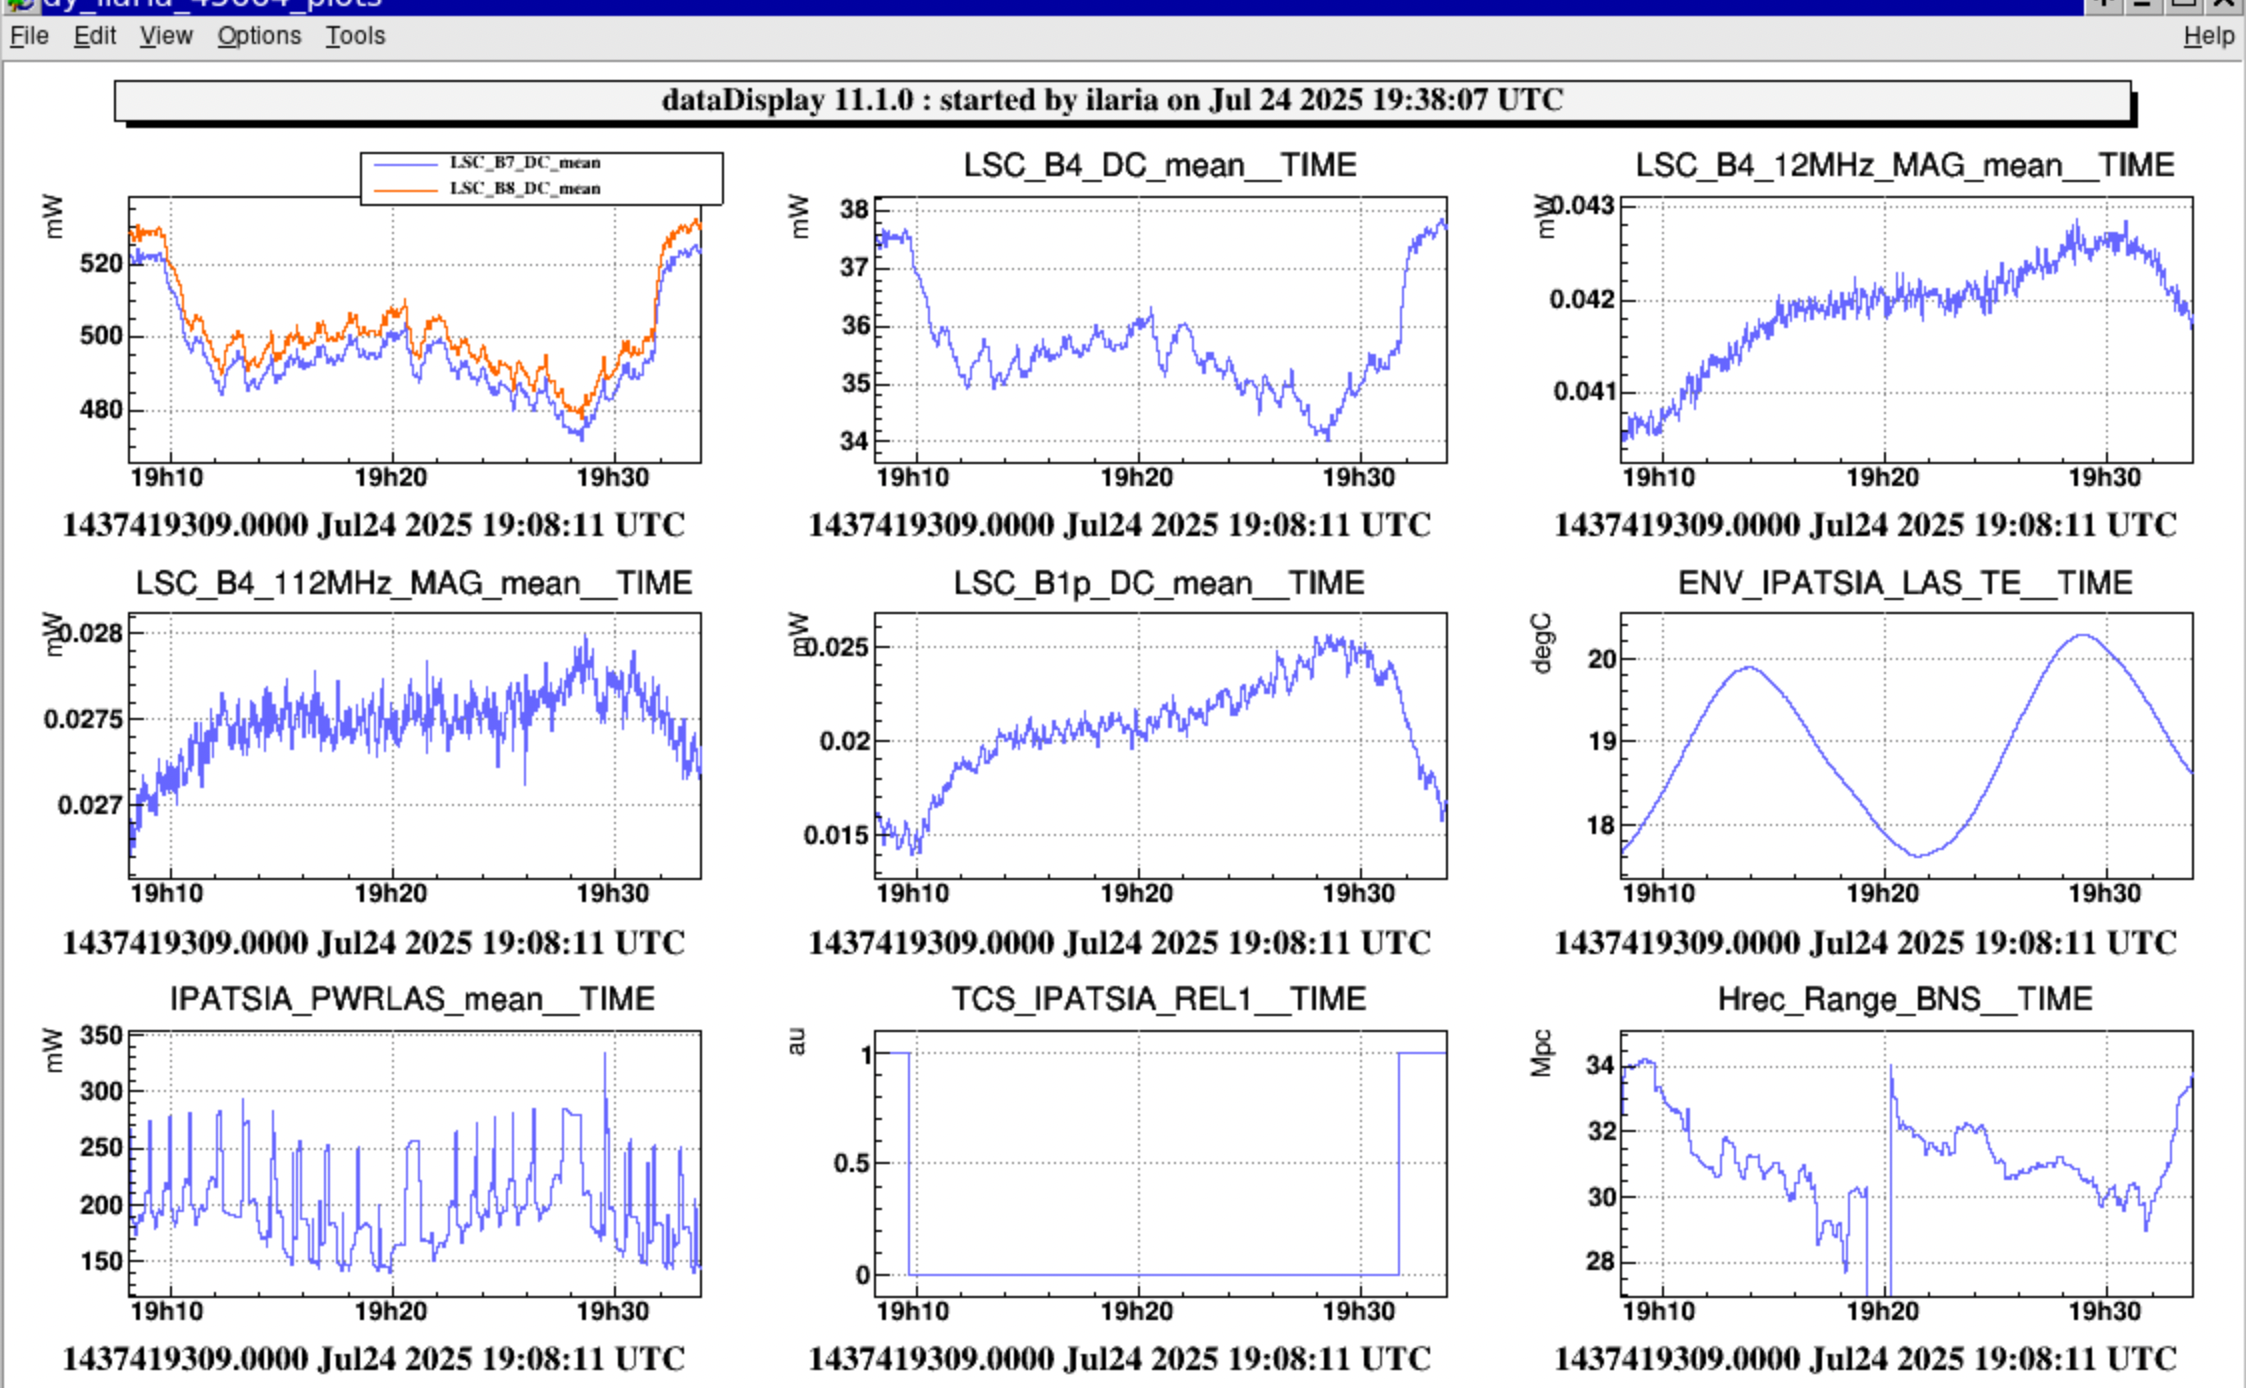
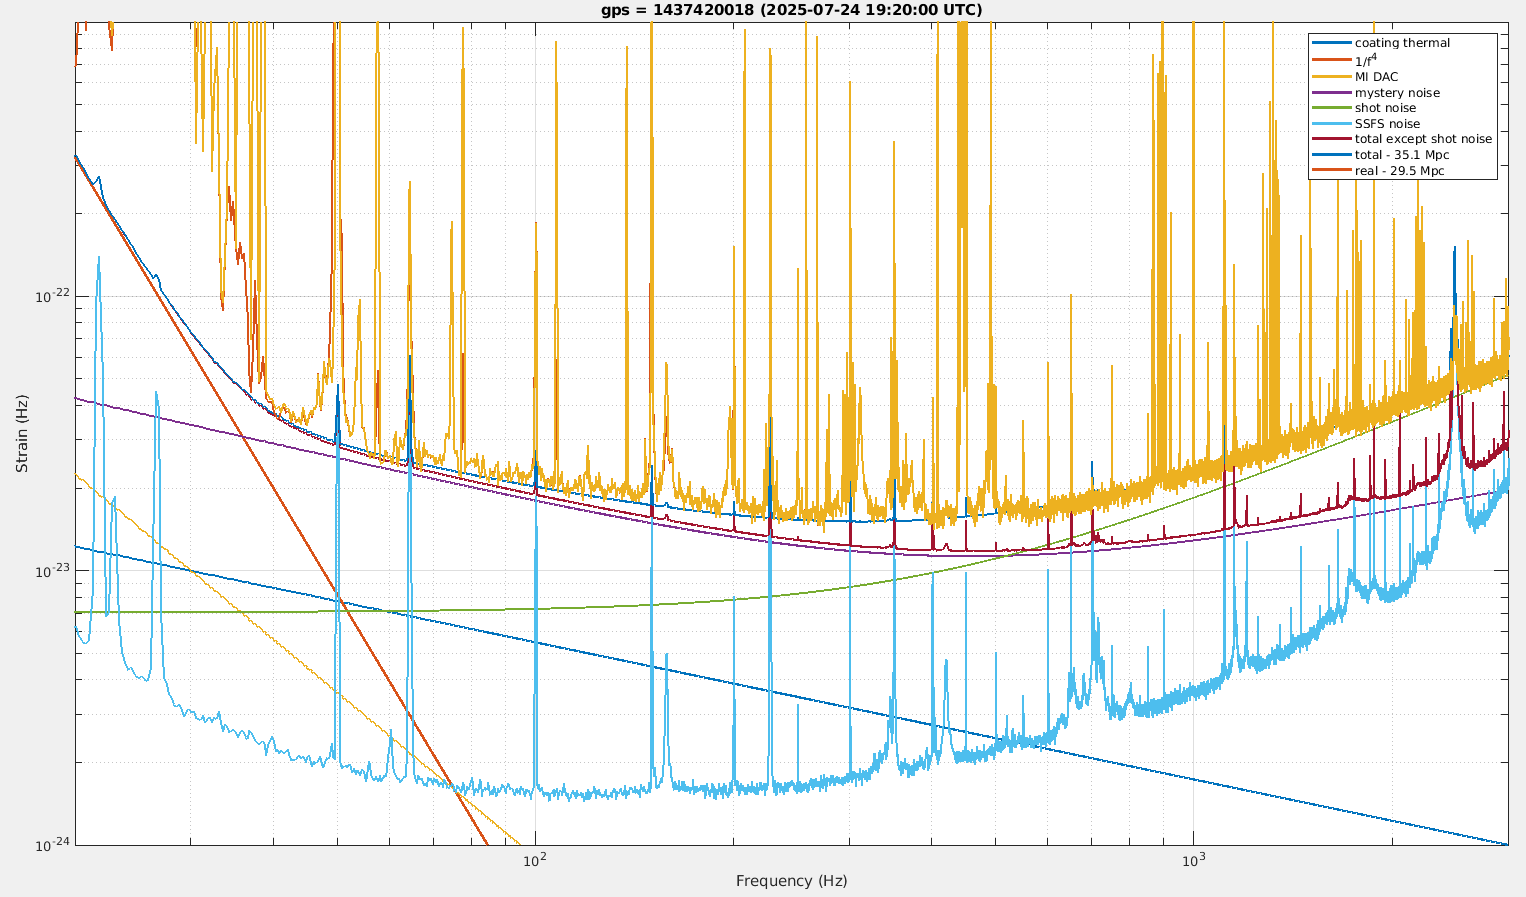
               At 19.09 UTC, the CO2 PA shined the HR-surface.
               At 19:31 UTC, the CO2 PA was switched off.

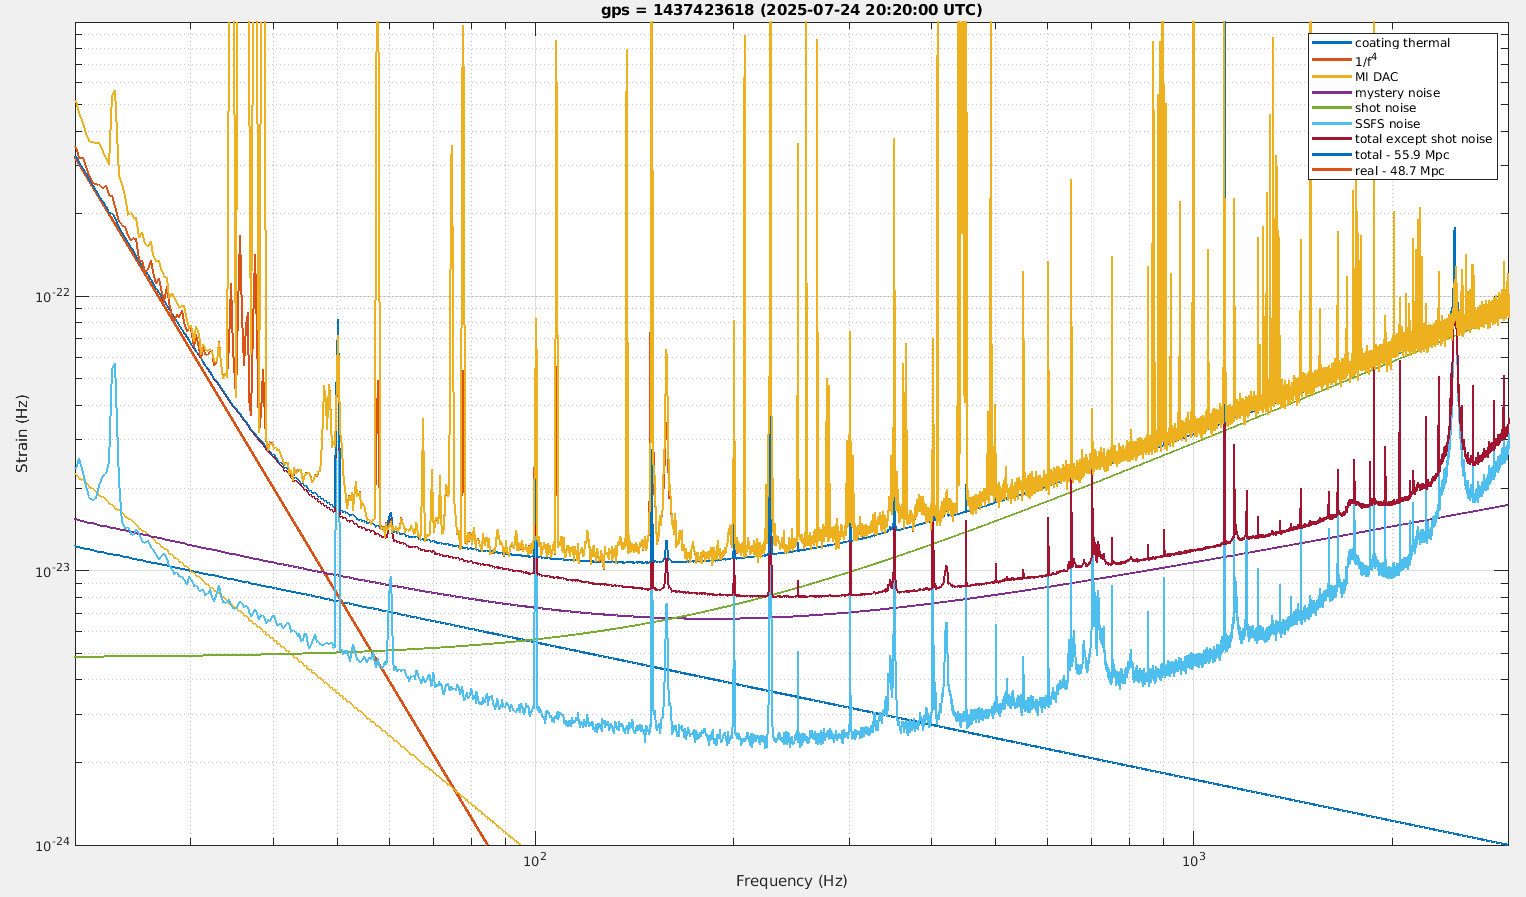
               The main ITF signals recorded during the shining period are shown in Fig. 8.
Ten minutes after switching off the CO2 laser, we carried out all the necessary operations to safely shut down the entire setup.

At 20:02 UTC, the ITF was in LN3 and Science Mode.

Images attached to this report
Comments to this report:
nardecchia, spinicelli - 12:17 Friday 25 July 2025 (67371) Print this report

A comparison of the sensitivity curves is shown in the attached figure.
The three curves correspond to:

  • the reference case without CO₂ PA (labelled REF),

  • the CO₂ PA in Position 1 (labelled Pos 1) ,

  • the CO₂ PA in Position 2 (labelled Pos 2) .

Images attached to this comment
mwas - 8:46 Monday 28 July 2025 (67382) Print this report

The EDB OMC was continously scanned during those measurements. As the scans are fast, they are not linear, but they are reproducible, but they have a different shape when moving up in temperature and down in temperature.

Figure 1 shows the odd scans (I haven't checked if that means up-going or down-going) with the 56MHz upper and lower sideband highlighted, along with the carrier order 1-11 modes. The lines are colored by wether they fall completely into a given state of IPATSiA. The red line is the first point of IPATSiA shining, the green line is the time with IPATSiA off, and the two black lines are the second point. The blue lines correspond to transition times, that is scans where the ~4 minutes of the scan straddles across to state, or overlaps with the ~3 minute thermal transition period after the IPATSiA beam is turned on or off. 

Figure 2 shows again the odd scans without the beam mode labels.

Figure 3 shows for comparison the same scans down two days before  https://logbook.virgo-gw.eu/virgo/?r=67360

One can flip between figure 2 and 3 and the most noticeable difference is in the increased amplitude of the order 6 and order 4 mode

Figure 4 shows the order 6 mode, which is high when IPATSiA is shinning for both points, more for the second one. And low when IPATSIA is off.

Figure 5 shows the order 4 mode, which is high when IPATSiA is shinning for both points, more for the second one. And low when IPATSIA is off.

Figure 6 shows the order 3 mode, which is stable and un-affected by IPATSiA

Figure 7 shows the order 2 mode, which is erratic, I can't see a pattern explaining the change in amplitude. All of the peaks are lower than during the scans two days before shown on figure 3.

Figure 8 Two days ago the order 2 mode had a stable amplitude

Figure 9 shows the even scans and Figure 10 the even scans two days before. The order 2 mode is just below 23.3 degrees. The pattern is similar as for the odd scans, with a clear increase in the order 4, 6 and 9 modes, that are correlated with when IPATSIA is turned on. The increase in the order 6 mode being higher for the second point than for the first point. There is no clear increase for the order 5 mode in these scans.

/users/mwas/OMC/EDB_OMC_fast_scan_20250724/EDB_OMC_fast_scan.m


Images attached to this comment
mwas - 14:20 Thursday 07 August 2025 (67456) Print this report

These are the best noise budget I could achieve for the data of July 24 during the latest IPATSiA test. In each case using the last 10 minutes of data of a given state of IPATSiA, in order to avoid the initial few minute transient from turing the power of IPATSiA on or off. The best shape to fit all the data had a slope of 1/f^0.55.

Figure 1 shows the noise budget for the first position (with 40mW of power)

Figure 2 shows the noise budget for the second position.

In both cases the plotted mystery noise level is the same, and it is 10% higher than in the case of LN2 data with IPATSiA off.

Figure 3 shows the noise budget for IPATSiA that was taken in between the two times shown in figure 1 and 2 

Figure 4 shows the noise budget for one hour after the IPATSiA test, with the interferometer back in LN3. Where the mystery noise is a factor 1.7 lower in terms of mW/rtHz, as expected from the change in HOM signal recycling gain.

Images attached to this comment
Search Help
×

Warning

Error

The present report has been modified outside this window. Please check for its integrity in the main page.

Refreshing this page will move this report into drafts.

×