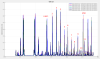
The EDB OMC was continously scanned during those measurements. As the scans are fast, they are not linear, but they are reproducible, but they have a different shape when moving up in temperature and down in temperature.
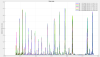
Figure 1 shows the odd scans (I haven't checked if that means up-going or down-going) with the 56MHz upper and lower sideband highlighted, along with the carrier order 1-11 modes. The lines are colored by wether they fall completely into a given state of IPATSiA. The red line is the first point of IPATSiA shining, the green line is the time with IPATSiA off, and the two black lines are the second point. The blue lines correspond to transition times, that is scans where the ~4 minutes of the scan straddles across to state, or overlaps with the ~3 minute thermal transition period after the IPATSiA beam is turned on or off.
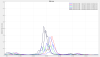
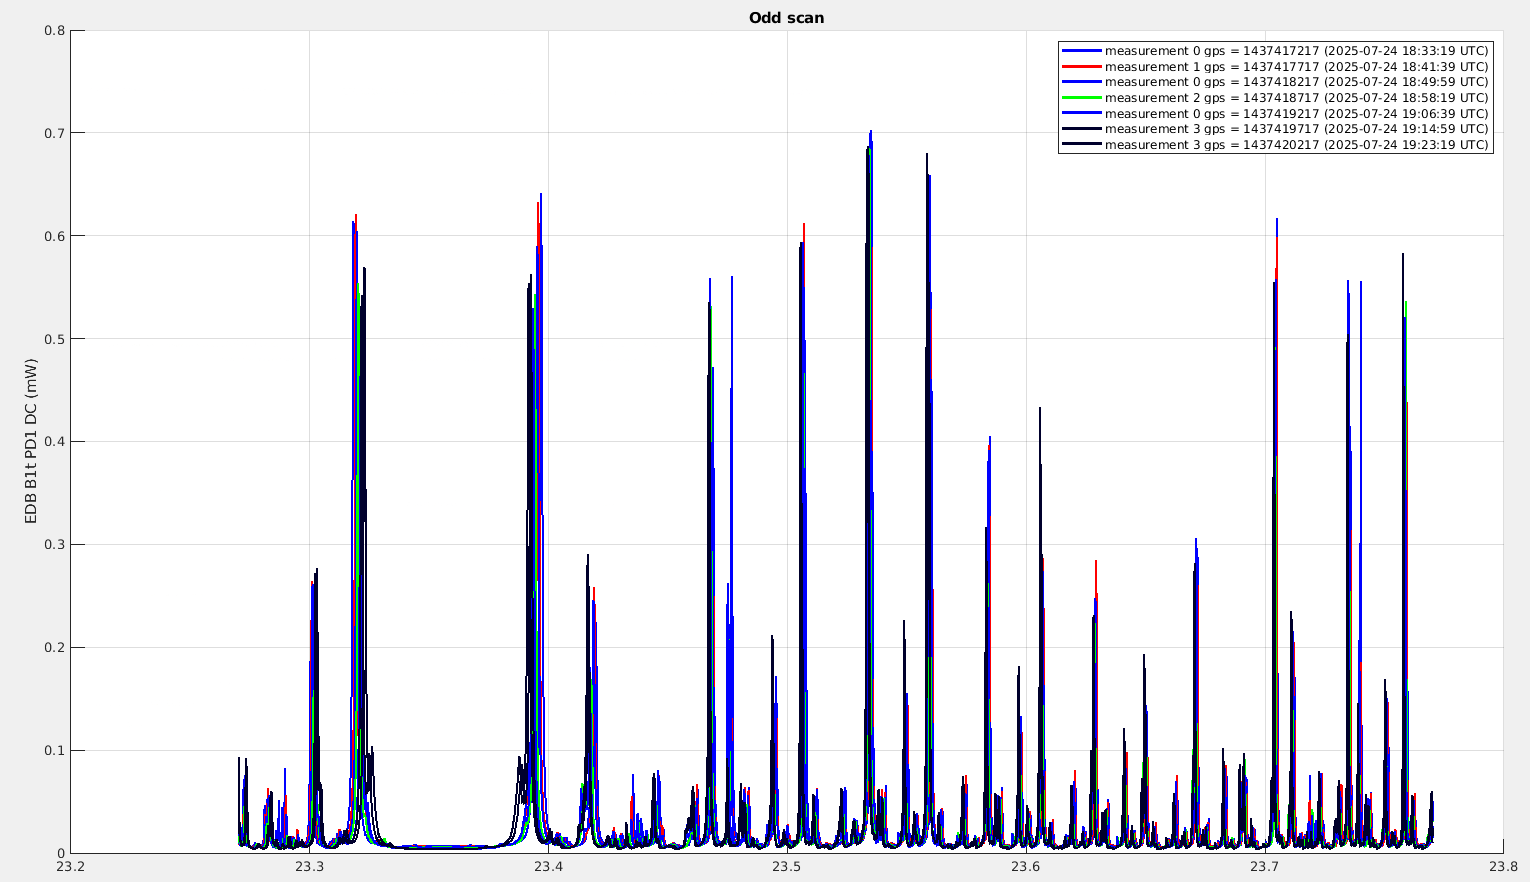
Figure 2 shows again the odd scans without the beam mode labels.
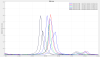
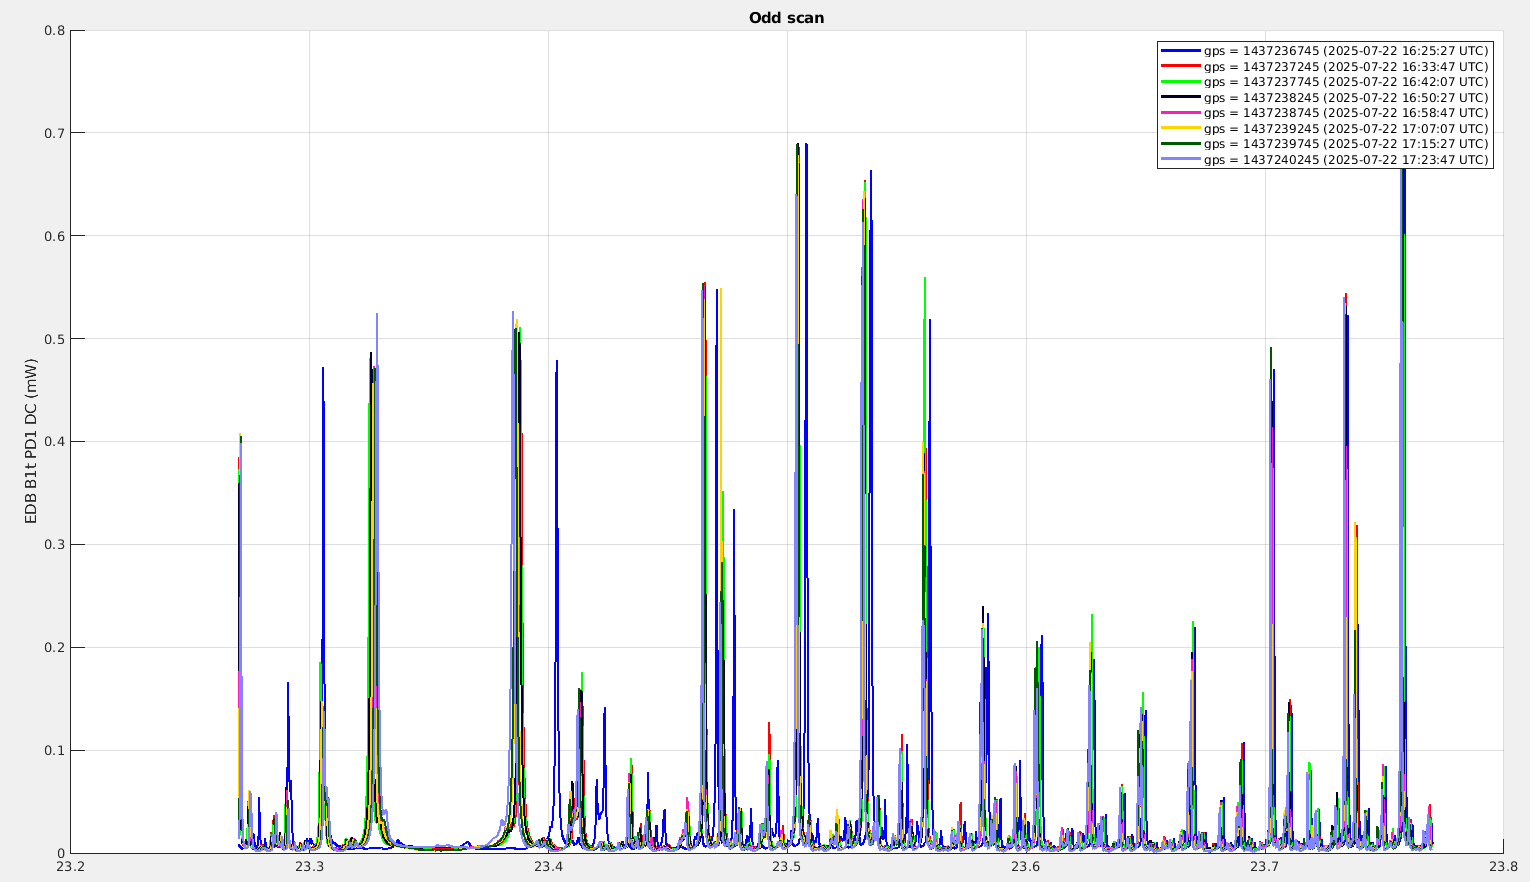
Figure 3 shows for comparison the same scans down two days before https://logbook.virgo-gw.eu/virgo/?r=67360.
One can flip between figure 2 and 3 and the most noticeable difference is in the increased amplitude of the order 6 and order 4 mode
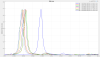
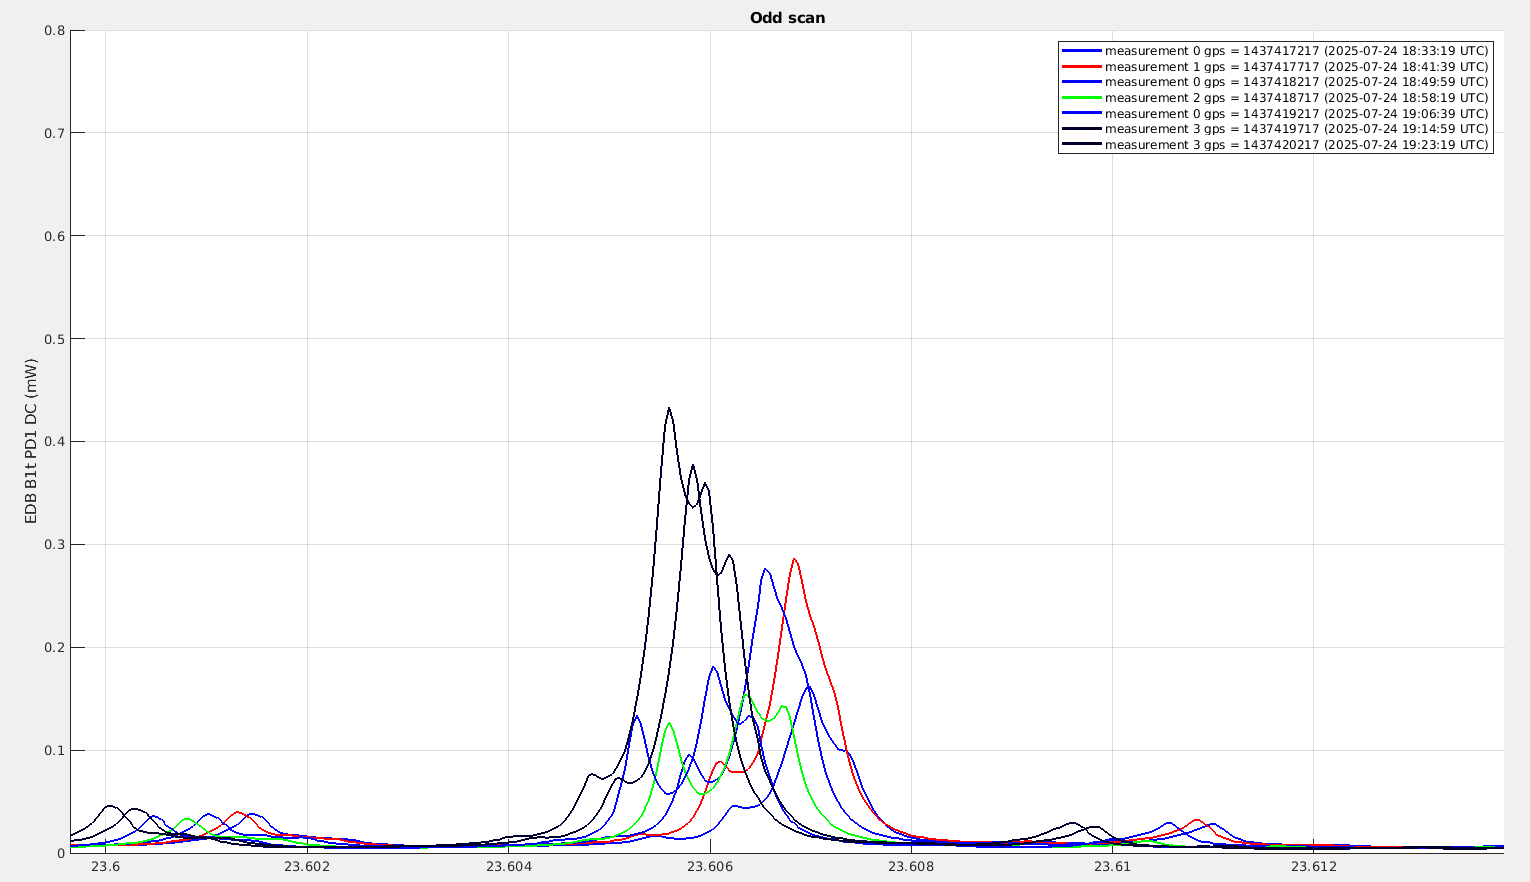
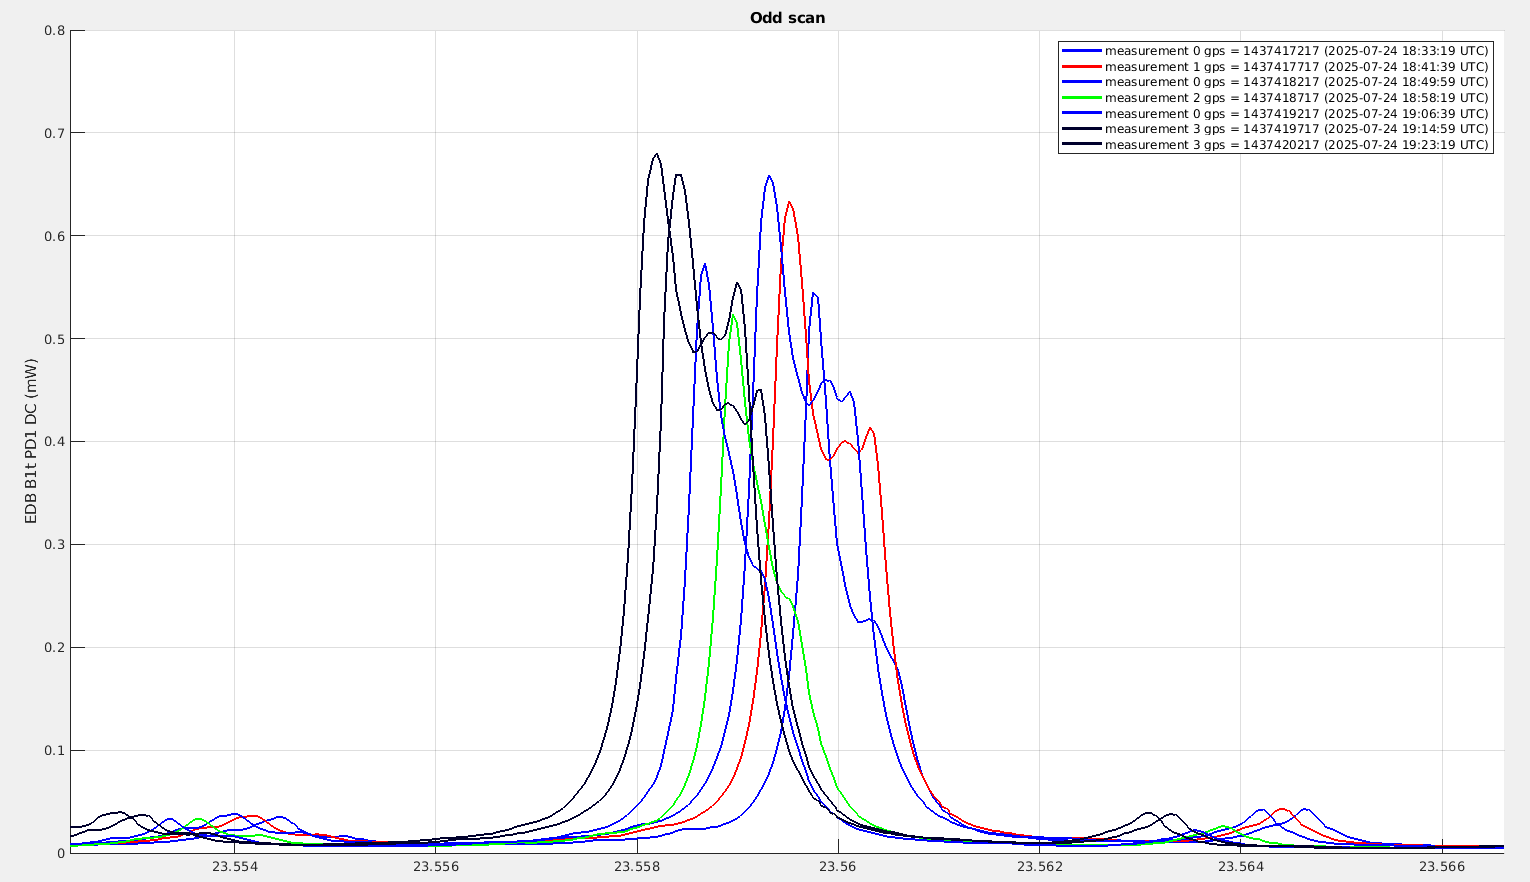
Figure 4 shows the order 6 mode, which is high when IPATSiA is shinning for both points, more for the second one. And low when IPATSIA is off.
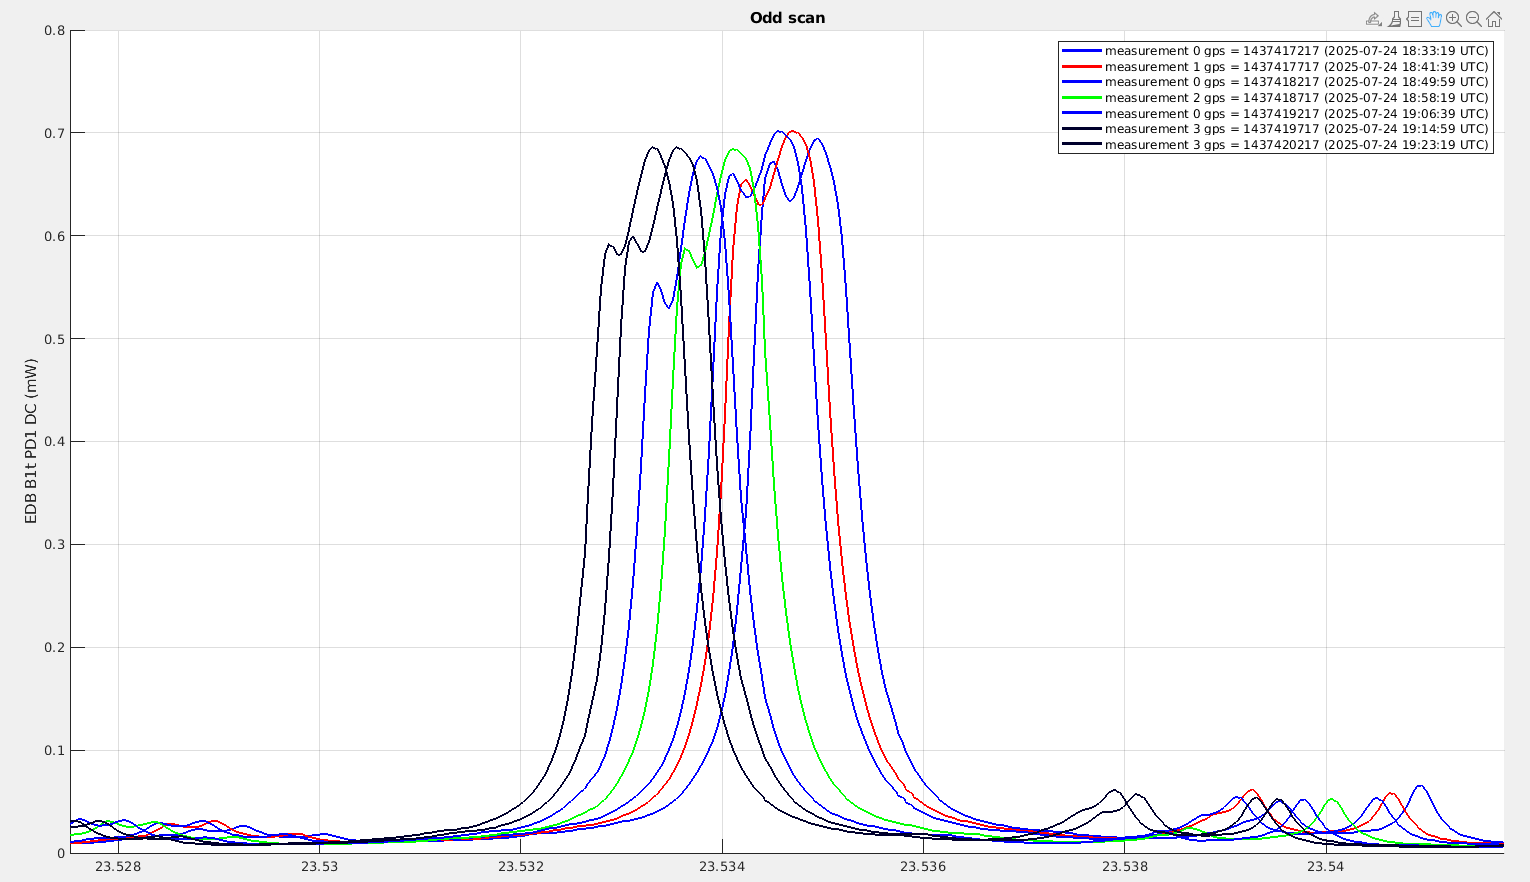
Figure 5 shows the order 4 mode, which is high when IPATSiA is shinning for both points, more for the second one. And low when IPATSIA is off.
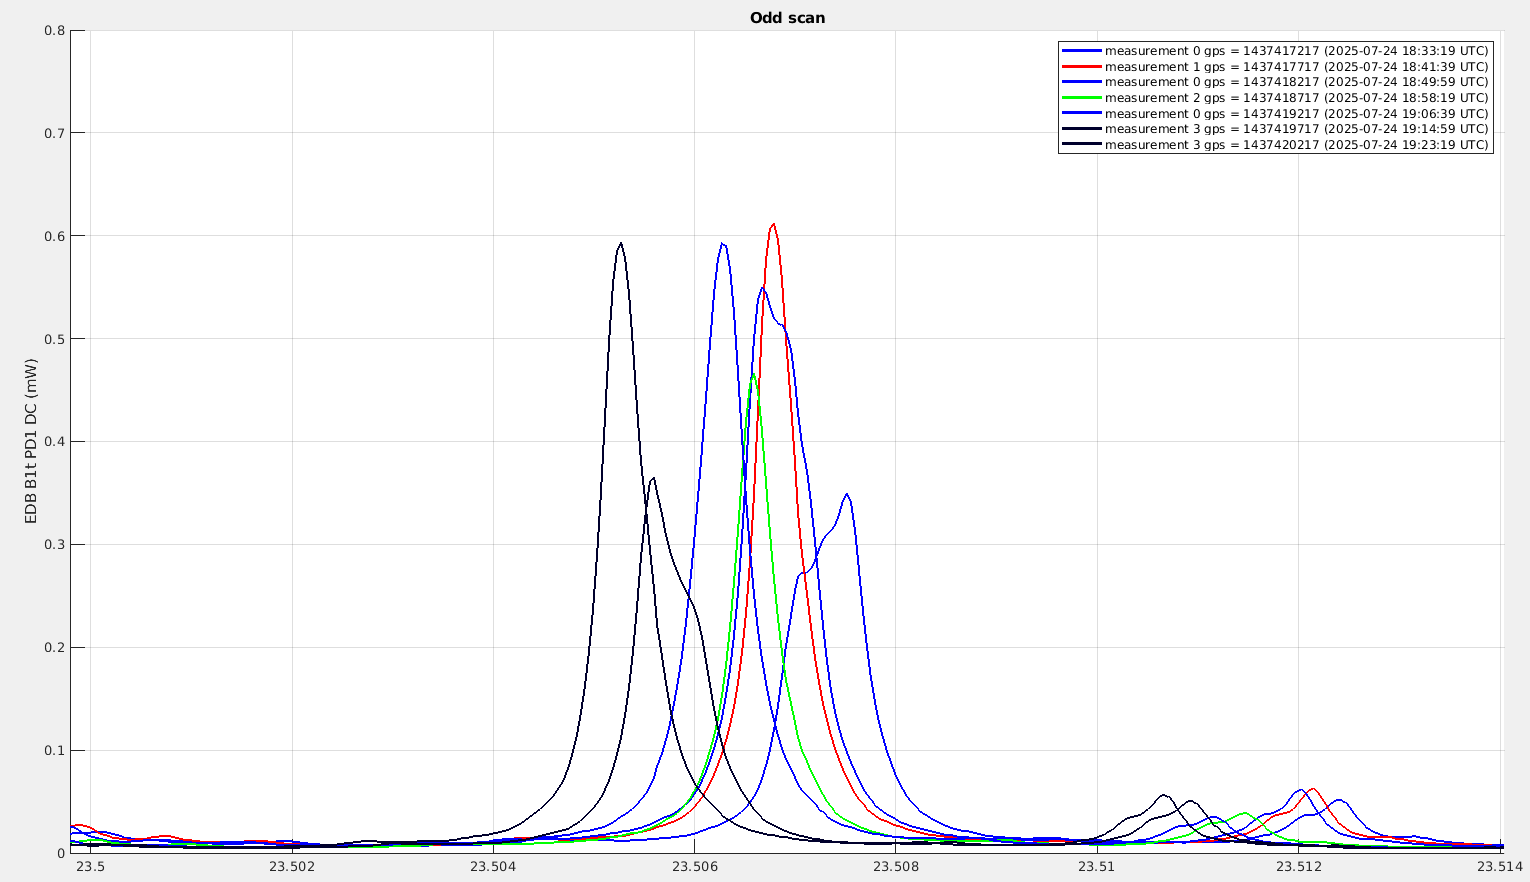
Figure 6 shows the order 3 mode, which is stable and un-affected by IPATSiA
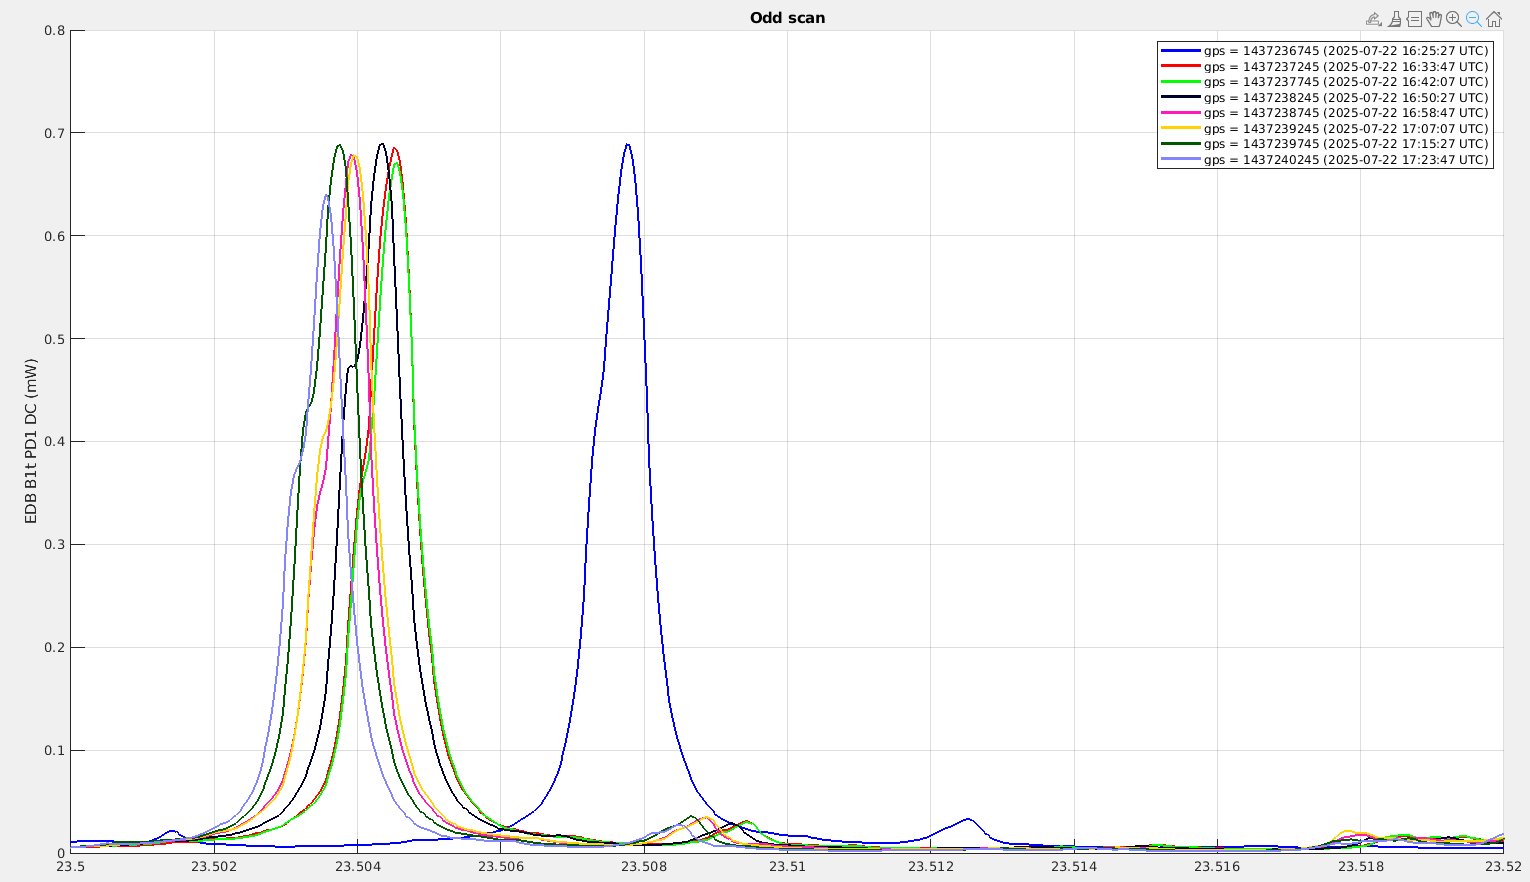
Figure 7 shows the order 2 mode, which is erratic, I can't see a pattern explaining the change in amplitude. All of the peaks are lower than during the scans two days before shown on figure 3.
Figure 8 Two days ago the order 2 mode had a stable amplitude
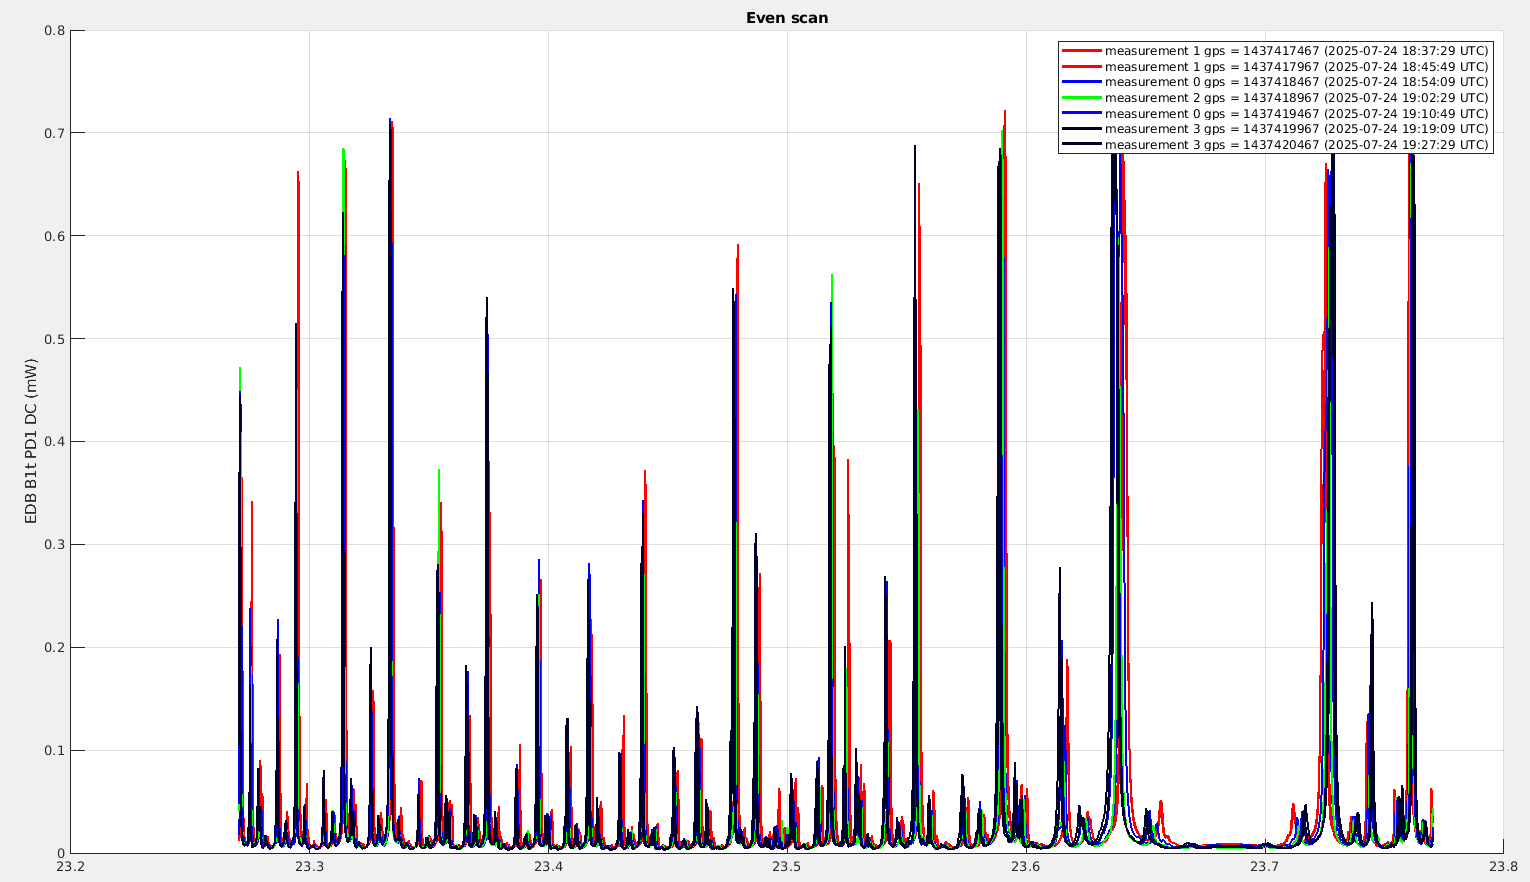
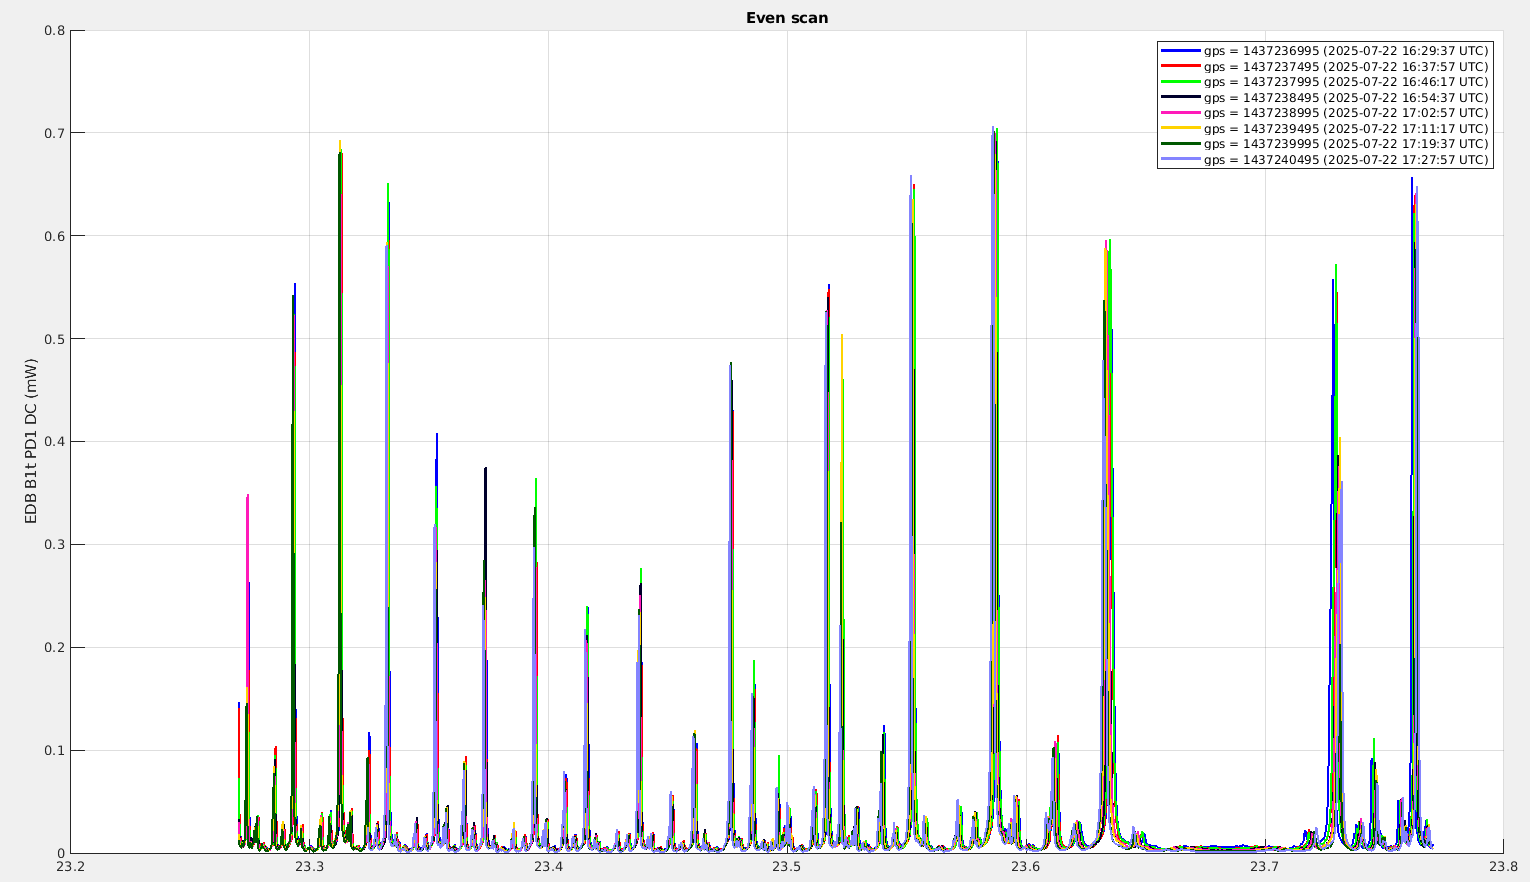
Figure 9 shows the even scans and Figure 10 the even scans two days before. The order 2 mode is just below 23.3 degrees. The pattern is similar as for the odd scans, with a clear increase in the order 4, 6 and 9 modes, that are correlated with when IPATSIA is turned on. The increase in the order 6 mode being higher for the second point than for the first point. There is no clear increase for the order 5 mode in these scans.
/users/mwas/OMC/EDB_OMC_fast_scan_20250724/EDB_OMC_fast_scan.m


