Yesterday when the interferometer was in LN2 I have realigned EDB OMC locking on 56MHz USB maximizing the transmitted power and then fine tuning by minimizing the beam jitter peaks. Most of the realignment was in TY.
Put a continous scan of the OMC EDB with frequency 0.002Hz, amplitude
0.5 degree, and starting point at 23.27 degree (about 0.1 degree below
the 56MHz USB in steady state)
Starting from 16:26 UTC the scan is with stable parameters (but may
not have a stable average temperature yet, so with drifts from one
sweep to the next)
The scan is fast and non-linear, so mode identification will need to
rely on peak counting. As a reference pattern there is the two close
relatively bright peaks of the 56MHz LSB and the carrier order 1
mode. It Happens around 23.45 degrees for upgoing scans.
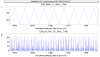
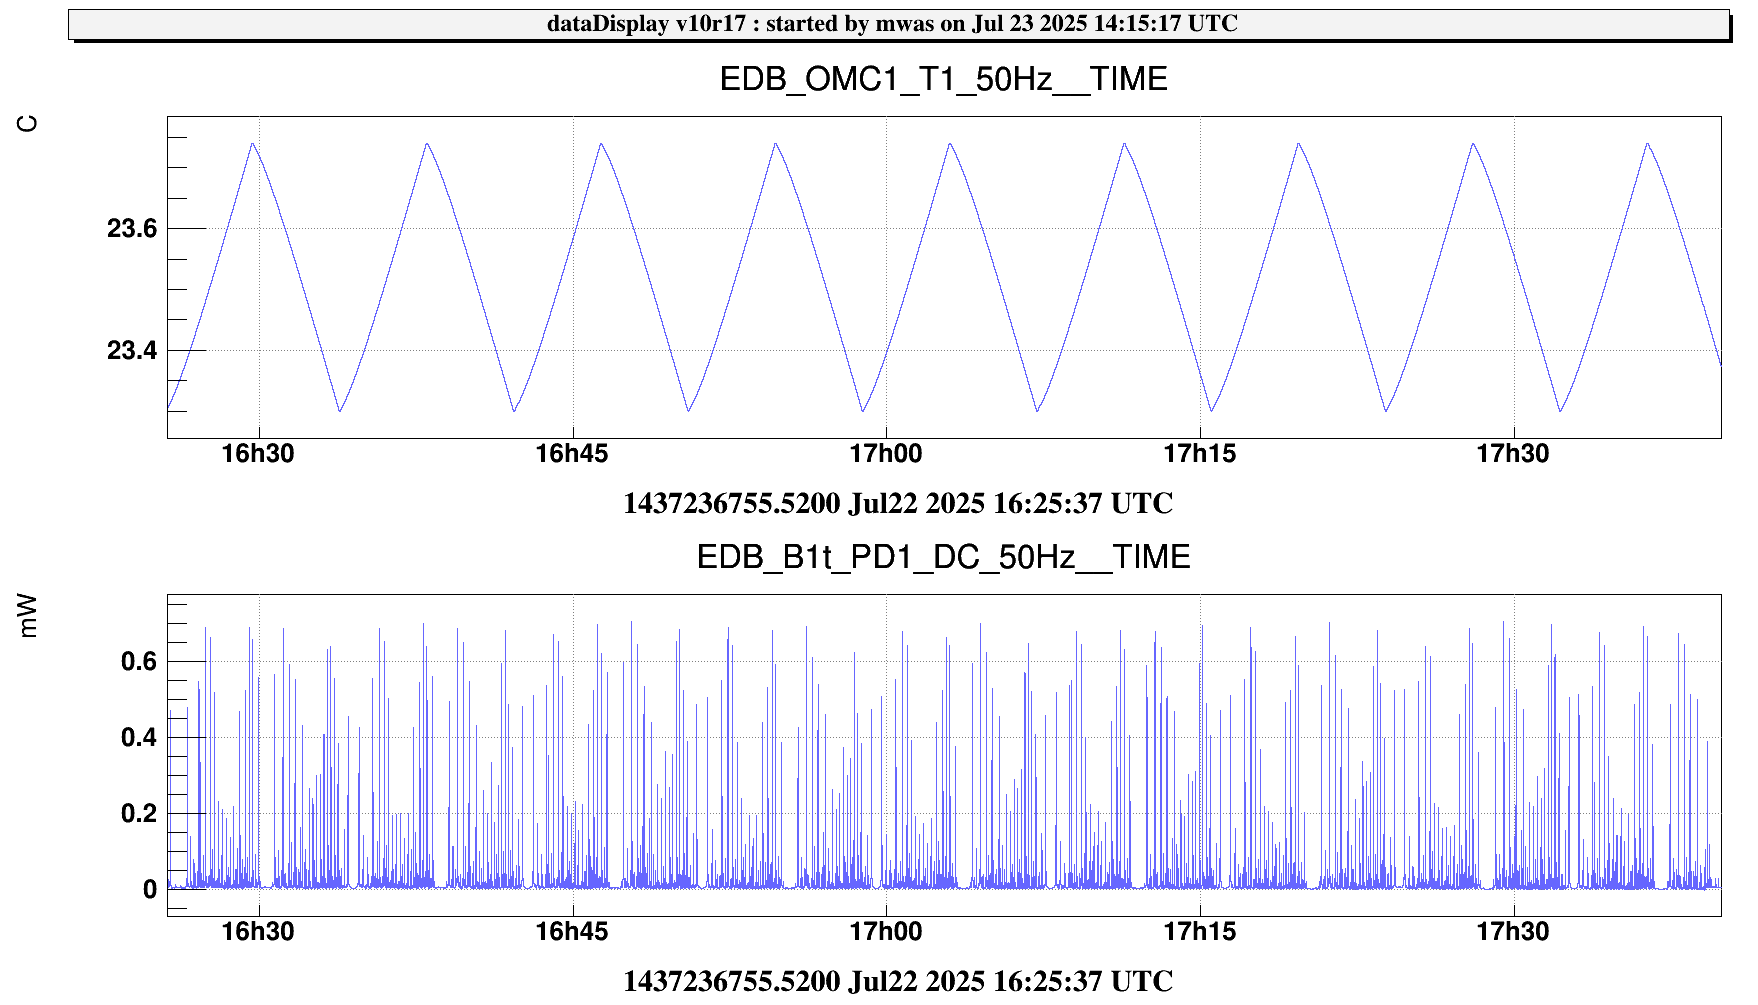
Figure 1 shows the time series of the scan
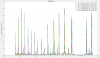
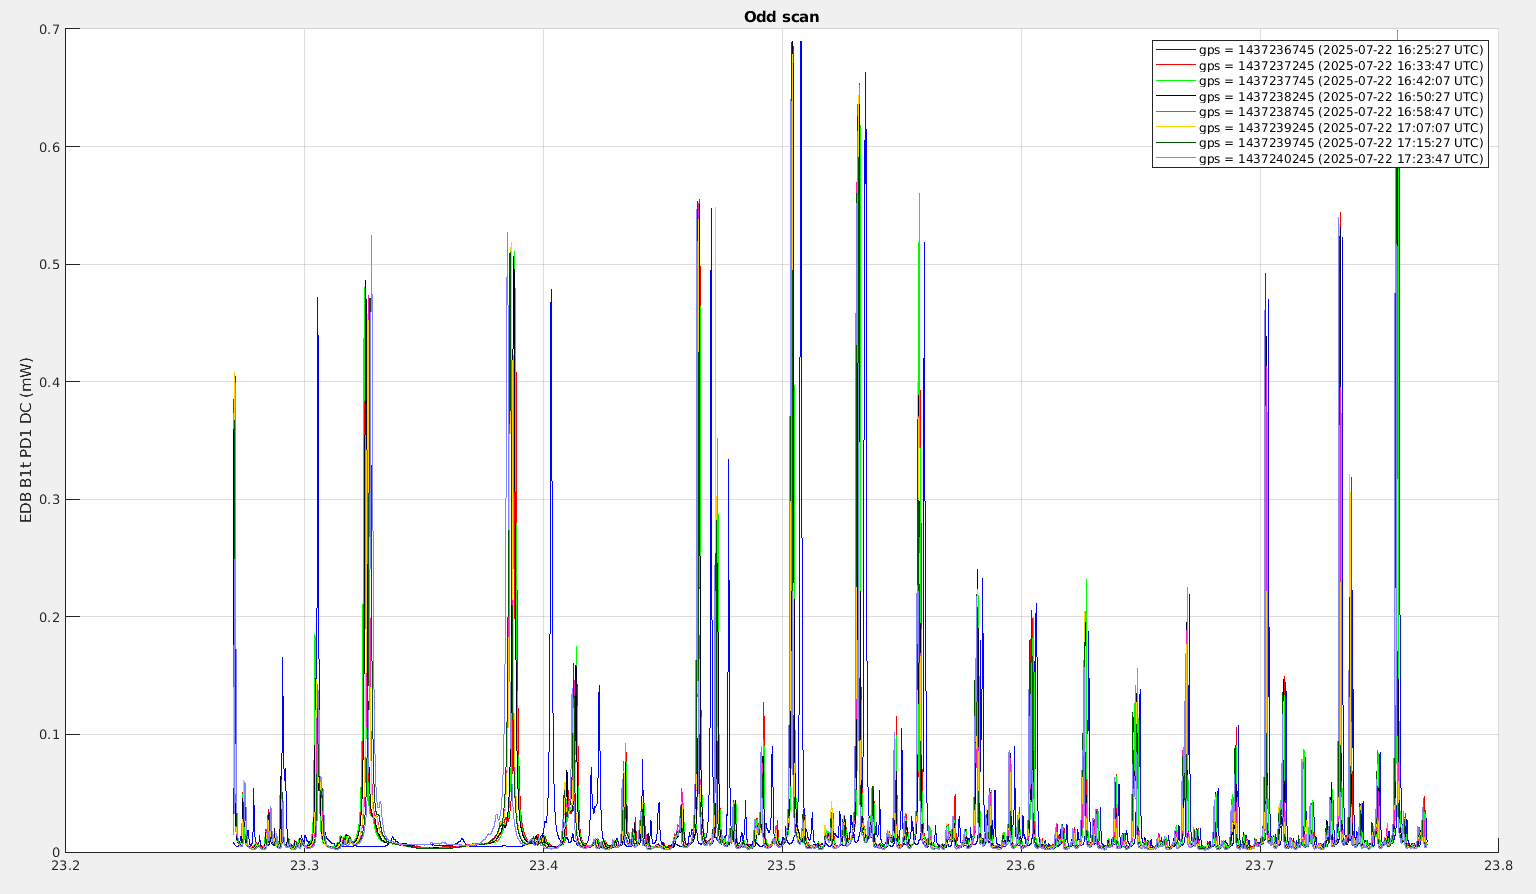
Figure 2 wraps it around in temperature, with one color per scan, counting only the odd scans (as the FSR looks different for upgoing and downgoing scans due to the lag in temperature between the thermistance and the OMC itself). The pair of order 1 mode and 56MHz LSB is visible at ~23.47 and ~23.73. The time in the legend denotes the time of the beginning of the stretch of data shown.
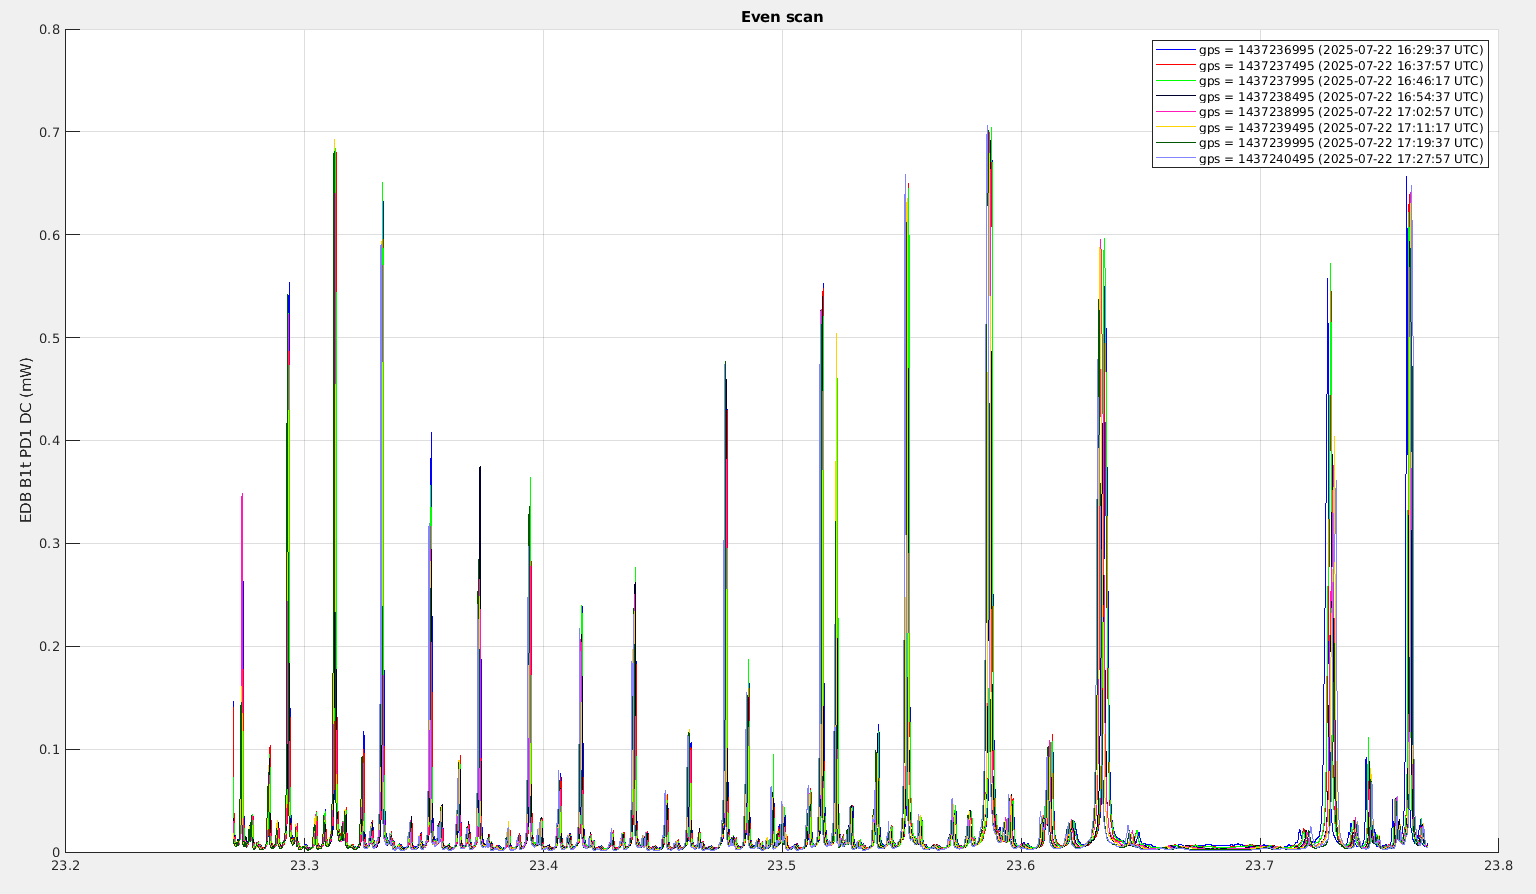
Figure 3 shows the same for the even scans, the order 1 mode / 56MHz LSB pair of peaks is visible at ~23.52.
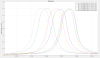
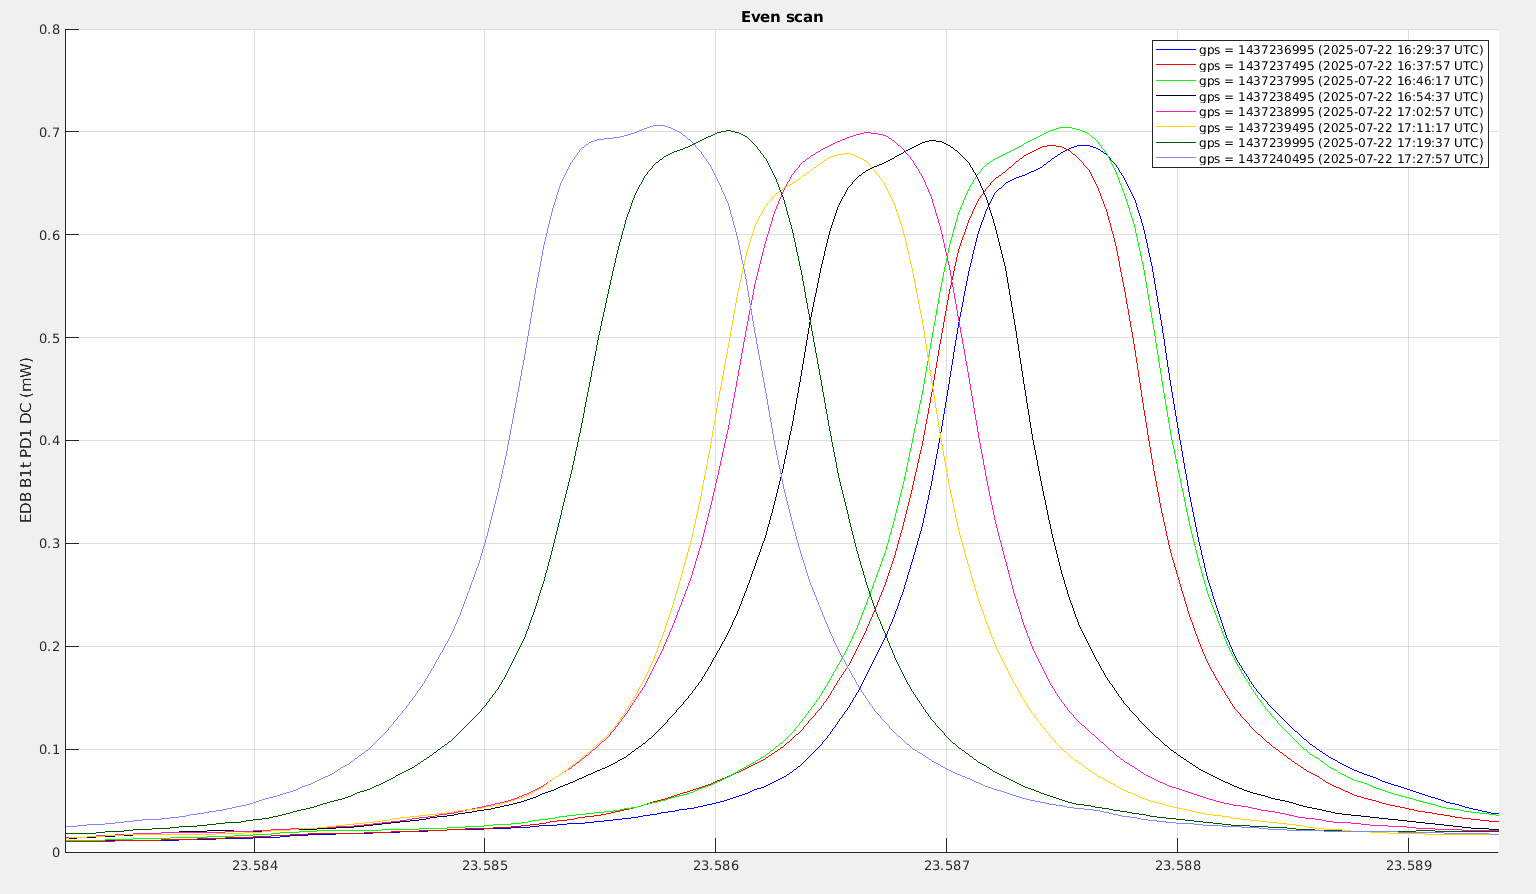
Many of the modes are stable in amplitude, for example the mode order 3 is shown on figure 4.
I will launch the same continous EDB OMC scan during the next IPATSiA shift, so that we can monitor if some of the HOM change in amplitude significantly. The data here can serve as a reference point for comparison, to check if a mode is normally stable in amplitude or not.
/users/mwas/OMC/EDB_OMC_fast_scan_20250722/EDB_OMC_SCAN.m
