Reports 1-1 of 1 Clear search Modify search
Detector Characterisation (Spectral lines)
verkindt - 12:31 Thursday 21 December 2023 (62812) Print this report
Contribution of spectral lines to BNS range

Taking the sensitivities for the two GPS times mentioned in https://logbook.virgo-gw.eu/virgo/?r=62800 and taking the lines listed in https://logbook.virgo-gw.eu/virgo/?r=62796 , I looked at the BNS range change if those lines were "dirtily" removed (using  simple linear interpolation).
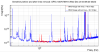
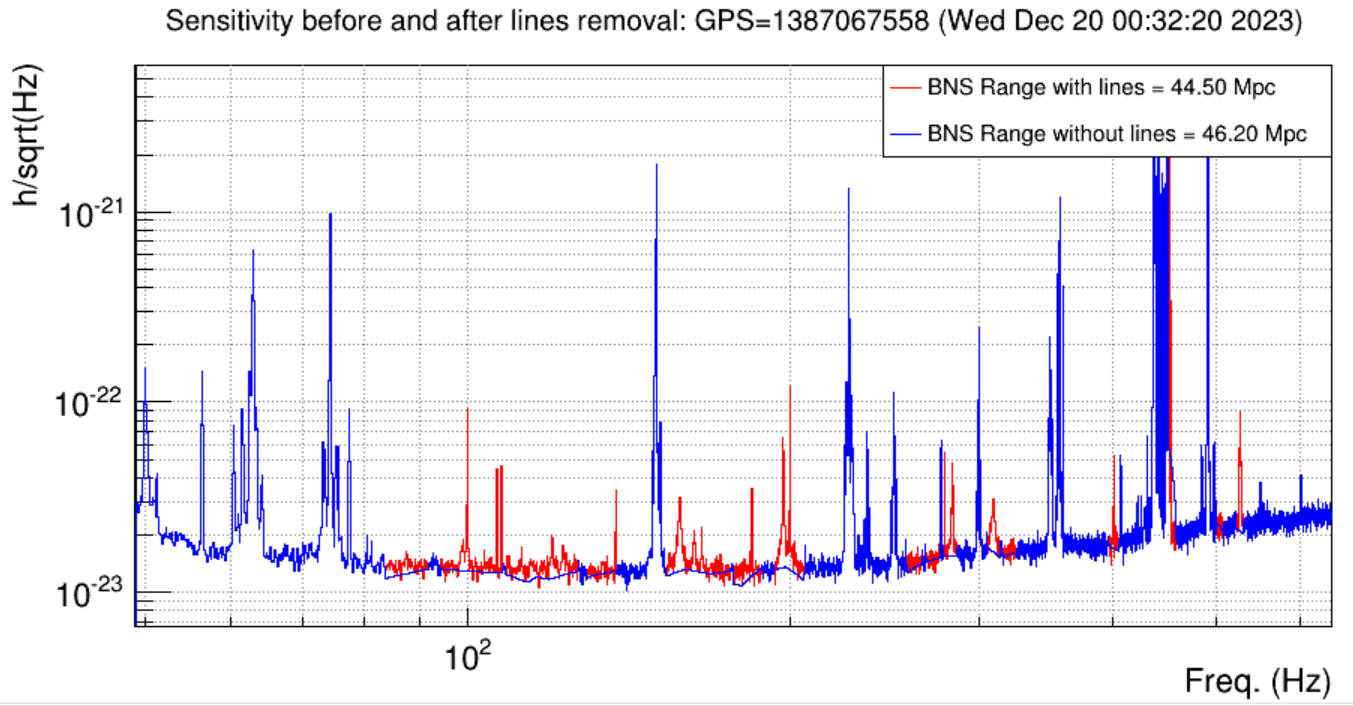
Plot1 is for GPS=1387067558 where the mean BNS range was around 44 Mpc : total contribution of the lines was 1.69 Mpc
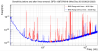
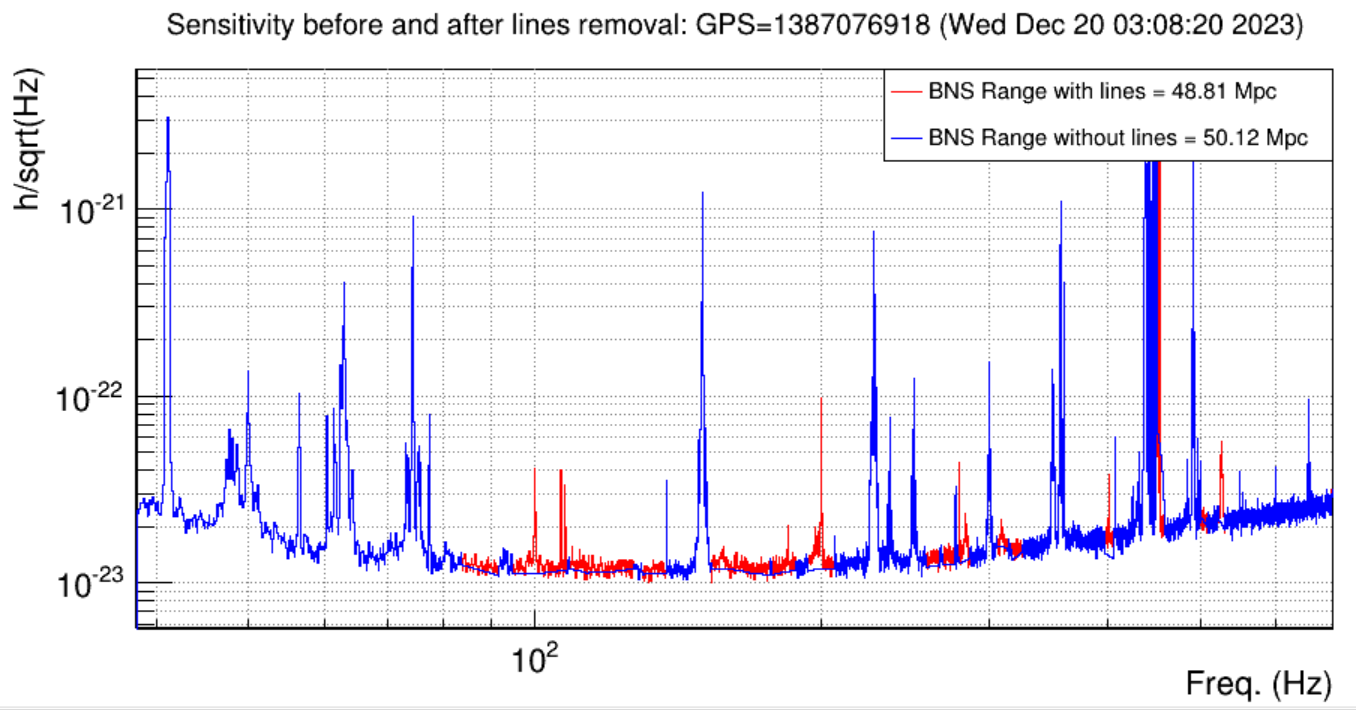
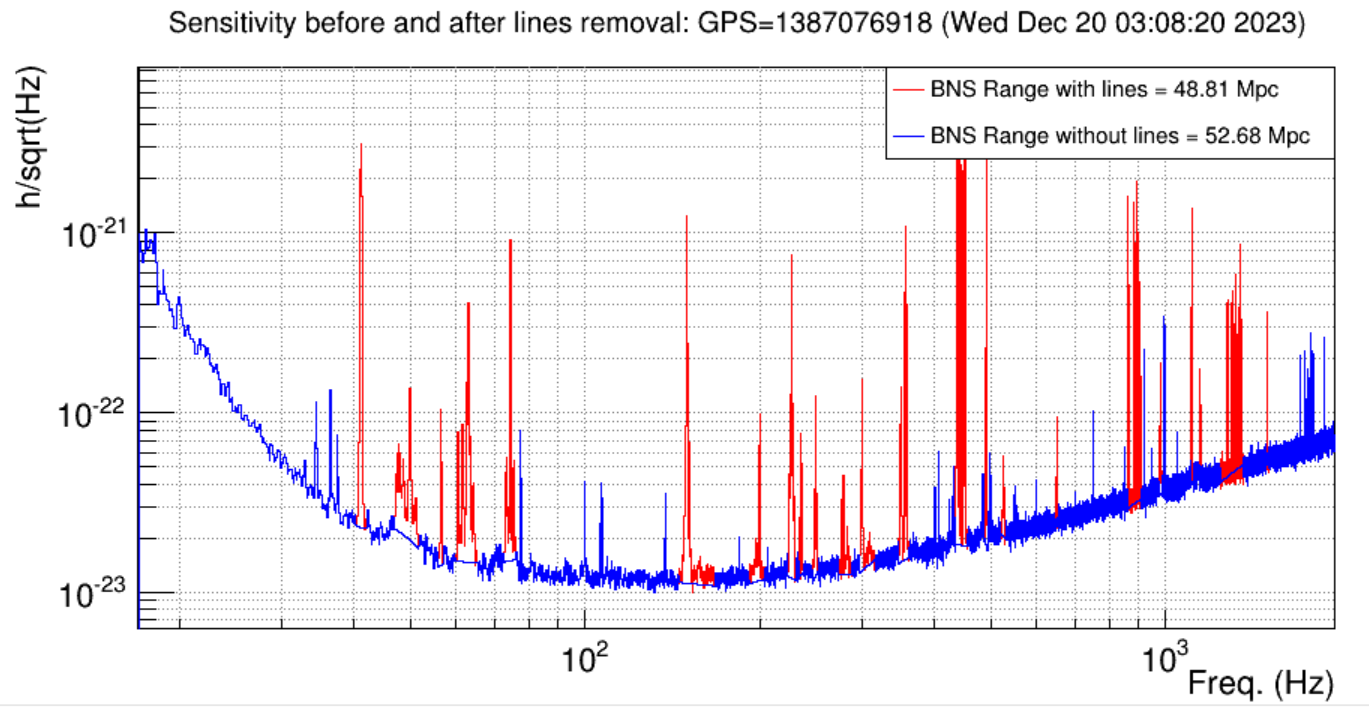
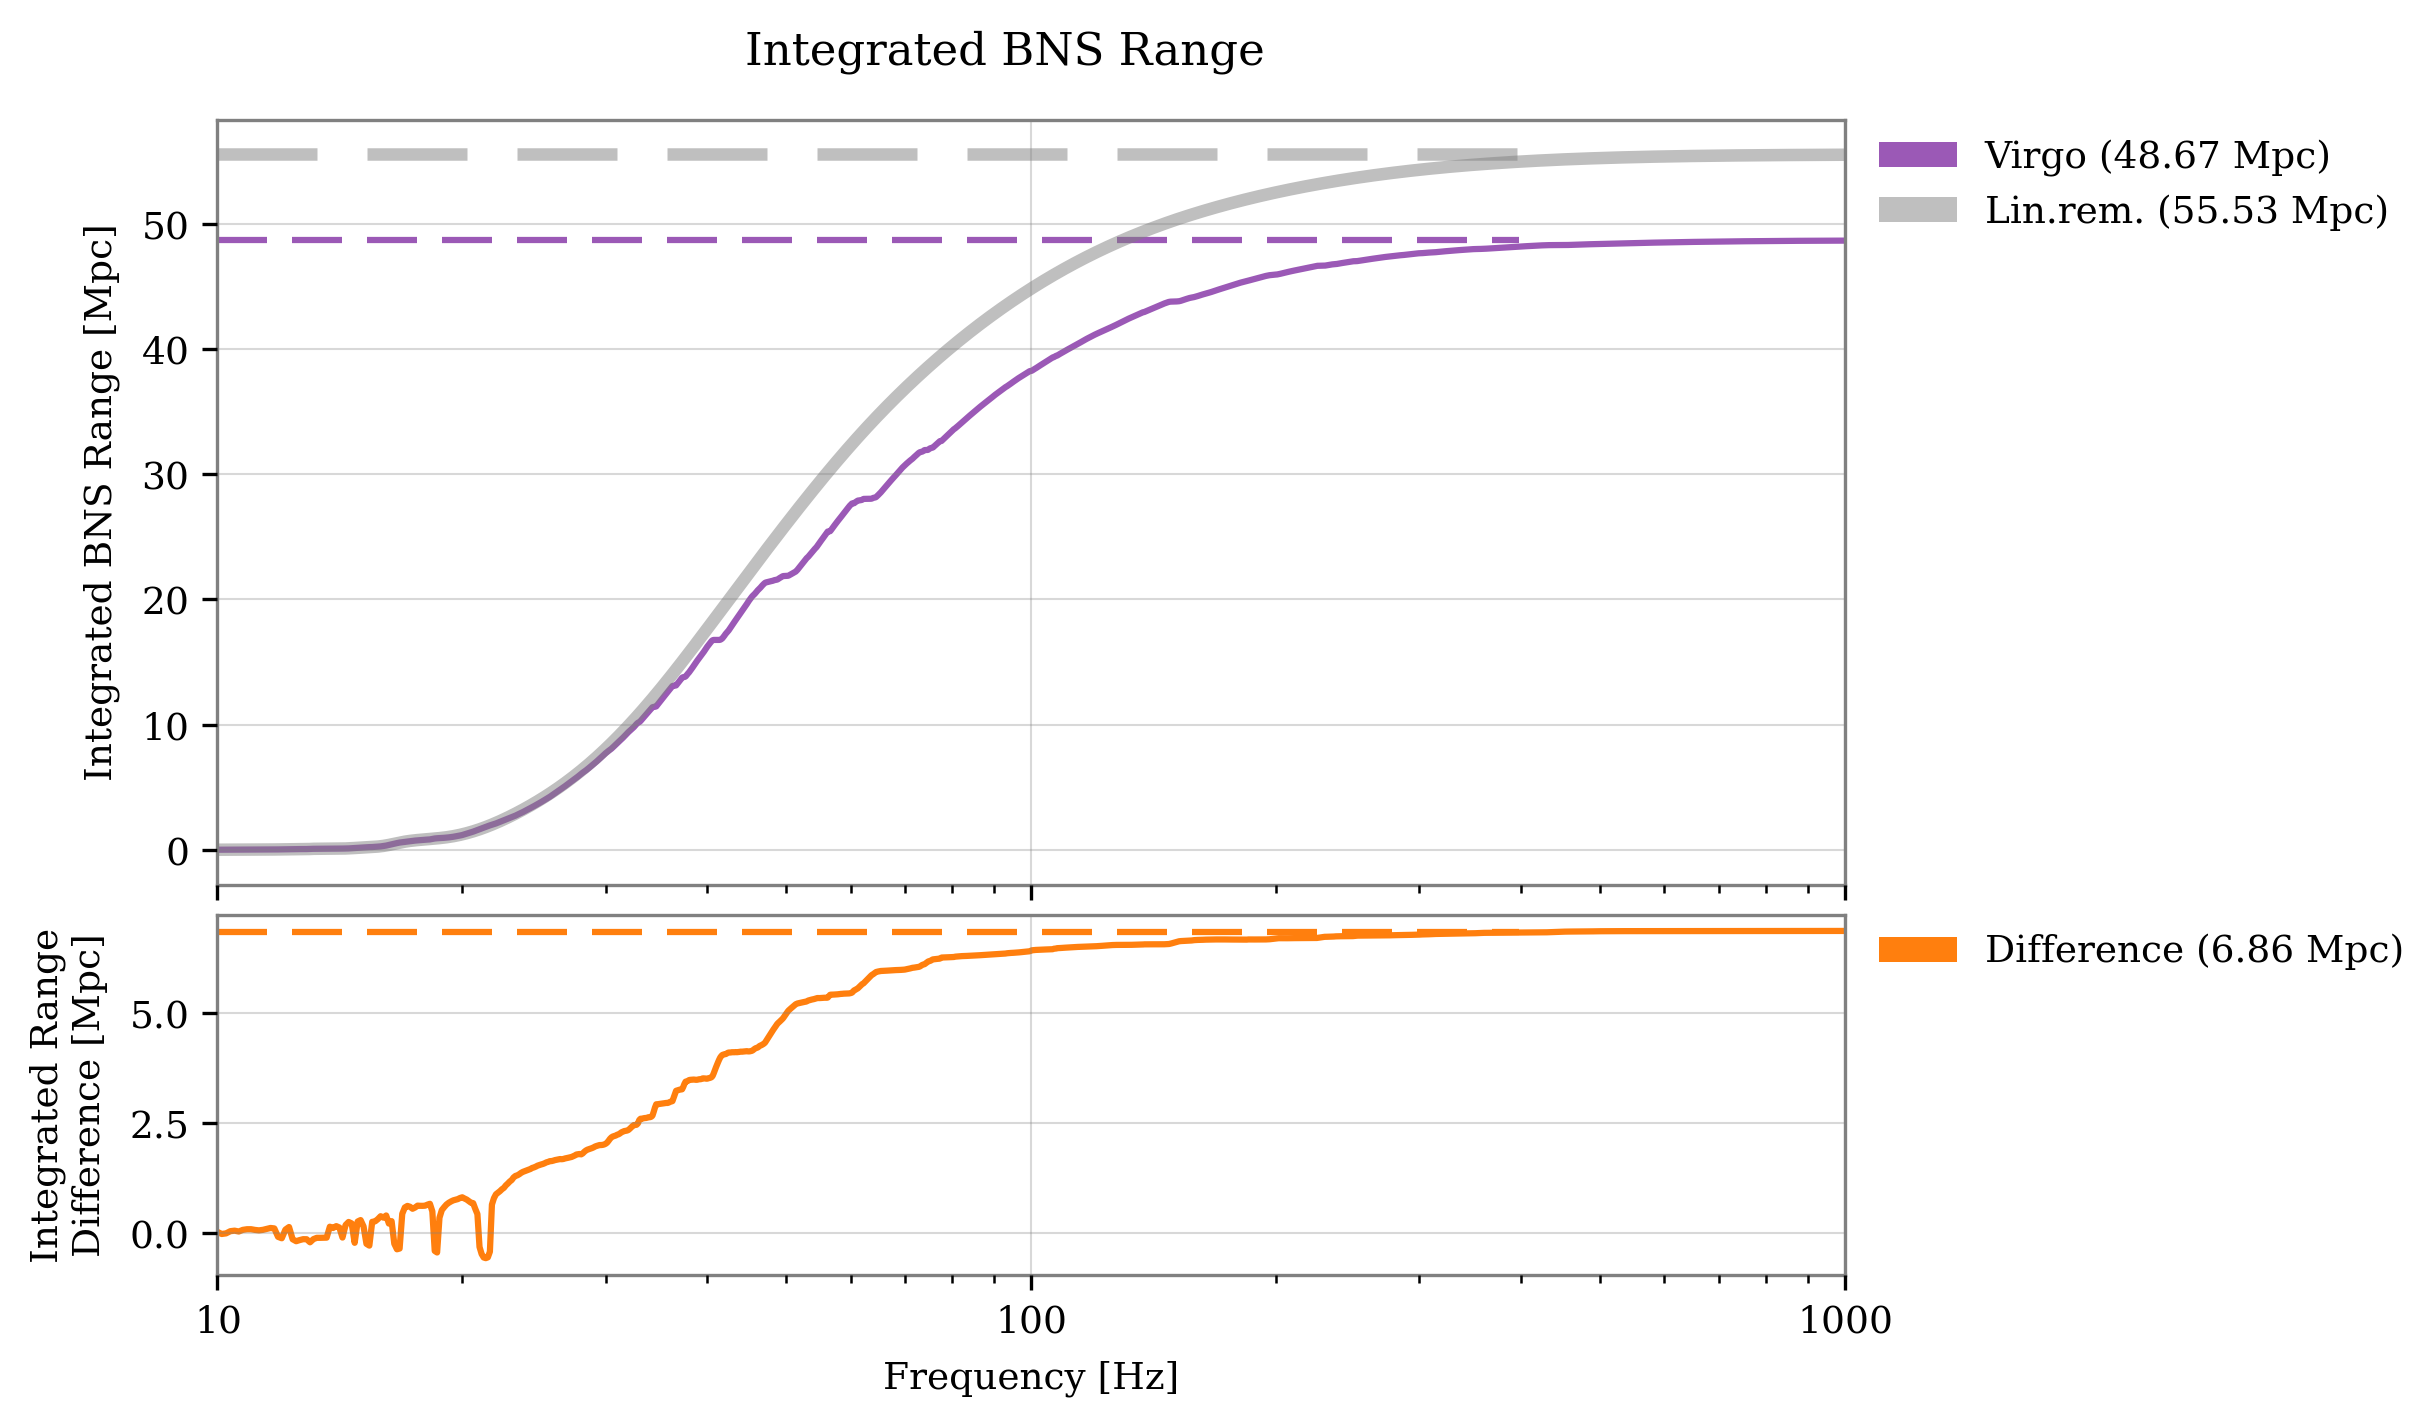
Plot2 is for GPS=1387076918 where the mean BNS range was around 48 Mpc : total contribution of the lines was 1.30 Mpc
itflines3.txt contains the list of lines, sensilines20231220lowrange.txt and sensilines20231220highrange.txt contain the detailed contribution of each line to the BNS range.

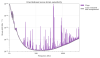
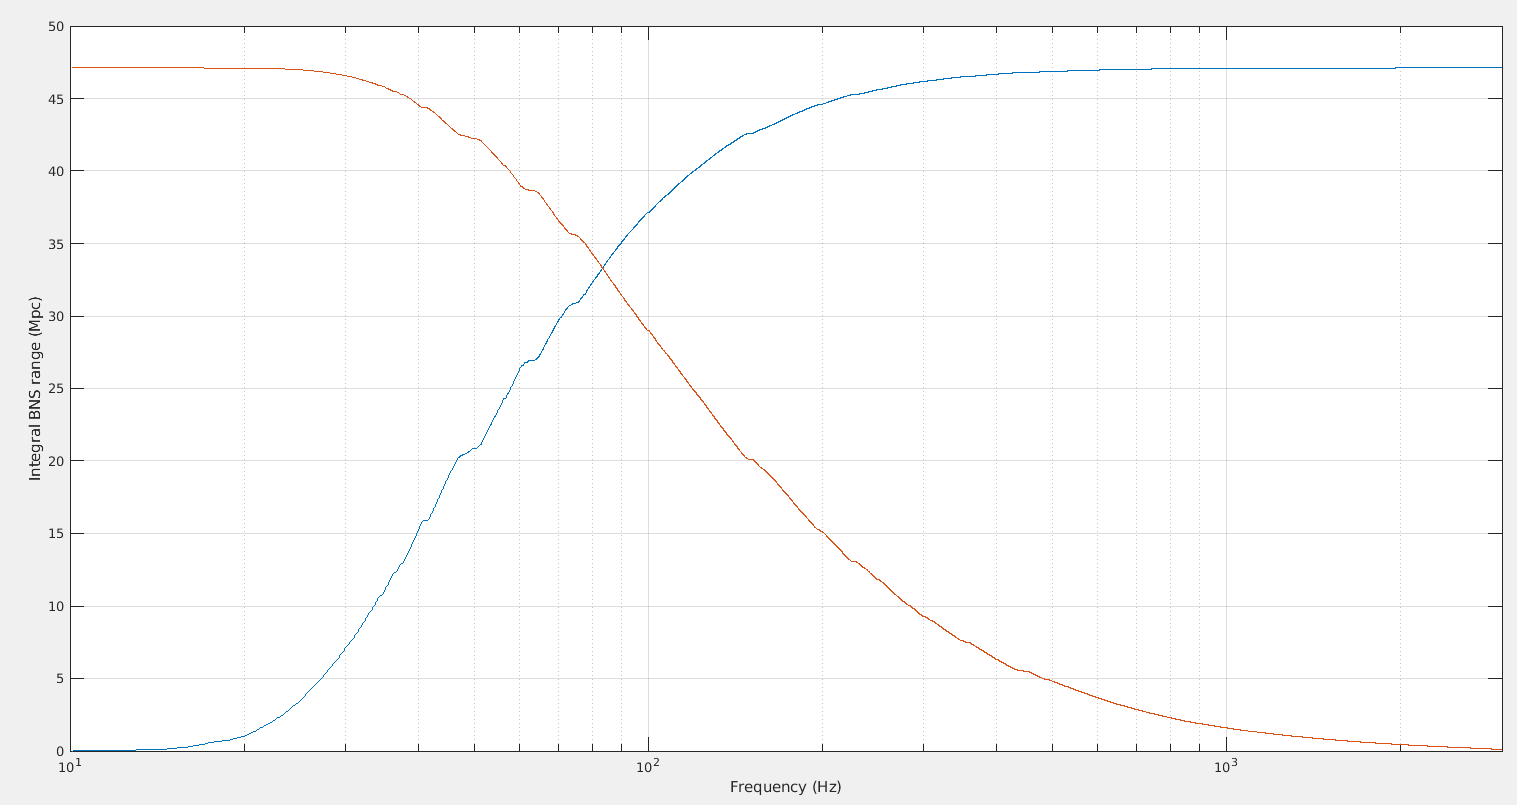
I did the same exercise taking all the main bumps or groups of lines (frequency bands) visible in the sensitivity when ITF is in LN3, at GPS=1387076918.
Plot3 shows the result. In this case, the total contribution of lines is 3.9 Mpc
itflines2.txt contains the list of frequency bands, sensilines20231220all.txt contains the detailed contribution of each band to the BNS range.

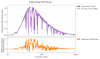
As expected, the main contributors are:
band 40.5-42.0 Hz : 0.33 Mpc  (NCal lines)
band 46.7-51.7 Hz : 0.85 Mpc  (50 Hz line and others)
band 56.0-57.0 Hz : 0.22 Mpc (calib line for hrec/hinj monitoring)  I forgot three cal lines between 34 and 38 Hz which may contribute for the same amount
band 60.0-65.0 Hz : 1.05 Mpc (Hrec lines)
band 72.5-76.0 Hz : 0.47 Mpc (LSC_ACl line)
band 145-167 Hz : 0.51 Mpc  (150 Hz line and others)
Contribution from the violin modes forest around 440 Hz is only 0.035 Mpc
Contribution from the DARM line at 491.3 Hz is only 0.0075 Mpc

The ROOT scripts used to do this rough estimate is here: /opt/w3/vim/cal/sensilines.C


Images attached to this report
Non-image files attached to this report
Comments to this report:
direnzo - 17:14 Thursday 21 December 2023 (62815) Print this report

I complement Didier's analysis with a few plots.

In Fig. 1 I have created a spline curve (grey line) to approximate the Virgo sensitivity curve, without all the spectral lines. Notice that this curve has a general tendency to underestimate the strain ASD (or overestimate the sensitivity: don't trust the reported range!).

From the above curves, I have plotted in Fig. 2 and 3 the Differential BNS Range. This quantity (reported also on VIM in the CAL Summary page) is the square root of the integrand in the BNS range equation multiplied by the frequency, and then integrated over d(ln f) = df/f, as suitable to be shown on a logarithmic x-axis. The orange curve at the bottom is the difference in the differential ranges of the actual Virgo data and their spline approximation. Notice that this orange curve is almost everywhere above zero, due to the aforementioned bias in the model. Evident are the frequency regions reported by Didier: the structure around the 50 Hz, that around the 63 Hz line, and 74.4 Hz line. Additionally, it is visible how a considerable part of the sensitivity is obtained between 30 and 100 Hz. The line at 41 Hz has also a significant contribution.

Figure 4 shows the integrated range for the actual and approximated sensitivities, and their difference. Here you can see that a range of about 40 Mpc is obtained just in the region below 100 Hz. The steps in the orange curve represent again where most of the range is lost.

Images attached to this comment
mwas - 17:43 Thursday 21 December 2023 (62816) Print this report

Figure 1 is just a reminder that BNS range is an RMS like function which is confusing when adding frequency bins up. The figure shows the BNS range integrated from 10Hz to 3kHz, or in the opposite order from 3kHz to 10kHz. Half of the range is below 82Hz and half is above 82Hz. But half of the total 47Mpc is not 23.5Mpc. Half of 47Mpc is 47Mpc/sqrt(2) = 33Mpc, where the two curves cross each other. It is because SNR adds quadratically like an RMS.

Images attached to this comment
Search Help
×

Warning

Error

The present report has been modified outside this window. Please check for its integrity in the main page.

Refreshing this page will move this report into drafts.

×