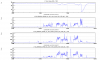
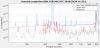
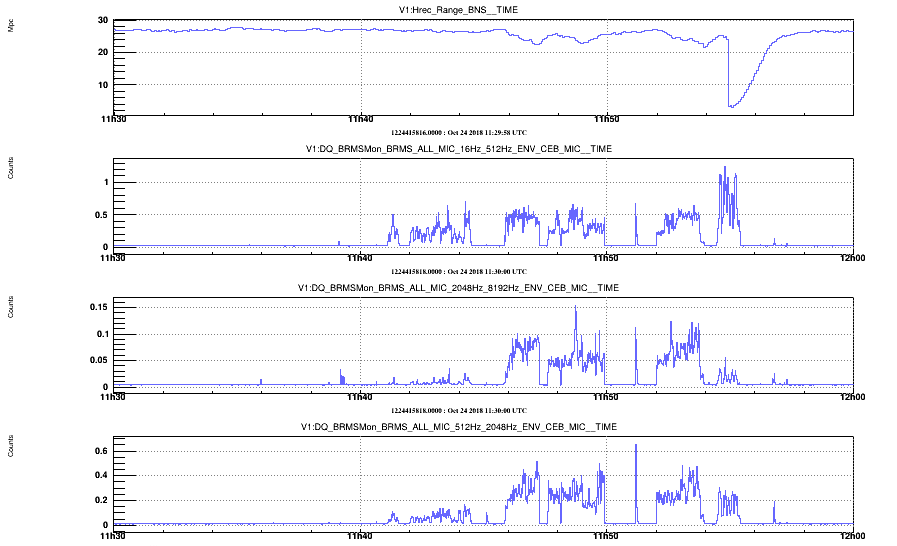
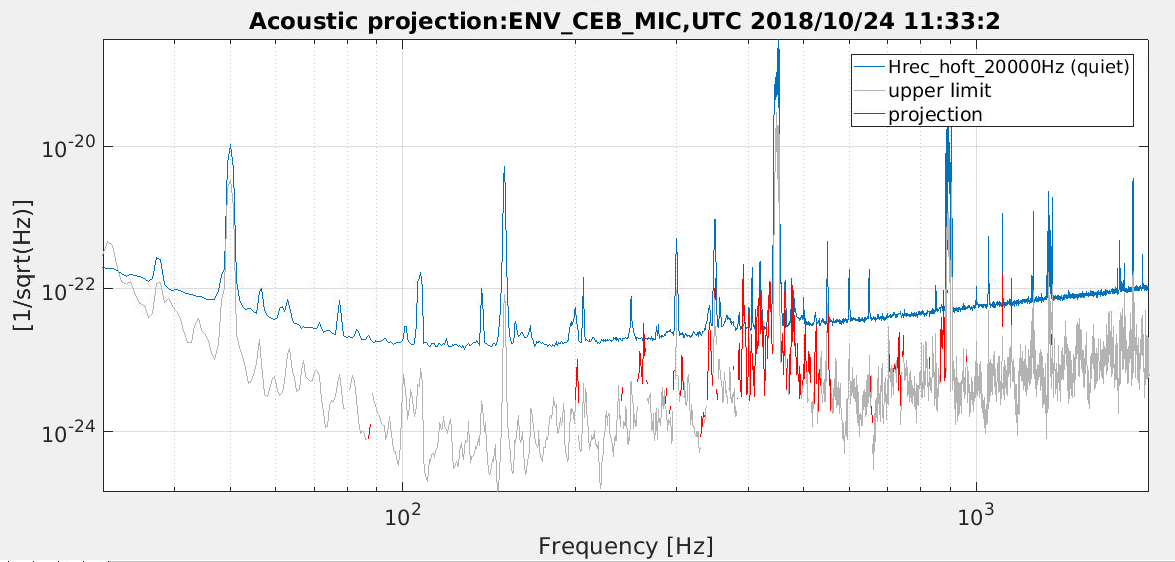
On October 24 (27 Mpc, 17W) we performed new acoustic injections in CEB (Figure 1). In place of the usual white noise, we injected some sound tracks (you can listen to them in the attached .wav) which proved as well effective.
These injections look definitively better that those performed on October 5 (17Mpc, 25W) since the sensitivity was very bad at that time, one reason being the SDB1 picomotors which were forgotten on after the Sept intervention in SDB1.
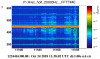
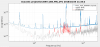
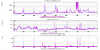
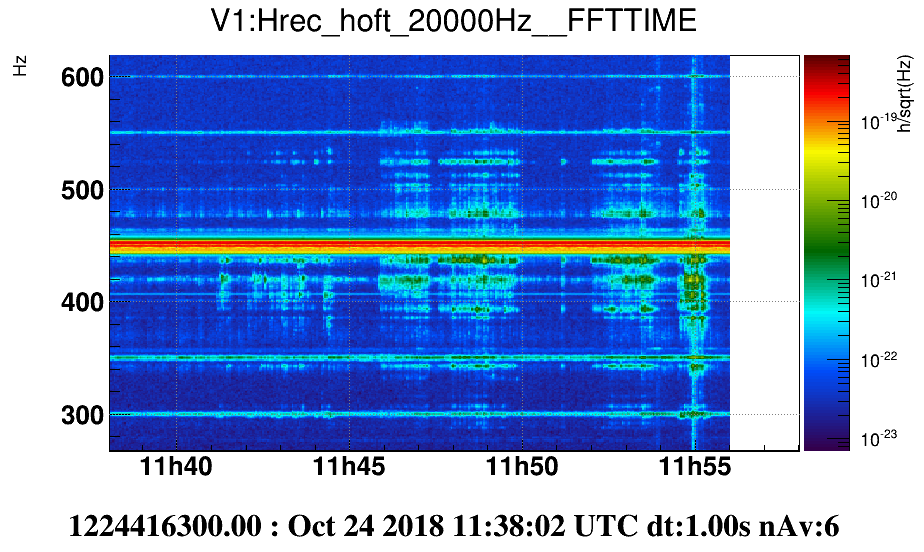
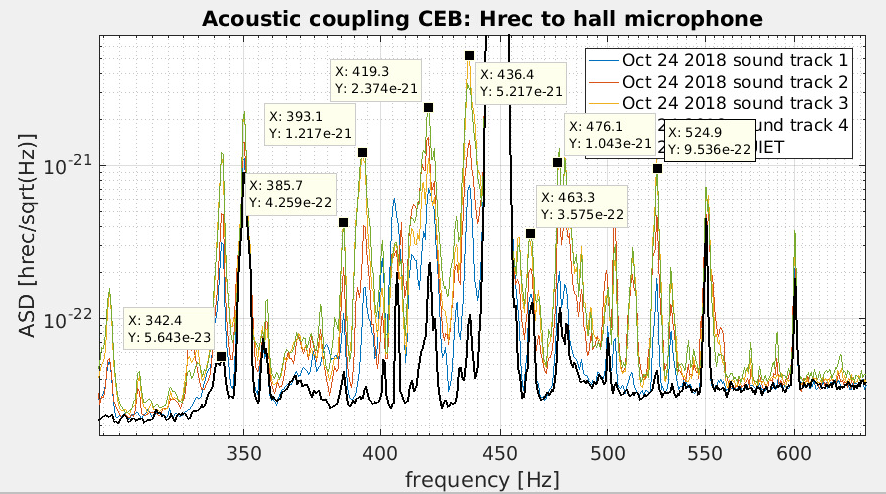
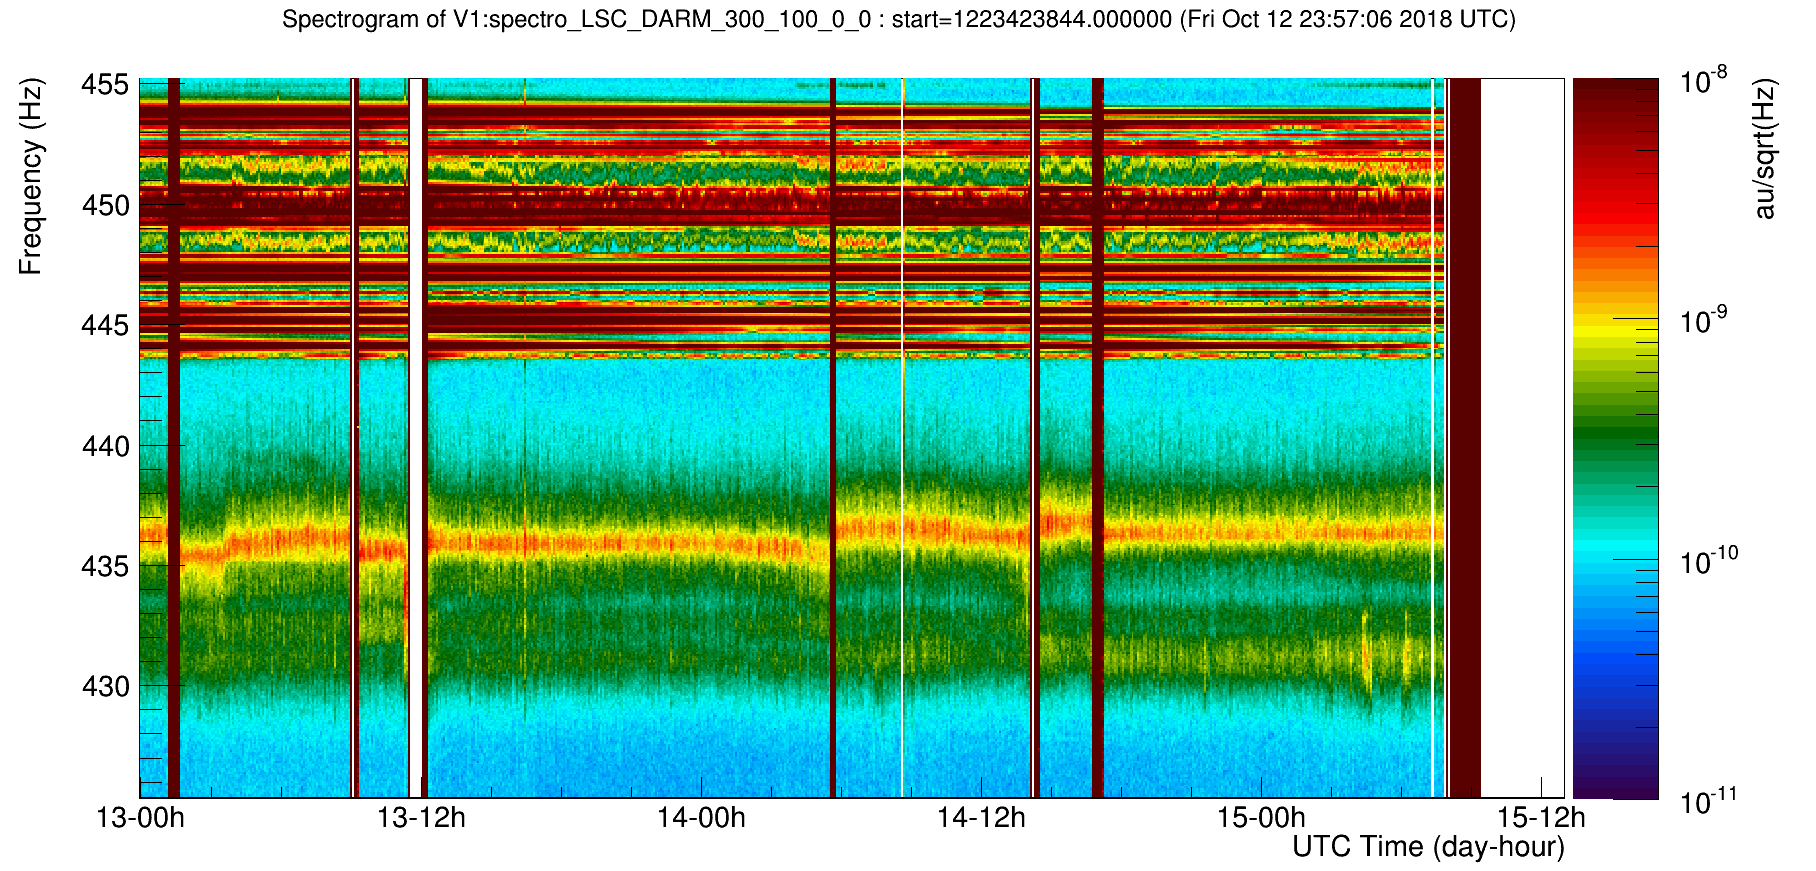
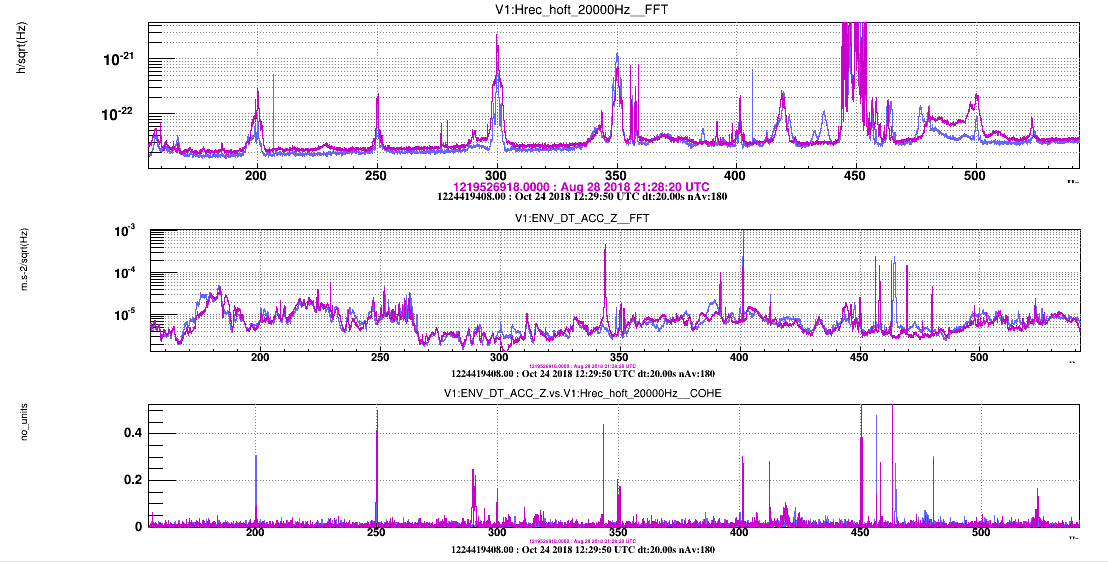
Figure 2 (spectrogram) and Figure 3 (ffts) show excited peaks. Essentially all of existing peaks between 300 and 500 Hz got excited during the injection (it is possible that the injection triggered some misalignment which increased the coupling of some peaks).
It makes sense to compare this injection with that of August 24 (22Mpc, 25W), we did right before SDB1 intervention, because ITF alignment conditions were good at both times (sensitivity stable) and also at both time SDB1 motors were OFF as well (R.Gouaty switched them off on July 25: 42211).
Here a list, with some notes that relate the peaks evidenced during this acoustic injection with those present on August 24, Hz:
- 343 also on Aug 24
- 386 NEW since Aug 24
- 392 also in Aug (slightly moved)
- 401 also in Aug (Turbo pump line, coherent with ACC DT)
- 418 also in Aug (small cohe <=0.06 with ACC DT)
- 436 NEW (jumping line) we had in O2 as well (small cohe <=0.06 with ACC DT) (could it be related to the uncoated aluminium OMC covers??)
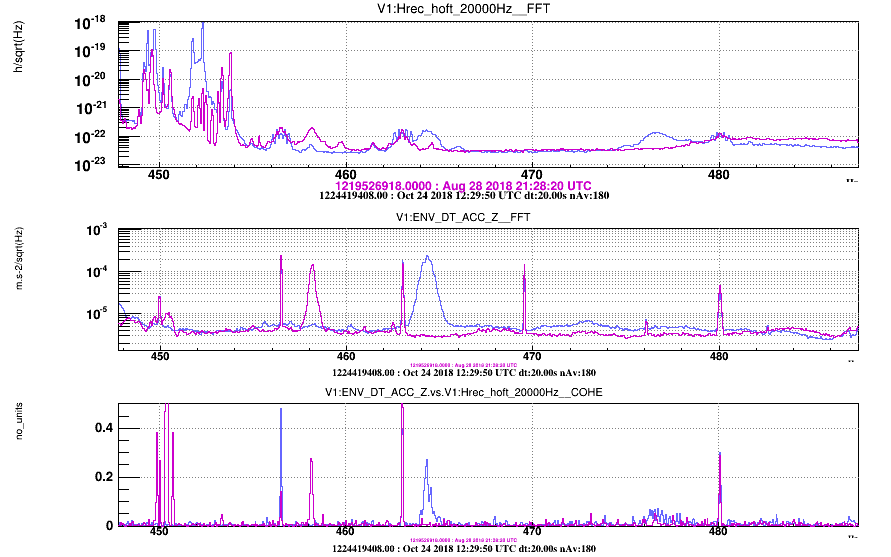
- 464 NEW (some cooling fan) cohe with ACC DT and EDB mic (it moved, in August it was around 458)... something inside DET?
- 476 NEW (small cohe <=0.06 with ACC DT)
- 524 also in Aug
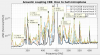
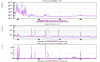
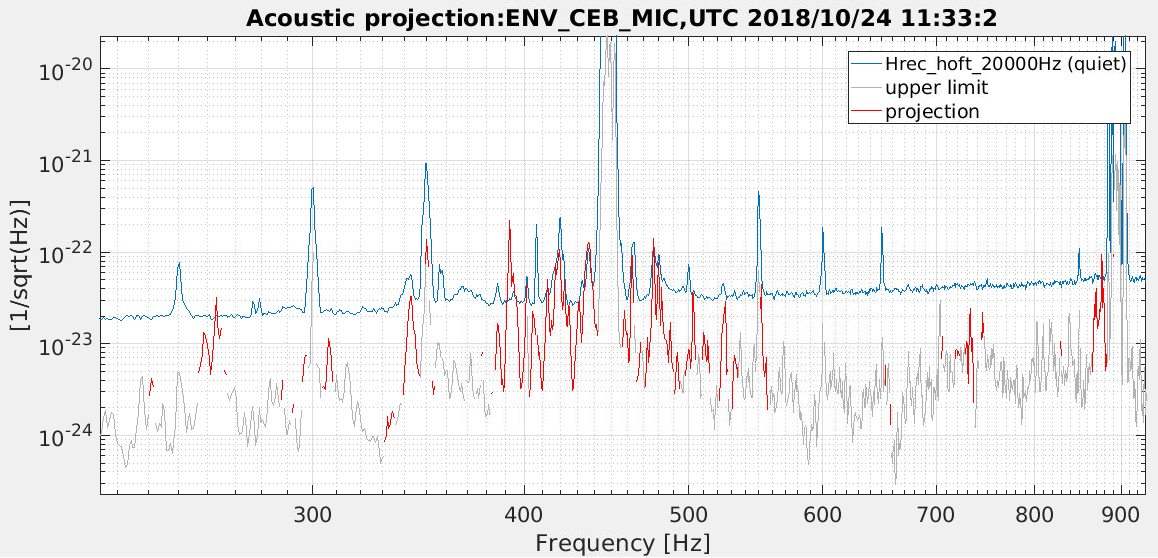
Figure 4 and Figure 5 show a projection of CEB microphone onto Hrec, most of existing peaks are matched.
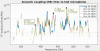
Figure 6 shows the measured TF (CEB mic to Hrec) compared with that measured on Aug 24 before Sept. SDB1 intervention: they are very similar except for the higher measured coherence at the NEW peaks (386, 436, 476).
Also attached are the measured TF files, and the log file of the injections.