Today we have performed some acoustic injections in Central Building, using the usual setup; here is the time-table:
ACOUSTIC INJECTIONS CEB - 24 August 2018
DET terrace (ENV_NOISE_CEB_DetTerrace)
colored noise: 50-750Hz
(same signal sent to 2 loudspeakers + 2 subwoofers on DET terrace)
ITF sensitivity is a bit worse than yesterday (22MpC) now is around 18MpC
1219151949 Aug24,18-13:19:09 UTC (Aug24,18-15:19:09 CEST)
Level 0.0005
1219152346 Aug24,18-13:25:46 UTC (Aug24,18-15:25:46 CEST)
1219152454 Aug24,18-13:27:34 UTC (Aug24,18-15:27:34 CEST)
Level 0.001 V
1219152881 Aug24,18-13:34:41 UTC (Aug24,18-15:34:41 CEST)
1219152922 Aug24,18-13:35:22 UTC (Aug24,18-15:35:22 CEST)
Level 0.002 V
1219153349 Aug24,18-13:42:29 UTC (Aug24,18-15:42:29 CEST)
1219153371 Aug24,18-13:42:51 UTC (Aug24,18-15:42:51 CEST)
quiet time
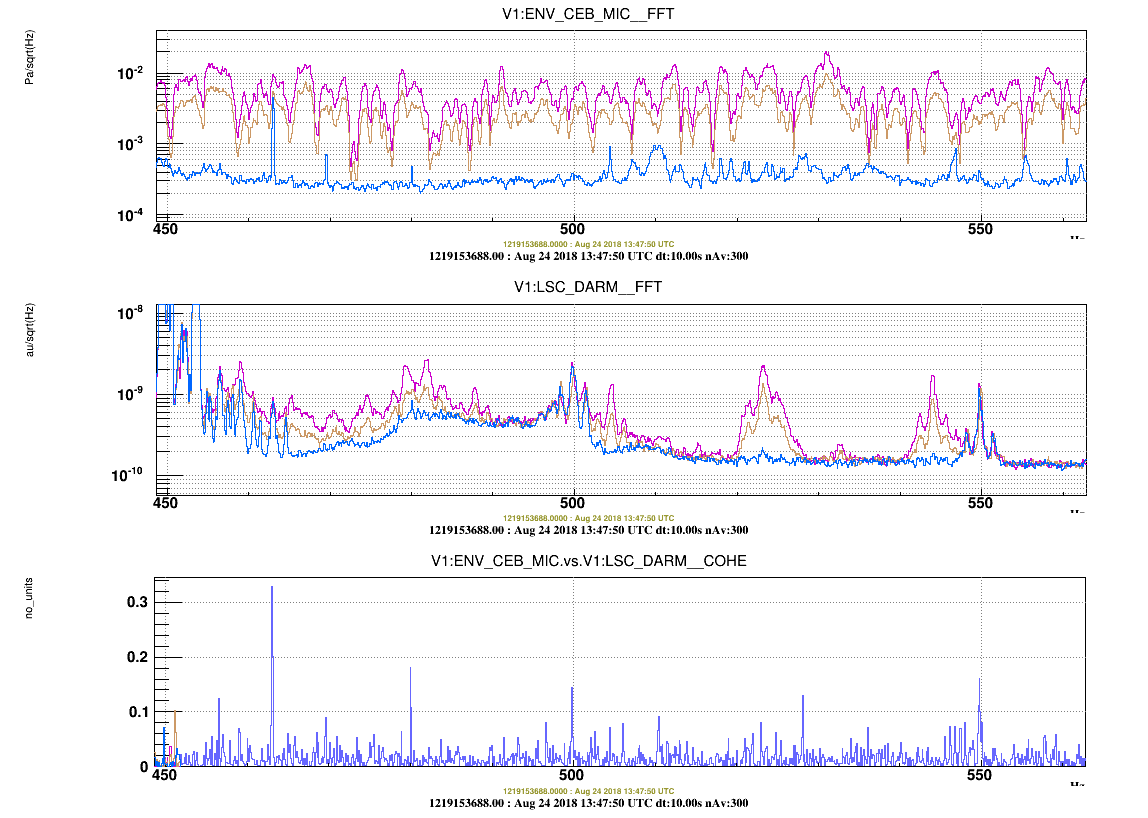
1219153698 Aug24,18-13:48:18 UTC (Aug24,18-15:48:18 CEST)
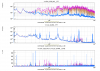
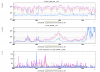
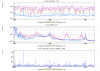
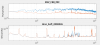
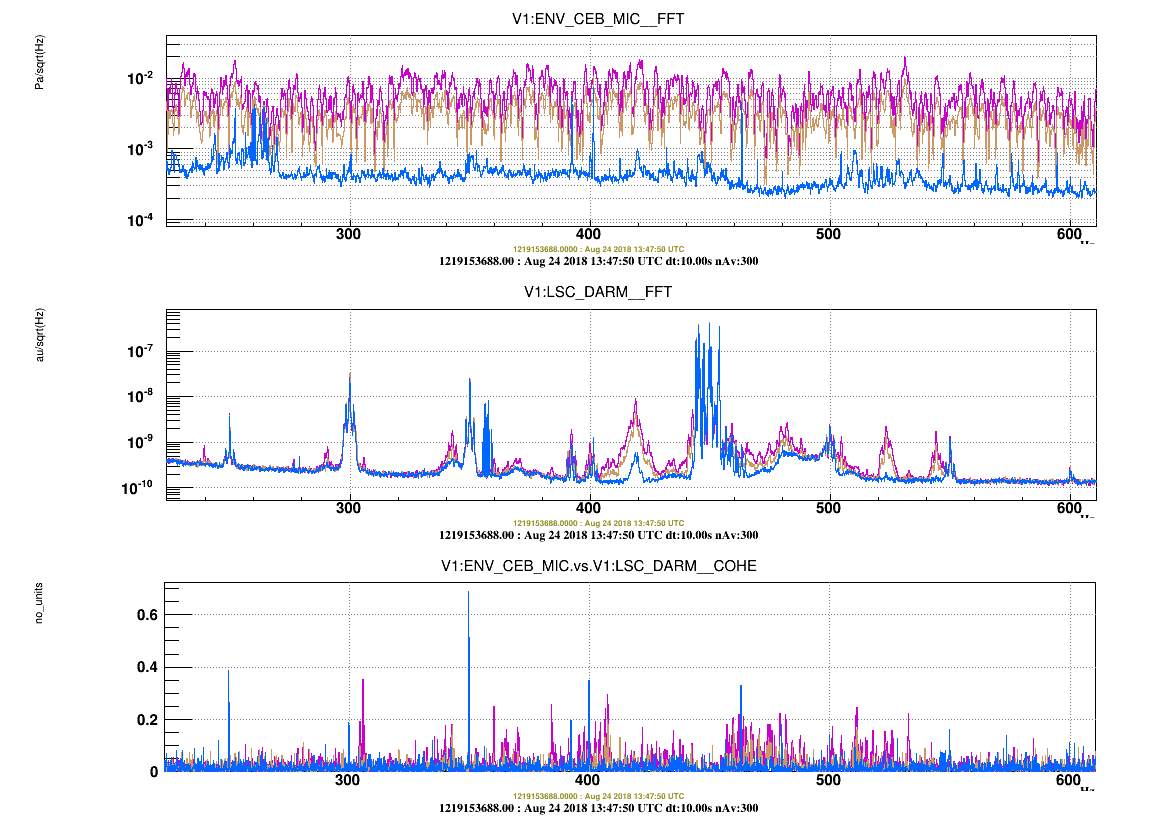
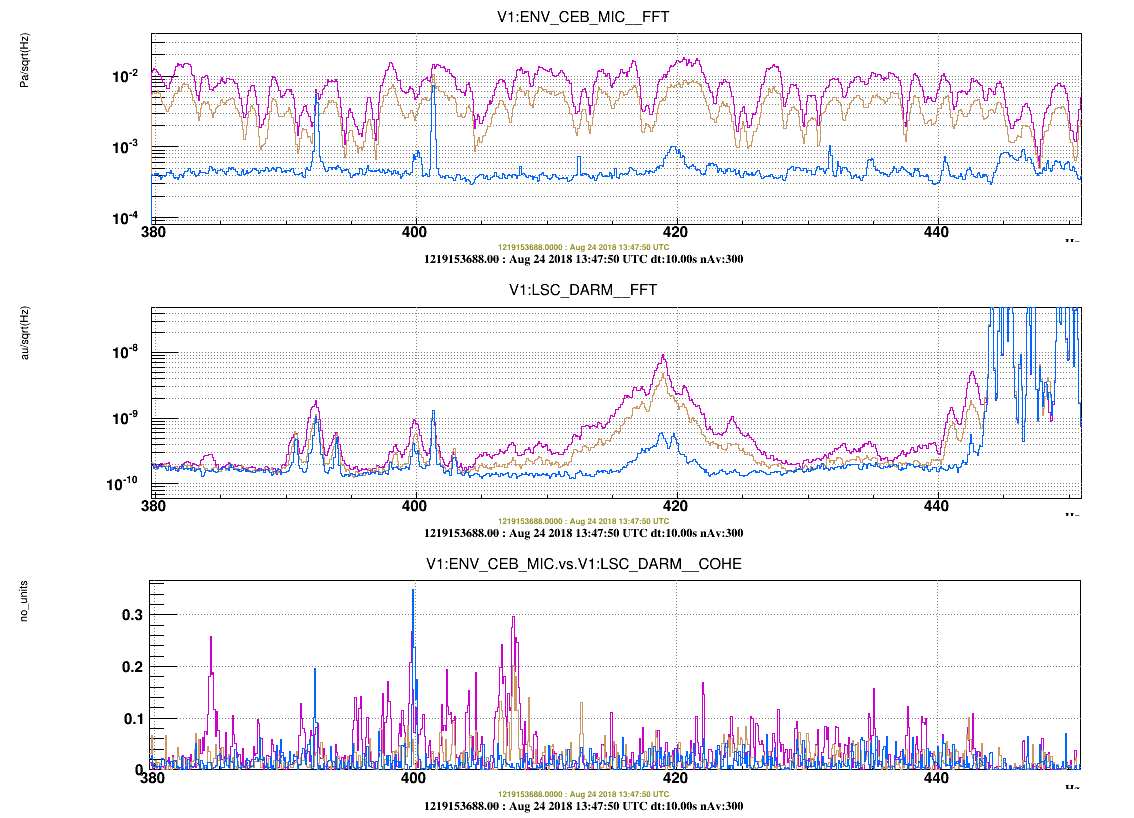
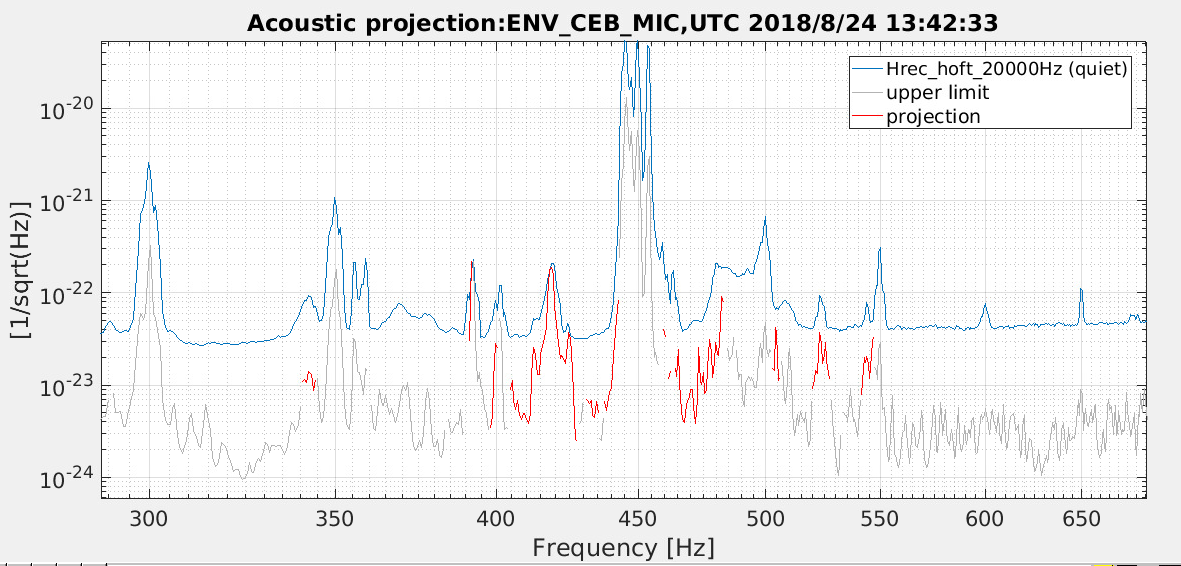
It worth noticing that some interesting structures arose in Dark-Fringe around 420Hz and around 500Hz.
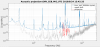
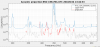
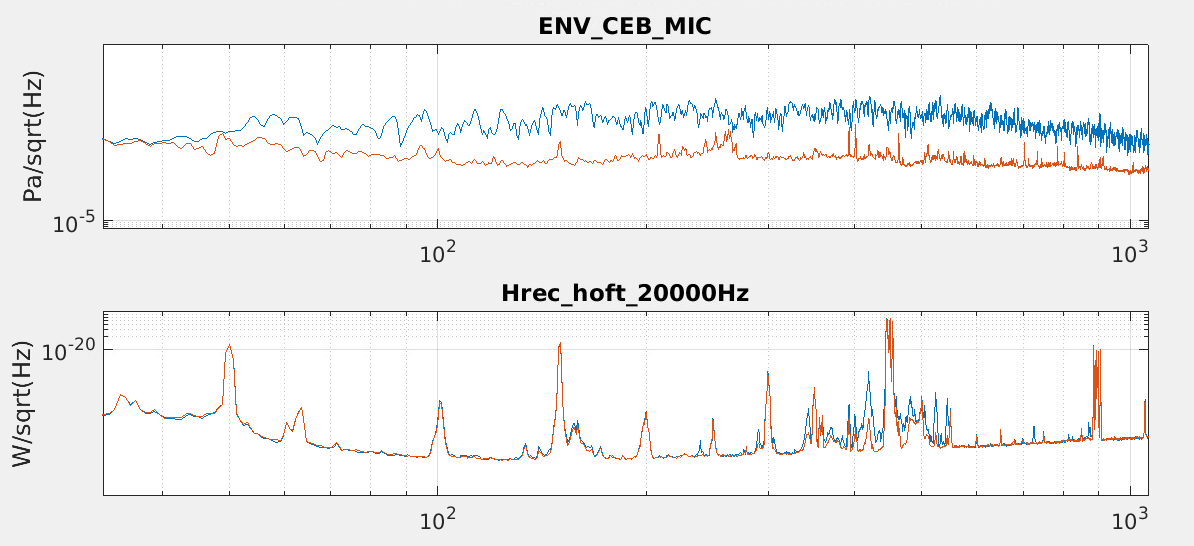
Fig1 is a broadband view (10 - 100Hz), Fig.2 is a zoom from 200 to 600Hz, Fig.3 is a zoom around 420Hz and Fig.4 is a zoom around 500Hz.
Coherence between CEB microphone and Dark-Fringe is somewhere high, somewhere low; but this is not surprising due to the suspected scattered-light mechanism.
