Reports 1-1 of 1 Clear search Modify search
Detector Characterisation (Spectral lines)
fiori, paoletti - 15:25 Friday 24 August 2018 (42527) Print this report
1.5Hz sidebands

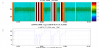
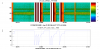
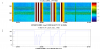
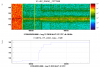
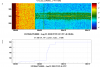
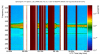
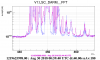
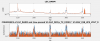
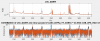
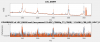
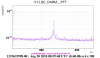
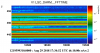
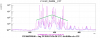
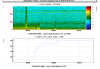
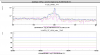
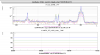
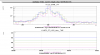
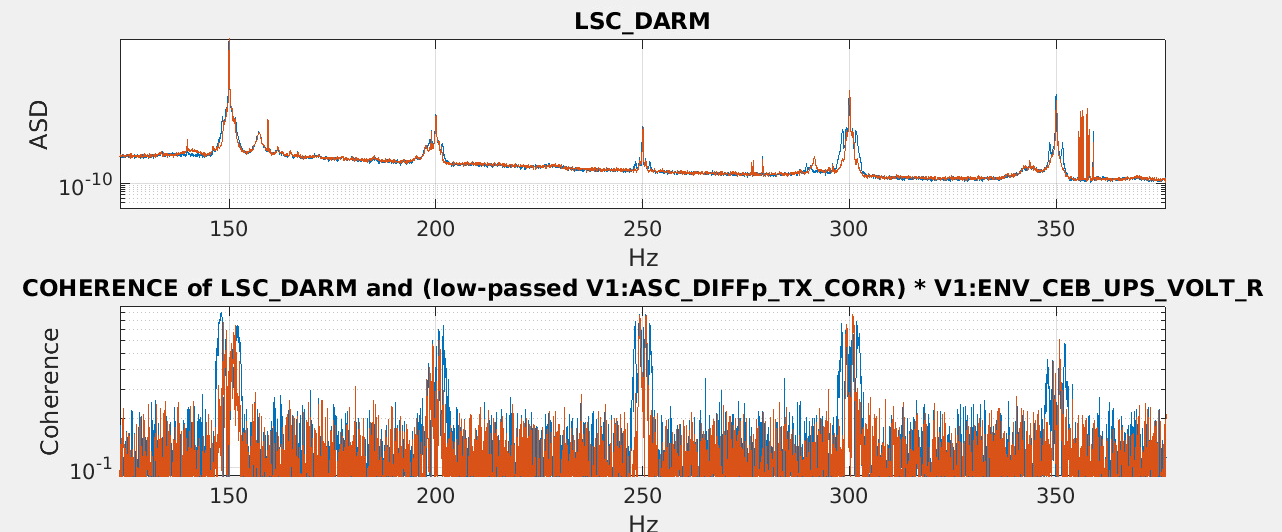
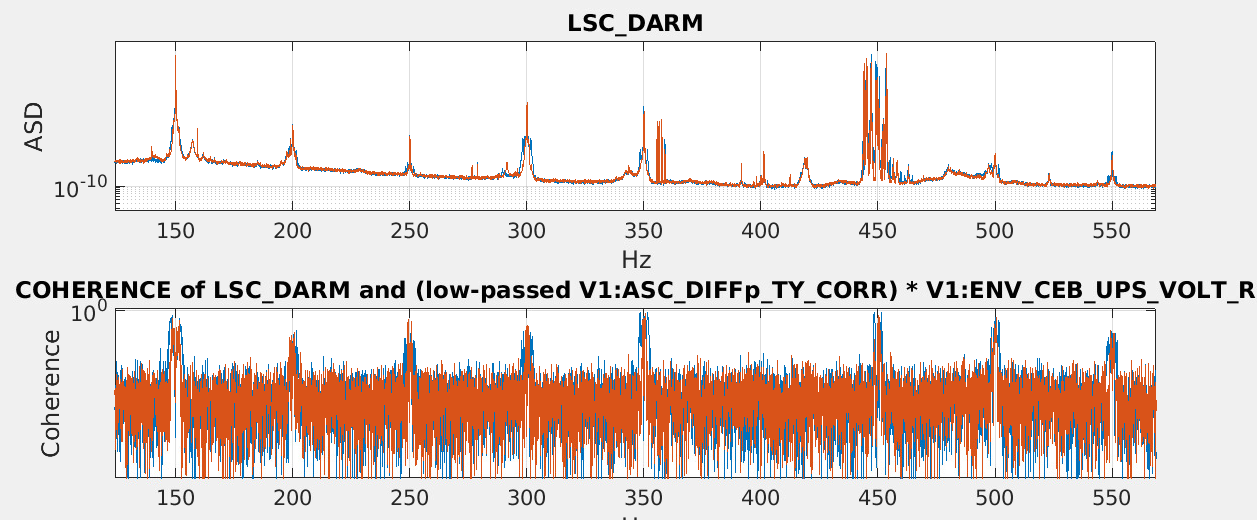
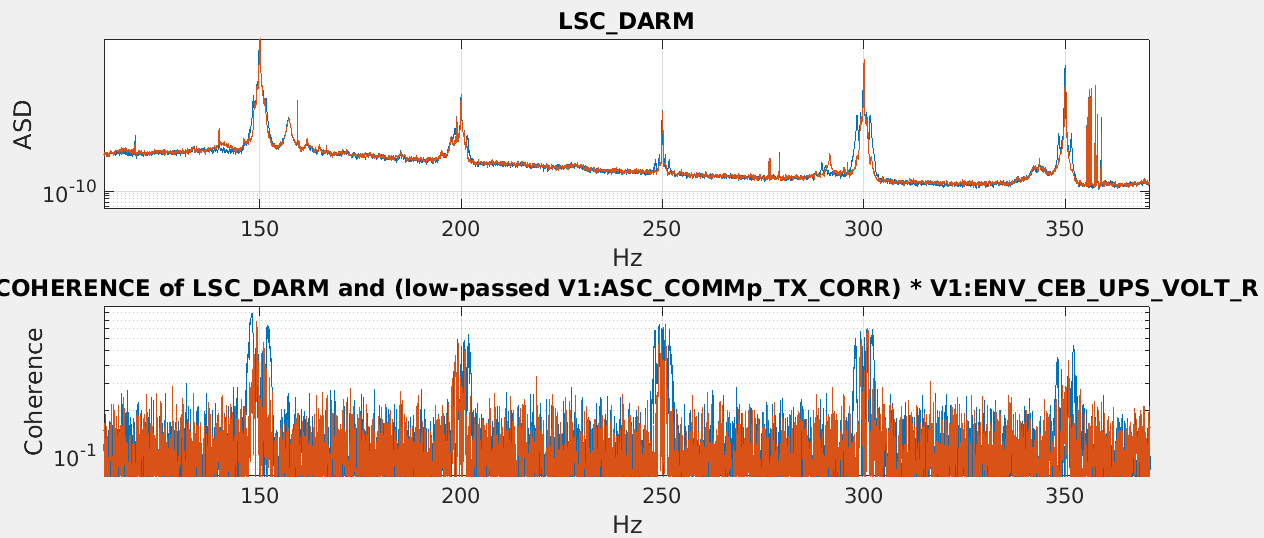
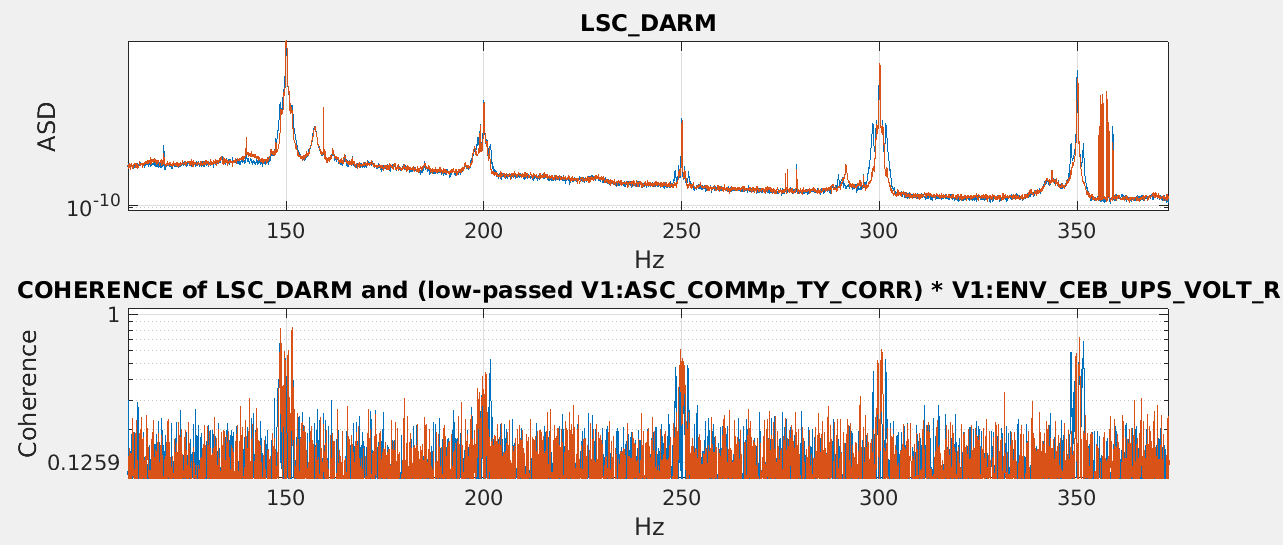
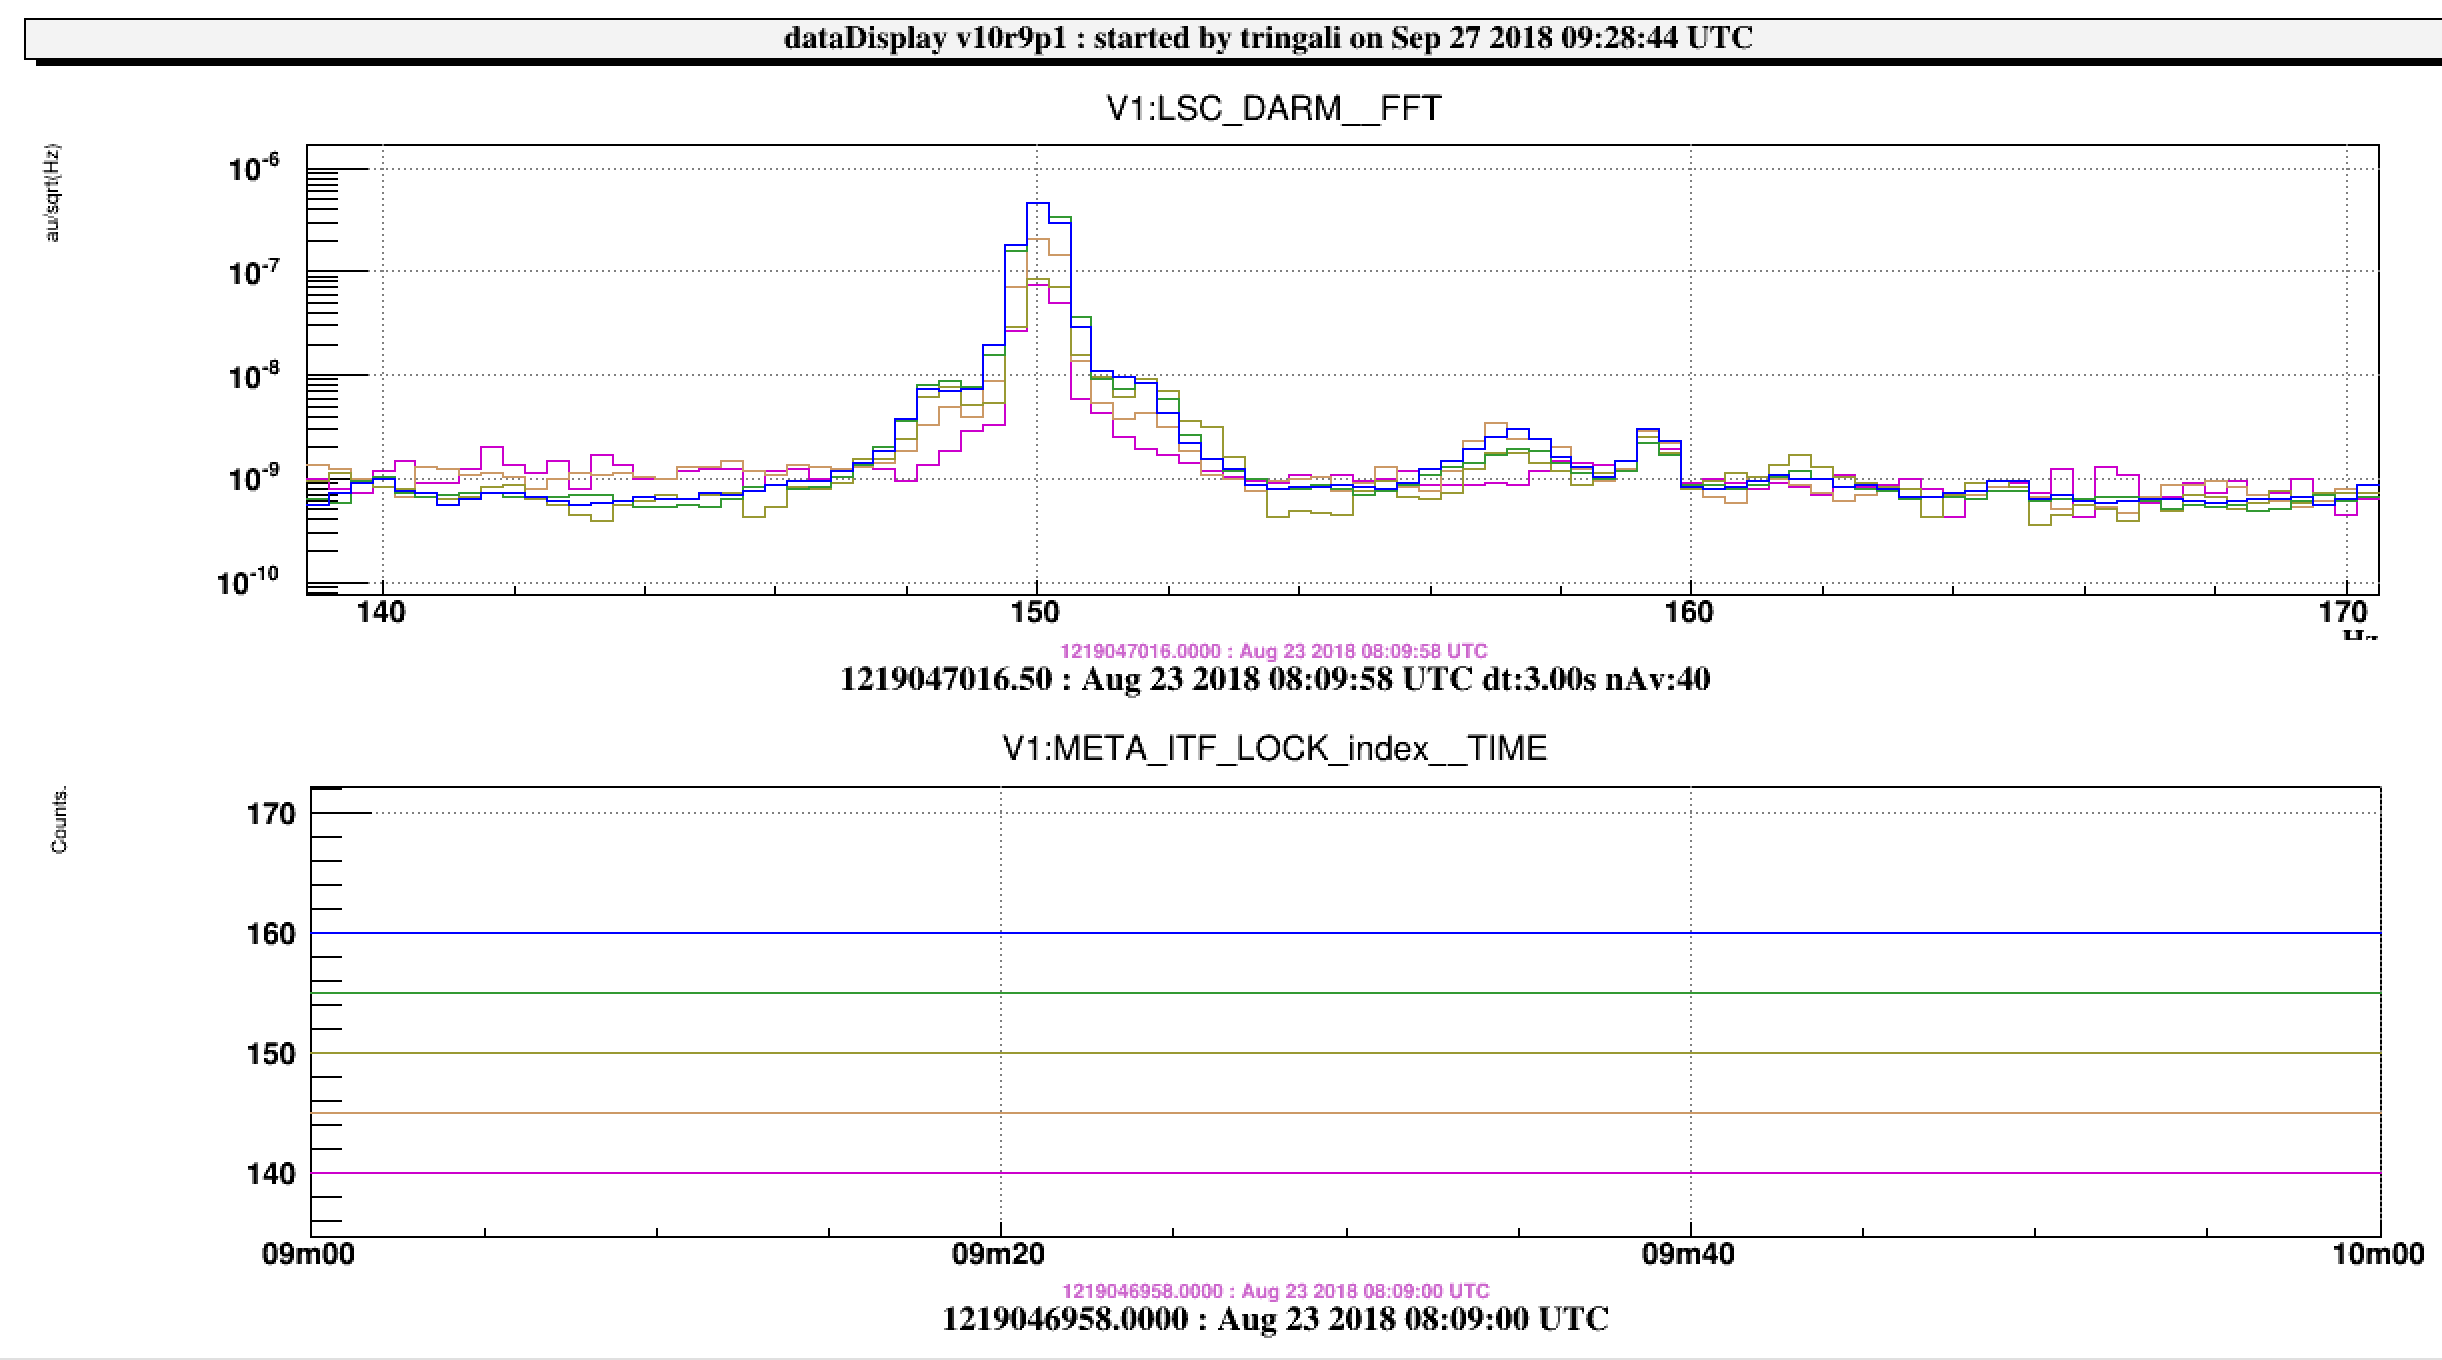
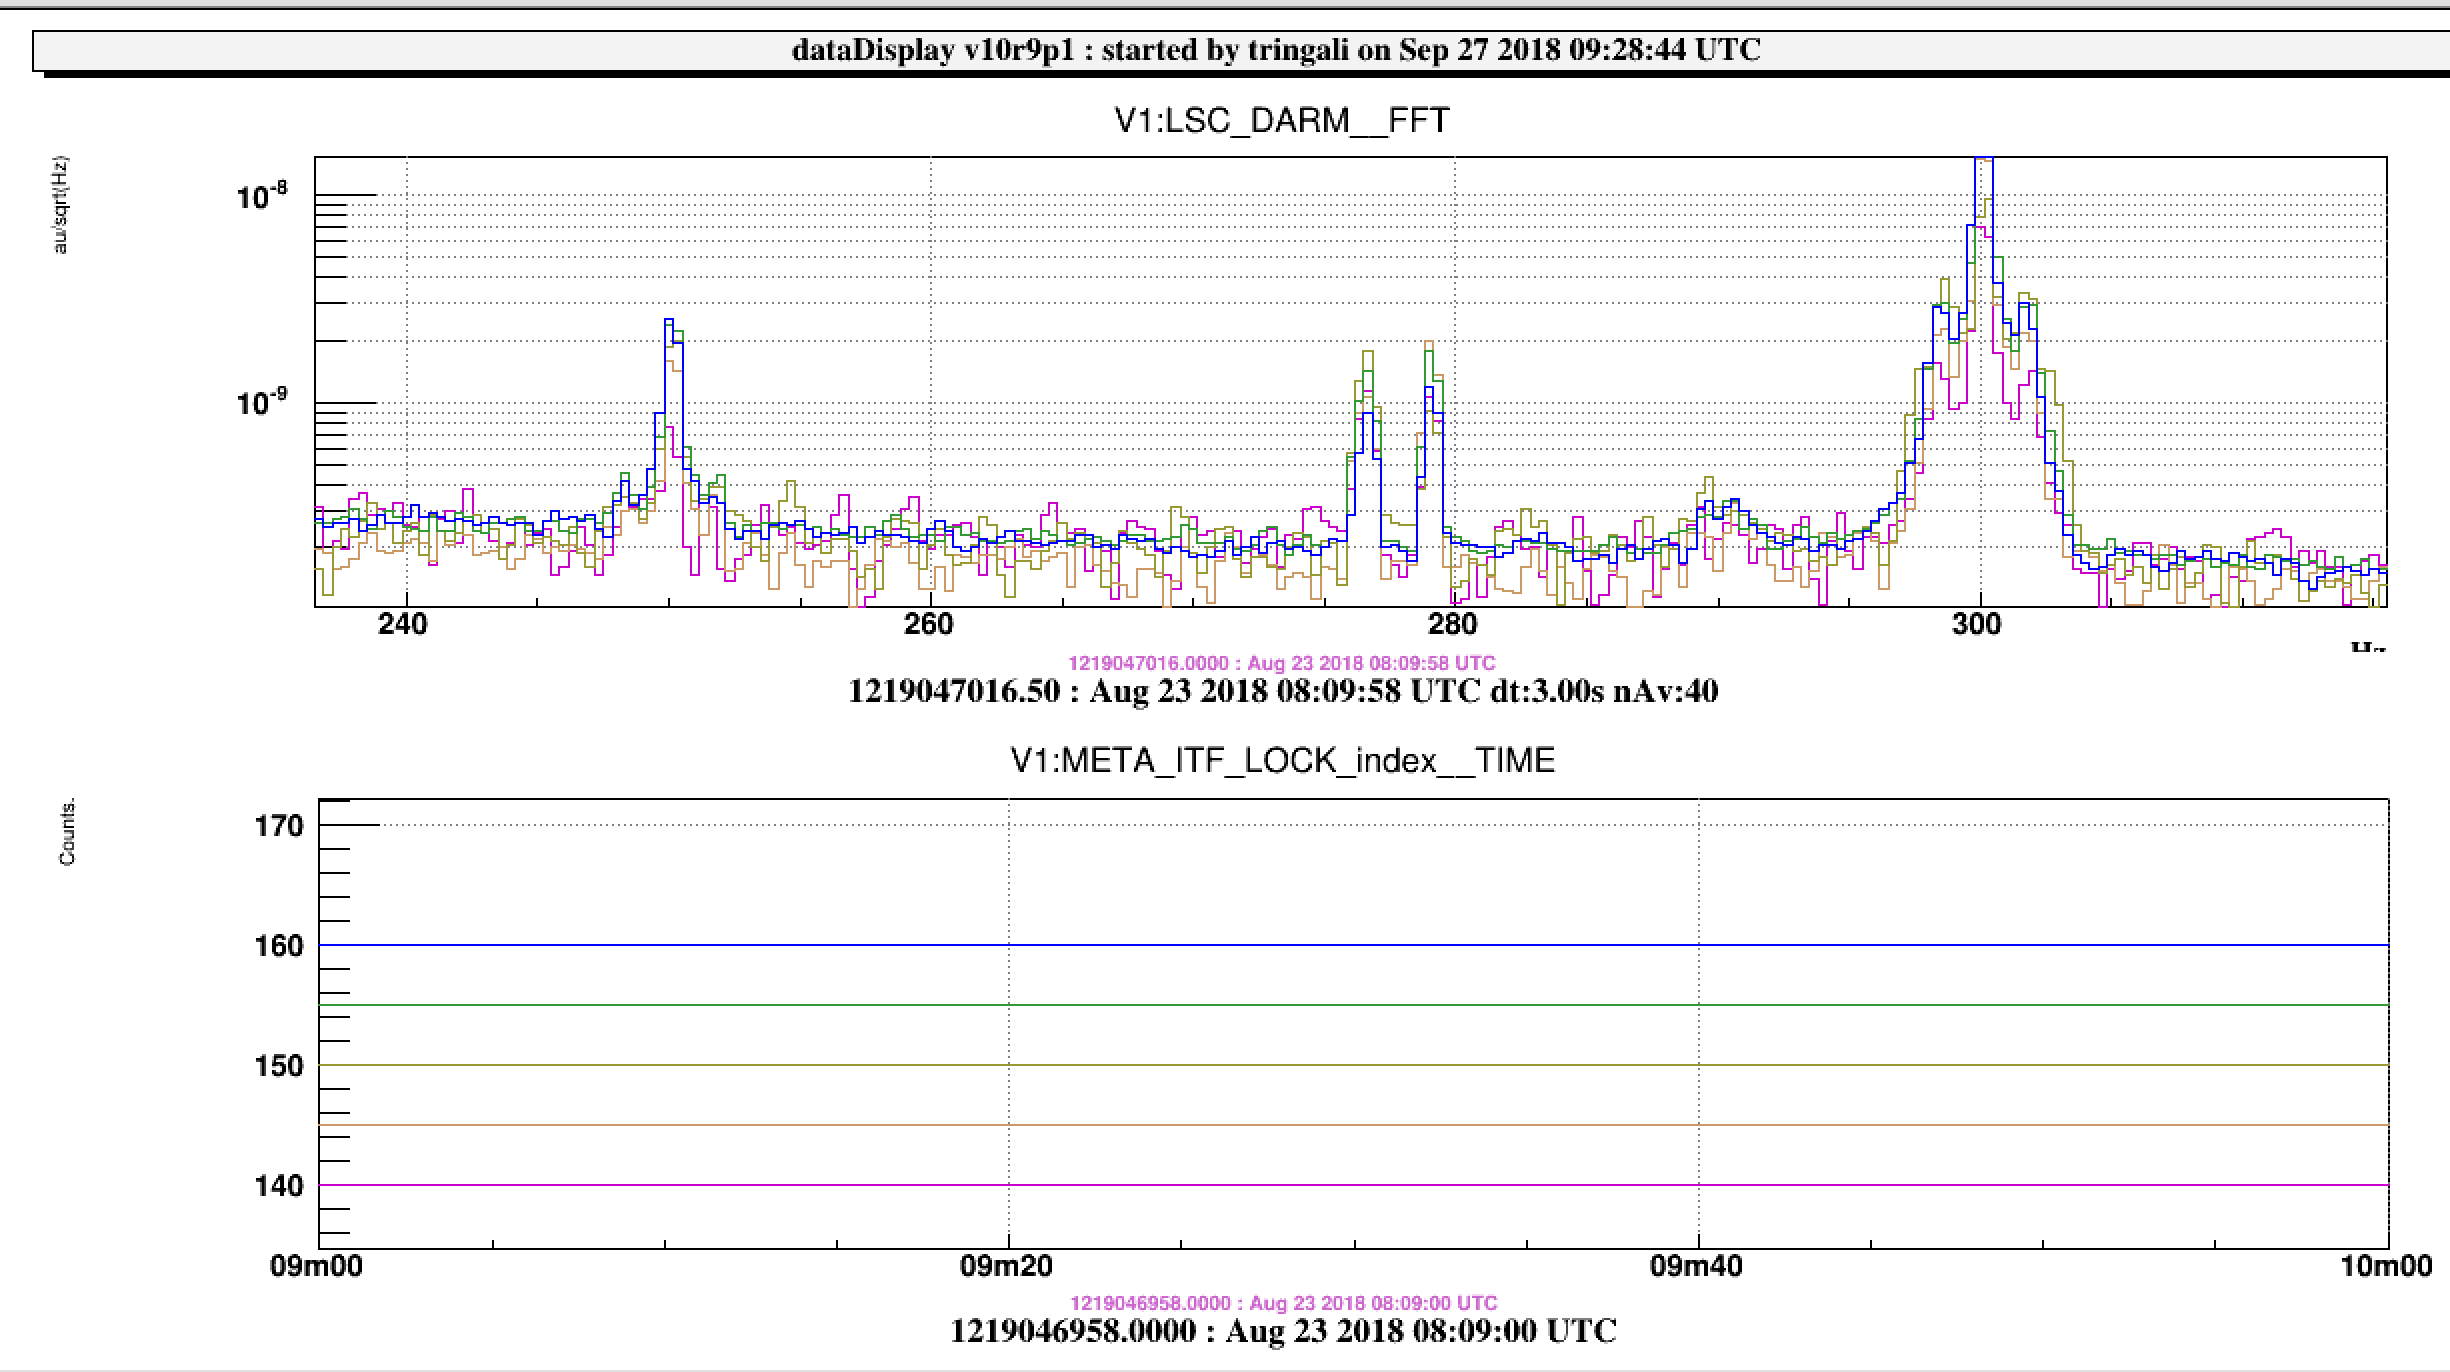
As reported in 42511, some mains harmonics have 1.5Hz (and some also ~0.7Hz) sidebands. Figures 1 (150Hz) Figure 2 (200Hz), Figure 3 (300Hz)  

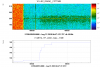
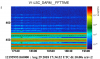
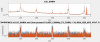
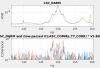
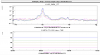
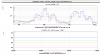
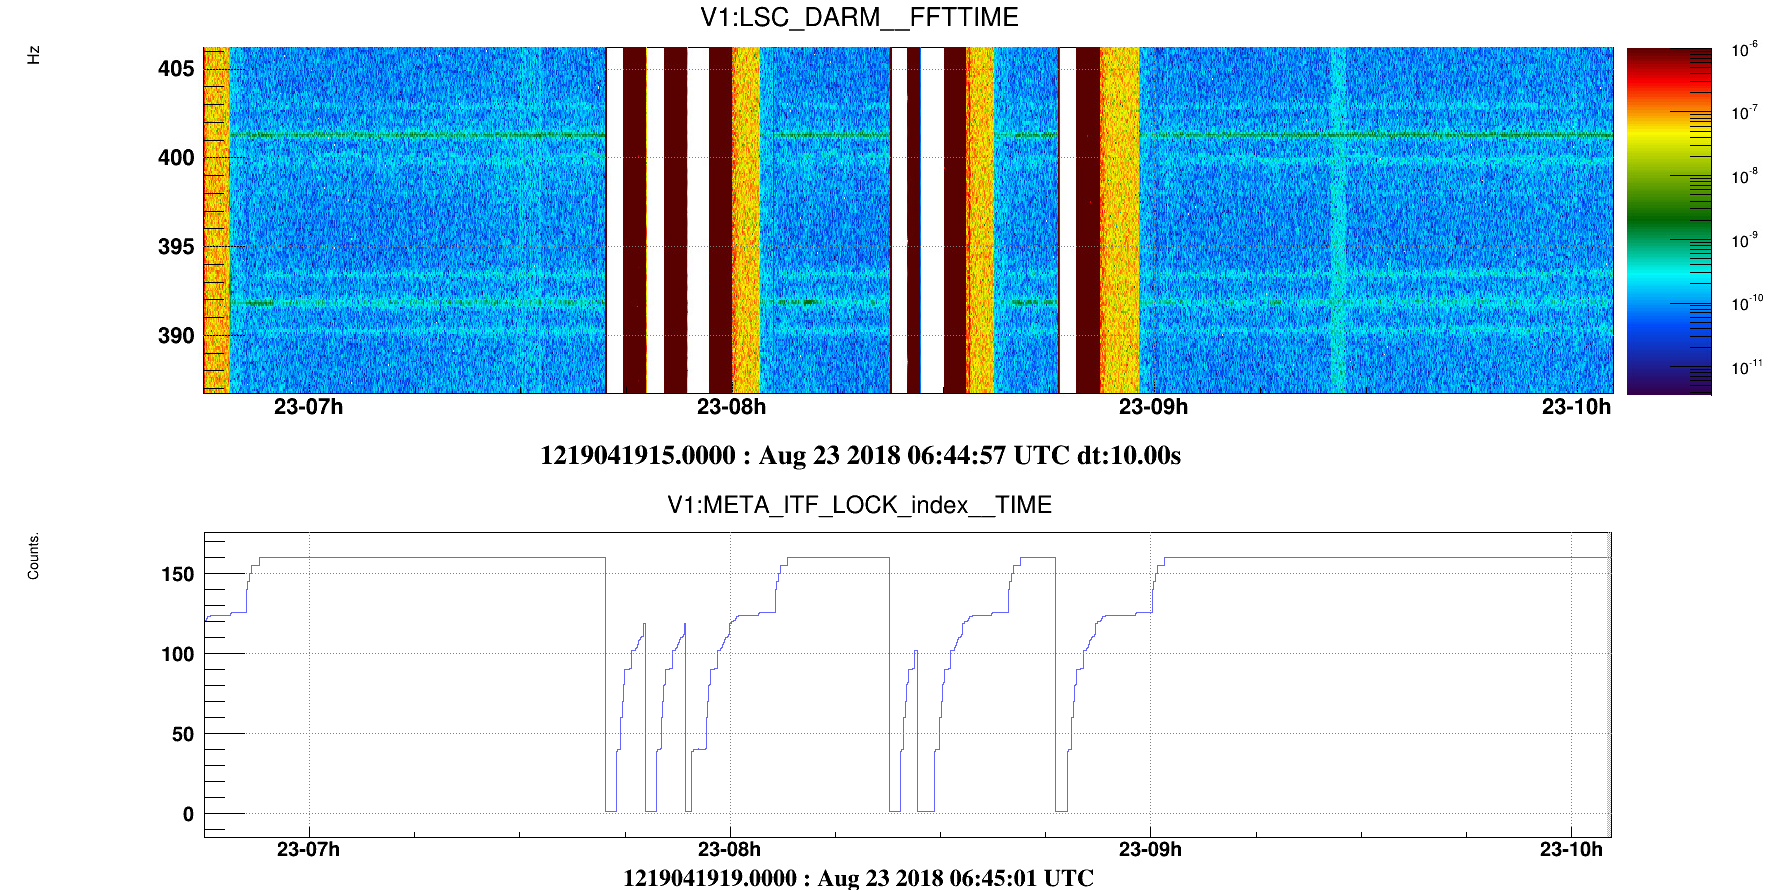
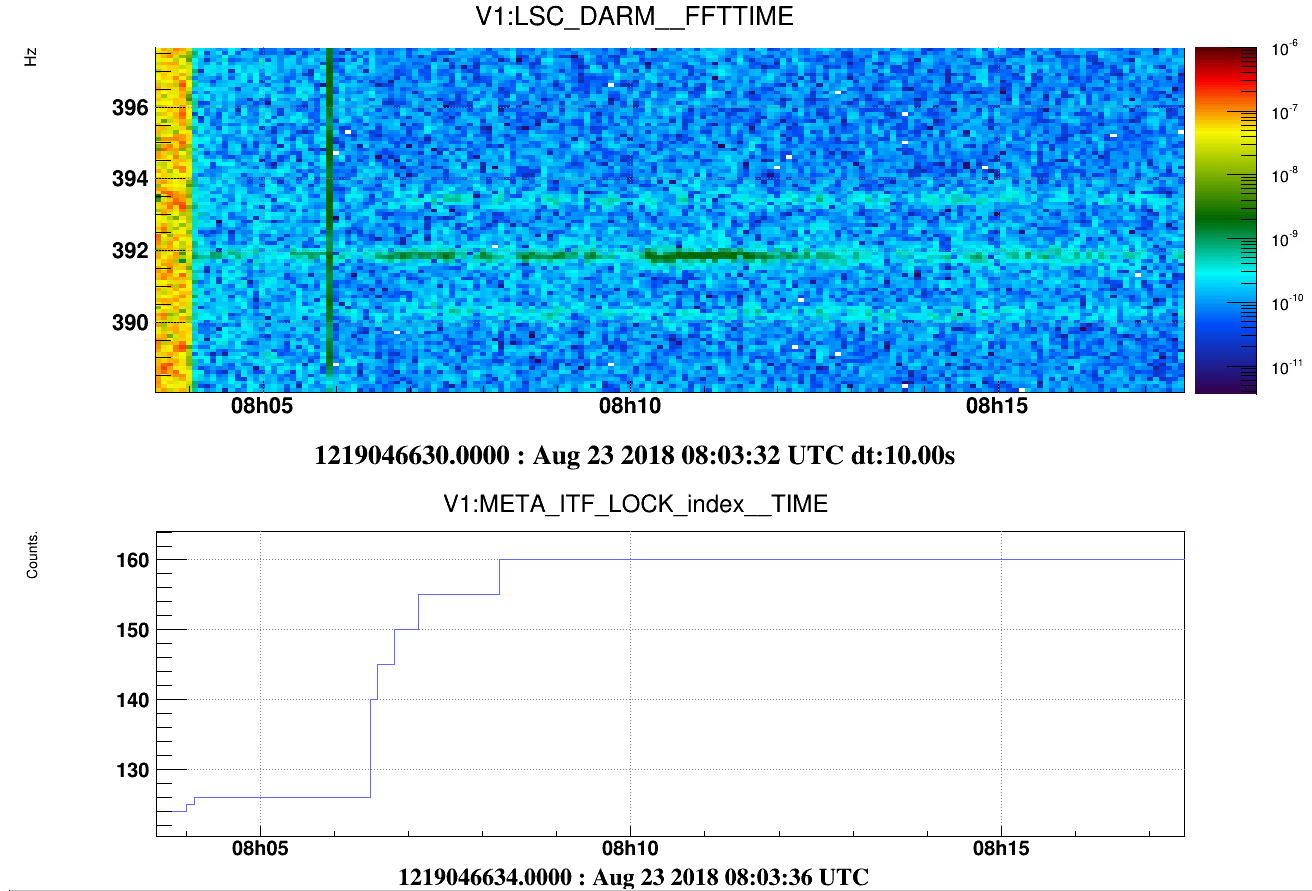
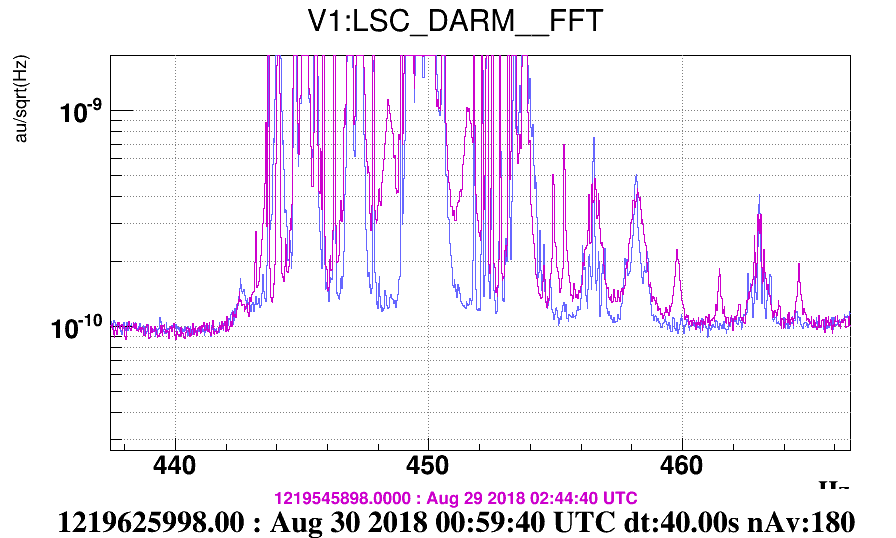
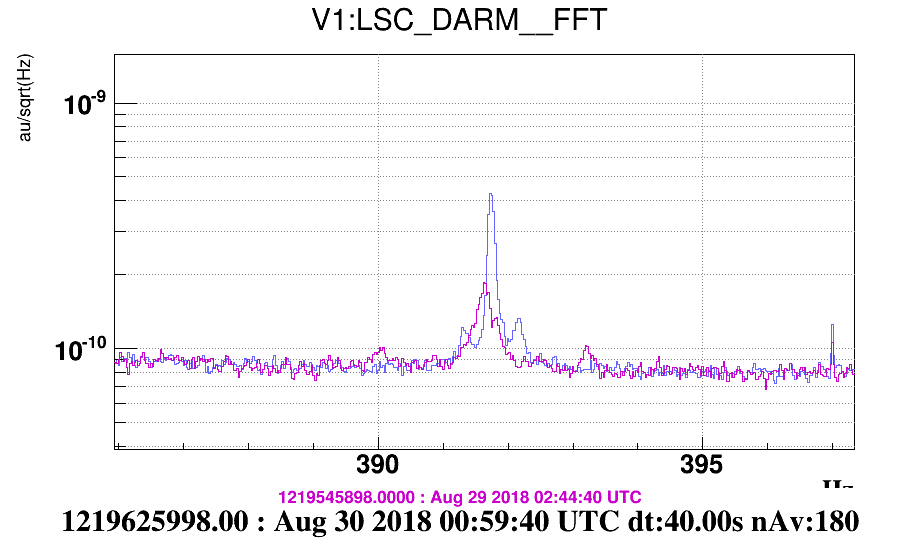
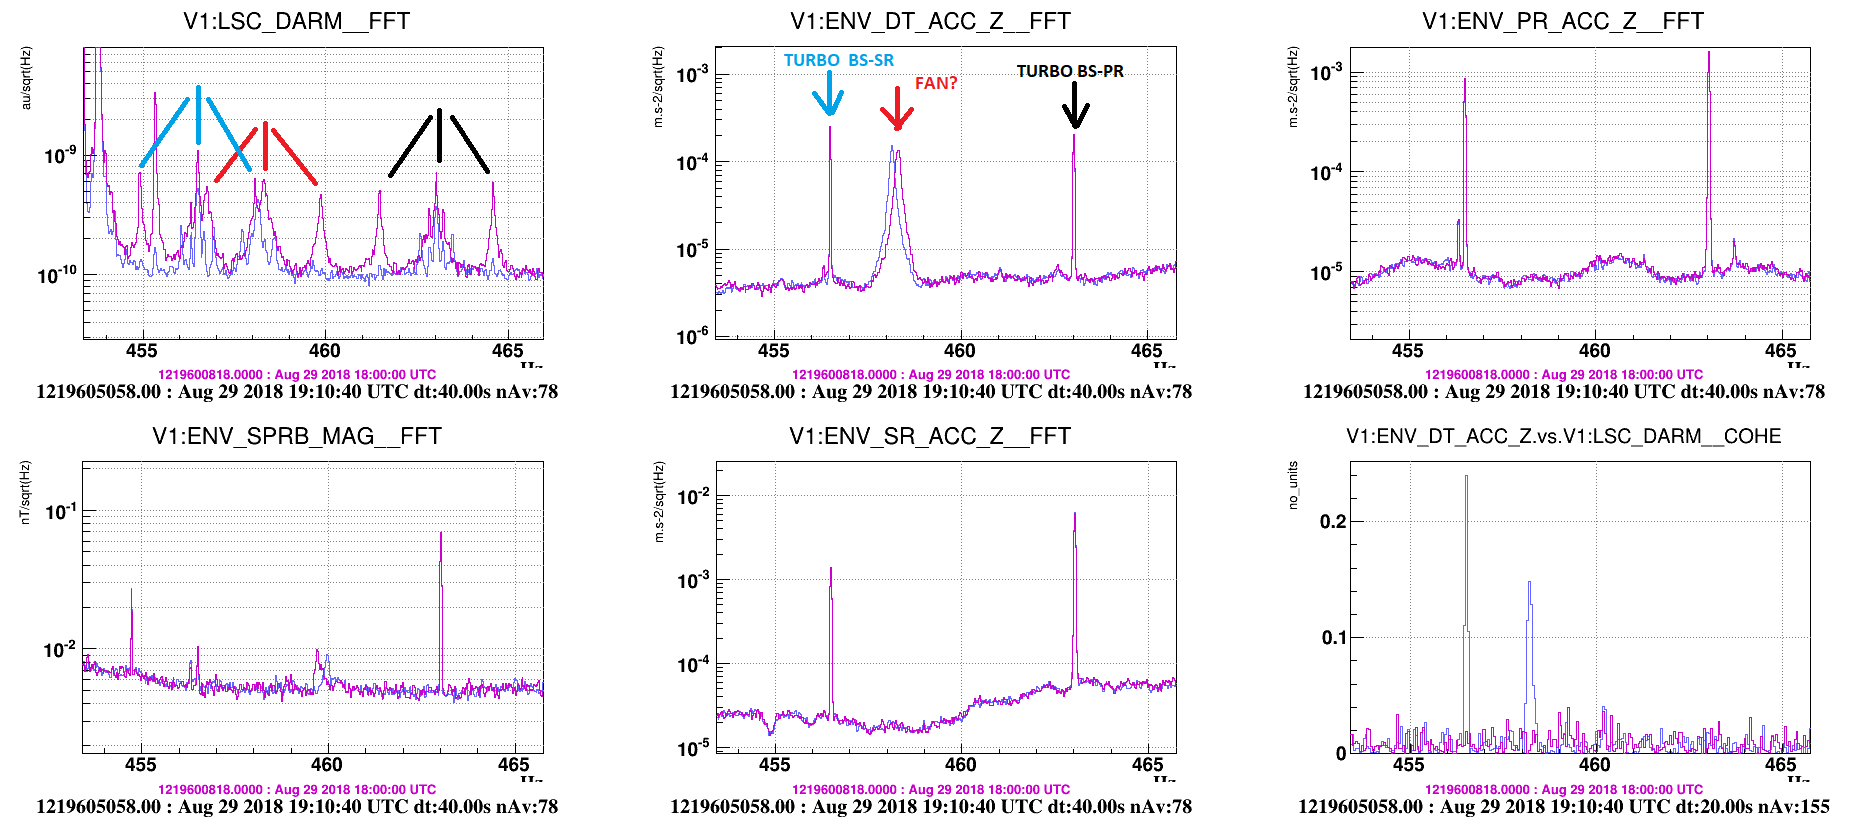
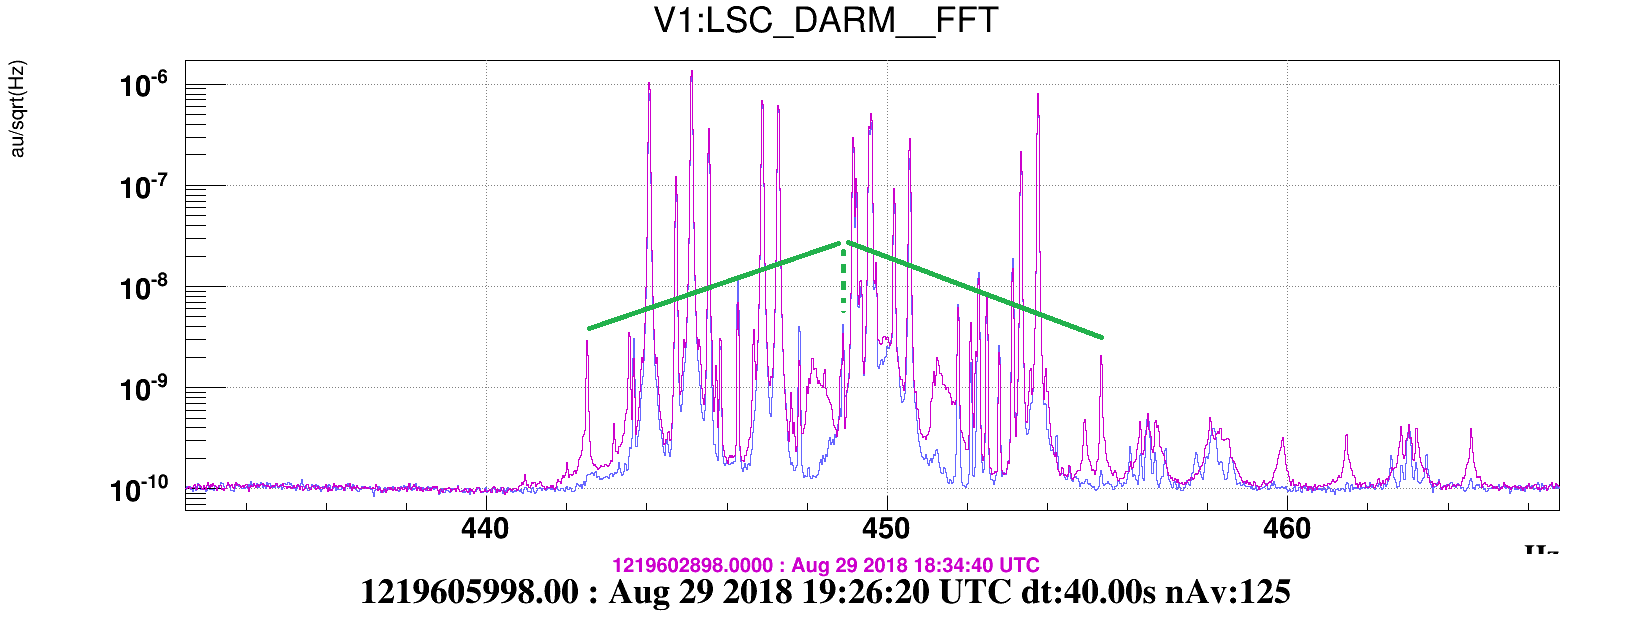
Looks that sidebands with a similar offset are present also around spectral lines at 392Hz, and 401Hz that have seismic origin: Figure 4.

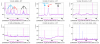
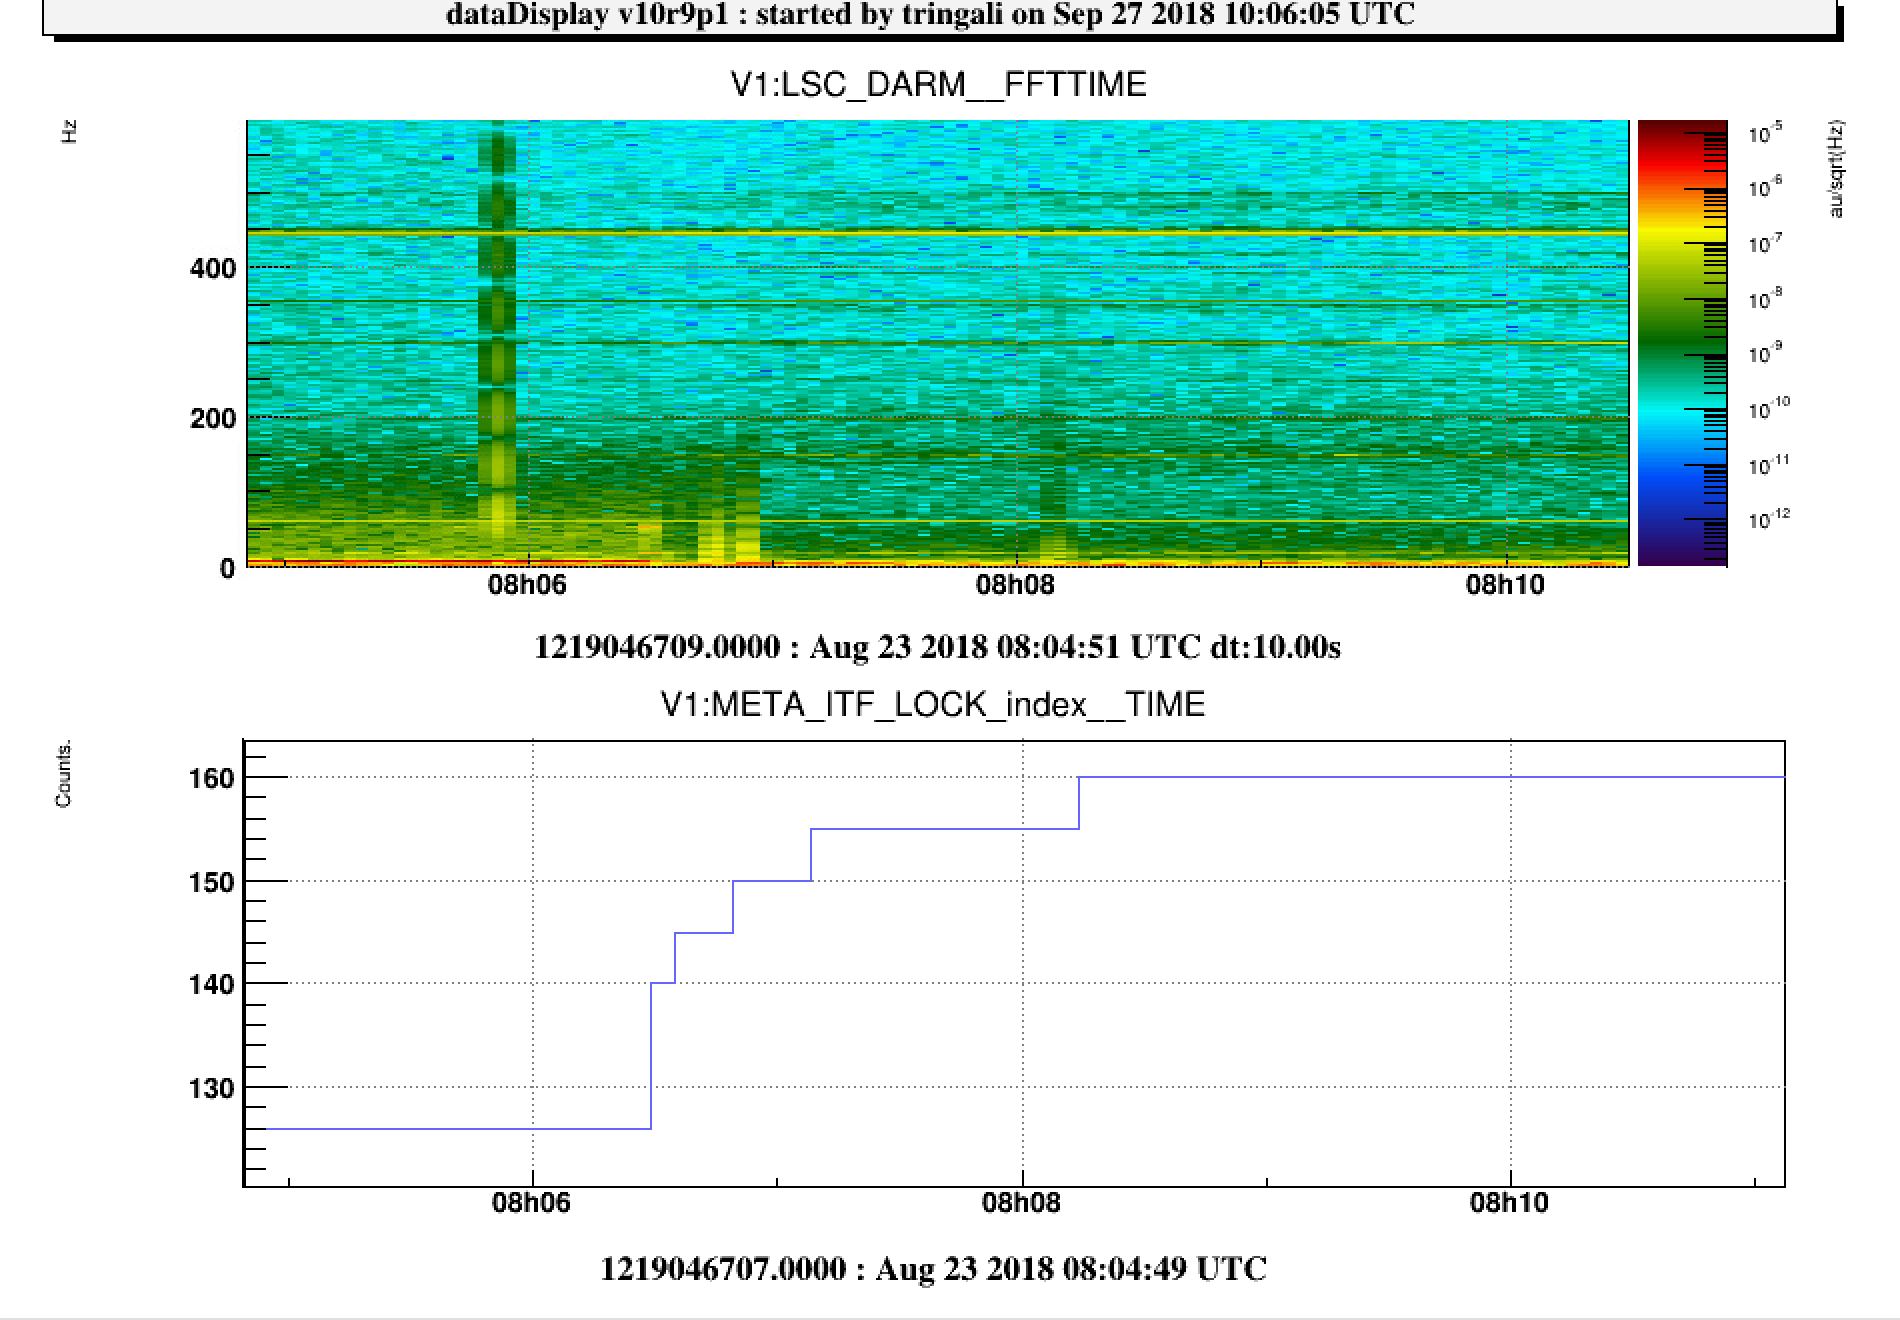
One additional observation is that these sidebands seem to onset (or worsen) when the ITF lock reaches step index 150; this seems pretty clear for the 200Hz (Figure 5) and for the 150Hz (Figure 6). Less clear for the 300Hz (Figure 7) and 393Hz (Figure 8).


Images attached to this report
Comments to this report:
fiori, patricelli, paoletti - 18:50 Wednesday 05 September 2018 (42630) Print this report

DARM sideband noise improved significantly after the work on COMM and DIFF global angular controls and their oscillation at 1.5Hz. The improvement is noticeable in particular around 300Hz, 350Hz, 450Hz: see Figure 1. Also the "comb" of peaks around 460Hz mentioned in 42511 (see picture) are removed: Figure 2 and Figure 3.  There is no much improvement around the 150Hz. As well also the sidebands around 392Hz peak noted in 42511) are still there (Figure 9).

The non-linear tool by Barbara (see 42158)  nicely spotted (a posteriori.... ) the correlation between sideband noise around 50Hz harmonics in DARM and the DIFFp, COMMp, ... signals: Figure 4, Figure 5, Figure 6, Figure 7 (the AA signal is used to modulate the UPS signal that works as carrier of 50Hz and multiples, the bottom plot shows the coherence  of this modulated signal and DARM: the blue and brown curves use the gps times before and after the AA improvement indicated by Paolo in the above mentioned entry). Now also these global AA signals are included in the list of channels for the blind search.

According to this analysis there is still residual coherence: in particular the residual sidebands around 150Hz show some significant coherence with COMMp_TY: Figure 8.

Images attached to this comment
fiori, paoletti - 17:38 Friday 07 September 2018 (42651) Print this report

A better look at the "comb" of peaks around 460Hz noticed in DARM on August 23 and mentioned in 42511

We managed more or less to identify them: see Figure 1

  • 463 Hz comes from SR-BS turbo pump, and it carries two sideband peaks at +-1.5 Hz
  • 458 Hz is likely a fan close to DT tower, and has  two sideband peaks +-1.5 Hz away
  • 456.5 Hz comes from SR-BS turbo, and has two sideband peaks +-1.5 Hz away

the sideband peaks disappeared on Aug 29 because of reduced AA oscillations at 1.5Hz (see this spectrogram), while the coherence with DT tower accelerometer increases (Figure1)

  • 455.3 Hz peak  which disappears as well at the same time (Figure 2) can be paired with another peak at 442.5 Hz (Figure 3). This pair could be interpreted as as sidebands 6.4Hz away from a central peak at 448.9 Hz which fall within the forest of violins.

The big difficult question is: where is happening the non linearity that causes this sidebands? It would be of course important to find out since as noticed in 42630 there is residual sideband noise, at least around 150Hz., which seems correlated to AA.

Images attached to this comment
mwas - 8:28 Monday 10 September 2018 (42659) Print this report
The OMC is a place where alignment can couple bilinearly to the dark fringe, and that coupling should be proportional to the OMC1 misalignment. On the weekend of Aug 18-19 the drop by a factor 2 in the ITF optical gain. So if the +/-1.5Hz side-bands of large lines became worse during that weekend by a factor few, then investigating more the dependence of the side-bands on OMC1 alignment could be useful. If the side-bands changed by less than a factor 2, then OMC alignment can be excluded as the cause.
Tringali, Fiori, Paoletti, Singh - 16:07 Wednesday 03 October 2018 (42857) Print this report

As it is reported in Virgo entry 42527, in order to understand the behaviour of sideband during the ITF locking steps, we have analyzed the data of August 23.

Figure 1 shows the spectrogram of LSC_DARM chanel and the corrisponding time evolution of META_ITF_LOCK_index.

In the other attached figures, it is reported the FFT of LSC_DARM computed during the locking step numbers : 140, 145, 150, 155 ,160 (overlaped with differen colors).

Each figure shows the zoom of FFT around: 150Hz, 200 Hz, 300Hz, 350Hz.

When ITF LOCK index is equal to 145,  the sidebands arise around spectral lines at 150Hz (see Figure 2) , 200Hz (see Figure 3), 300Hz (see Figure 5), 350Hz (see Figure 6).

Images attached to this comment
Search Help
×

Warning

×