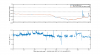
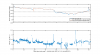
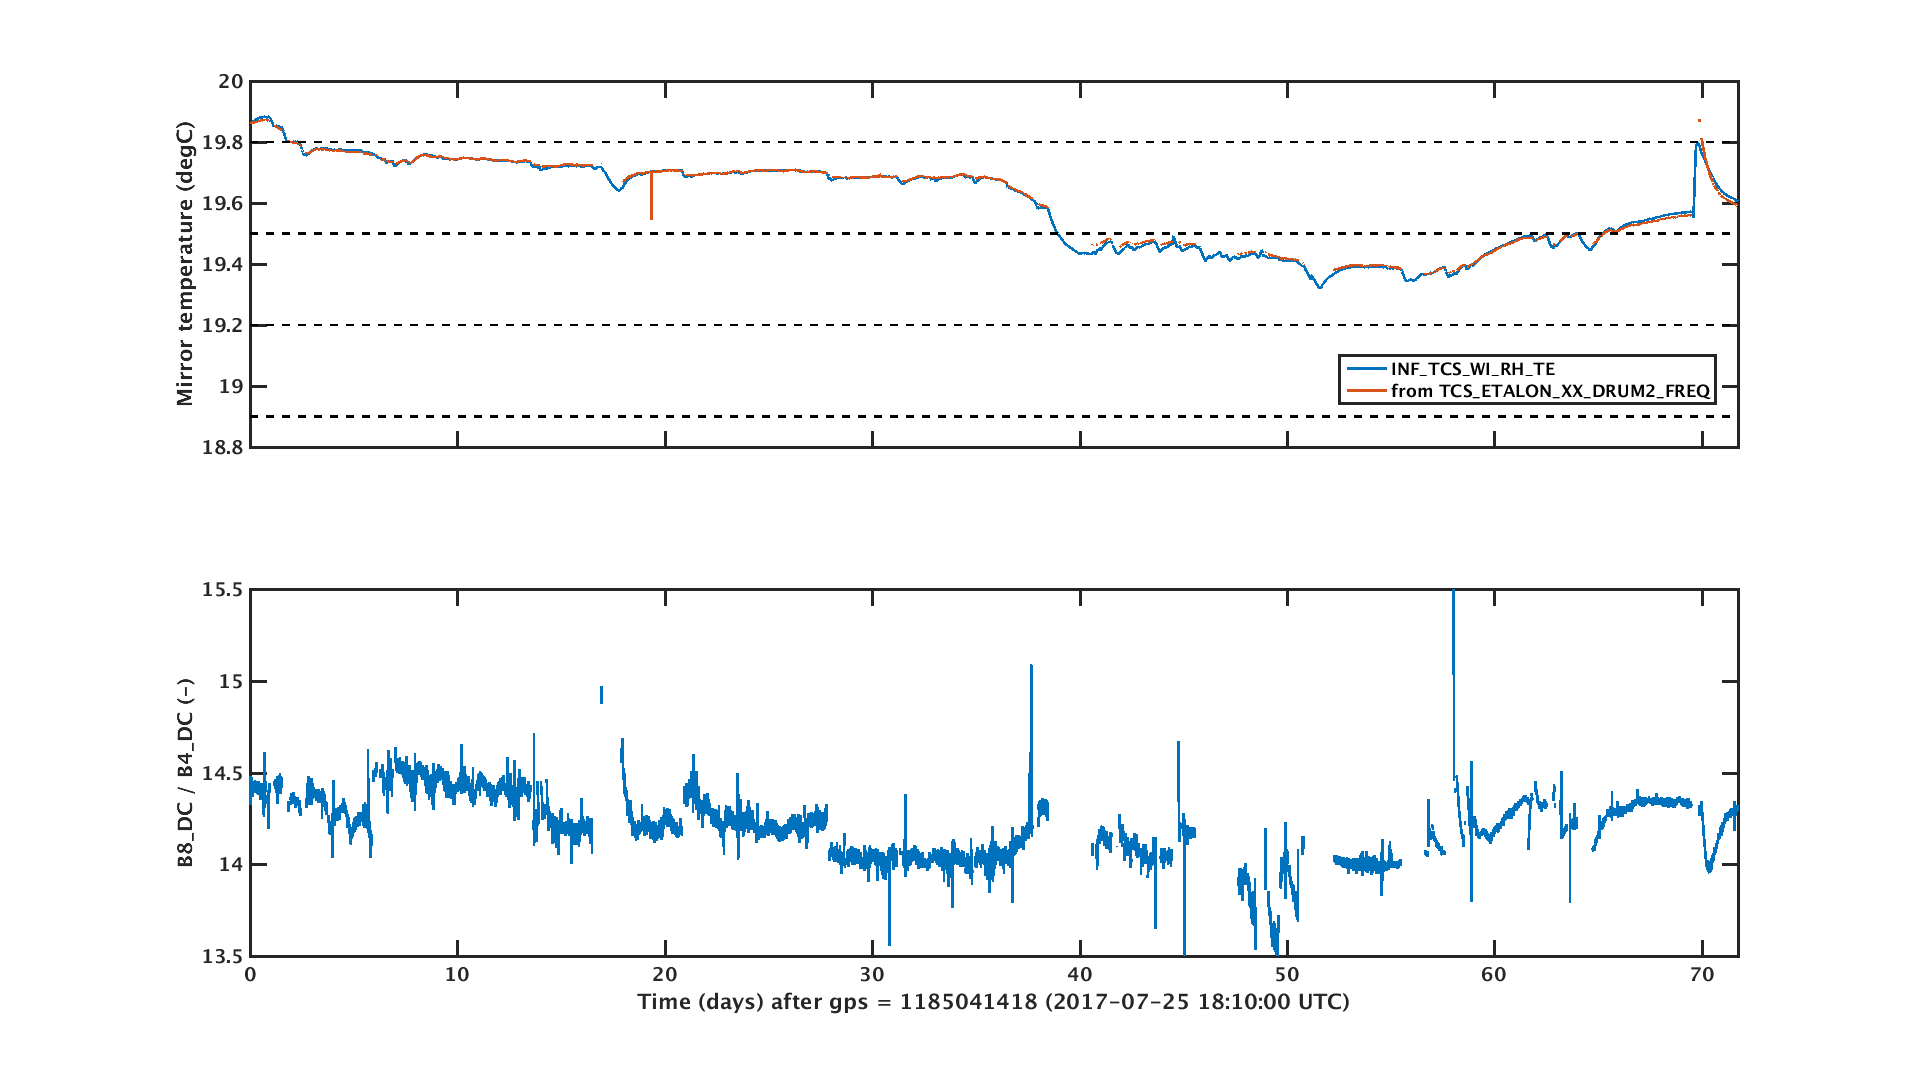
Fig 1 and 2 show the input mirror temperature and normalized transmission for both arms over more than 2 months. The dashed horizontal lines in the top panel indicate an expected spacing of 0.3 K per fringe. The temperature was very stable during the O2 run (roughly the first half of the plots), it changed by less than one fringe for both mirrors. After that a few events finally moved the etalon:
-the drop in temperature halfway through the plot, this might be related to some issues with the air conditioning of the building (to be confirmed).
-the two bumps seen around day 64 for the NI are due to tests with the ring heater.
-the exponential cool-downs around day 70 are related to the closing and reopening of the valves of the big cryotraps.
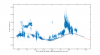
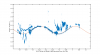
Fig 3 and 4 show the usual etalon plots for the north and west arms, where the normalized transmission is plotted vs the the drum-mode frequency. The plots are not yet as clear as in the past, this might be do to various drifts in the alignment of the optical benches. The cleanest part of the curves corresponds to the cryotrap event, during which the etalon changed by almost a complete fringe. The sines are fitted by eye, and were only adjusted in amplitude, offset and phase. The period has not been adjusted, this is taken directly from the previous mentioned 0.3 K per fringe and the calibration of the drum modes of 0.882 Hz/K for NI and 0.874 Hz/K for the WI. Preliminary values for the variation in the transmission are 1.2% peak-peak for the north arm and 2.6% for the west arm, but we have to wait for cleaner data to give final numbers. To be checked if these numbers are compatible with the expected values from the coating measurements.
The relative variation of the transmitted power (directly linked to the optical gain and so the finesse) can be found here: post 29459
For West arm, R_WIM_AR = 60 ppm -> variation of transmitted power of ~ 3%
For North arm, R_NIM_AR = 30 ppm -> variation of transmitted power of ~ 2%