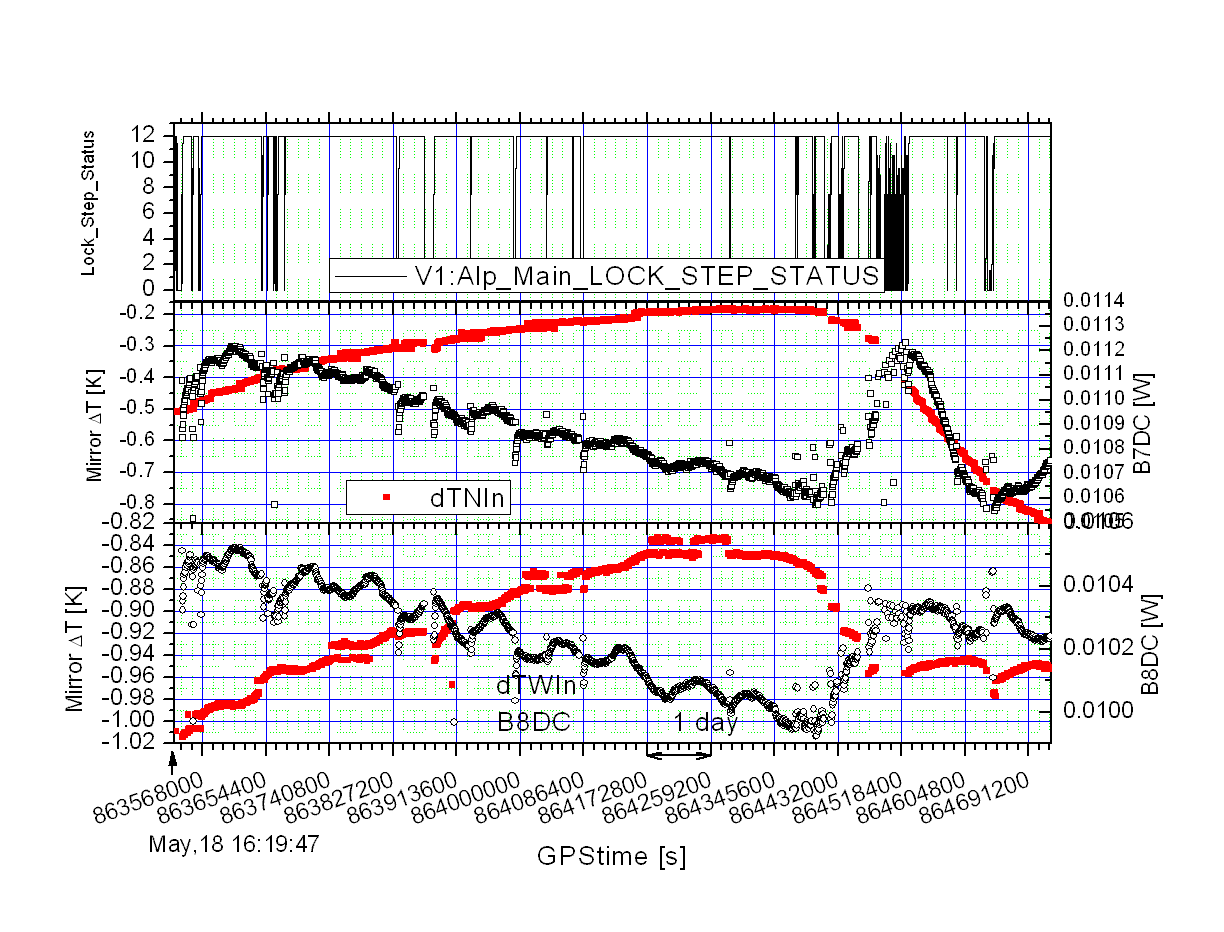
After a long monitoring of the mirror temperatures it is possible to state that we have ethalon effect (at least in the NI mirror). The large temperature fluctuation in the last days and the switching off of the optical calibrator power supply (see entries 16578 and 16604) permitted to the NI temperature to span more that one half of the temperature period in the ethalon effect. In the first attached figure the usual three plots stack is shown and in the NI mirror is well visible the oscillation of the transmitted power when the temperature continuosly decreases. This is the signature of the ethalon effect.
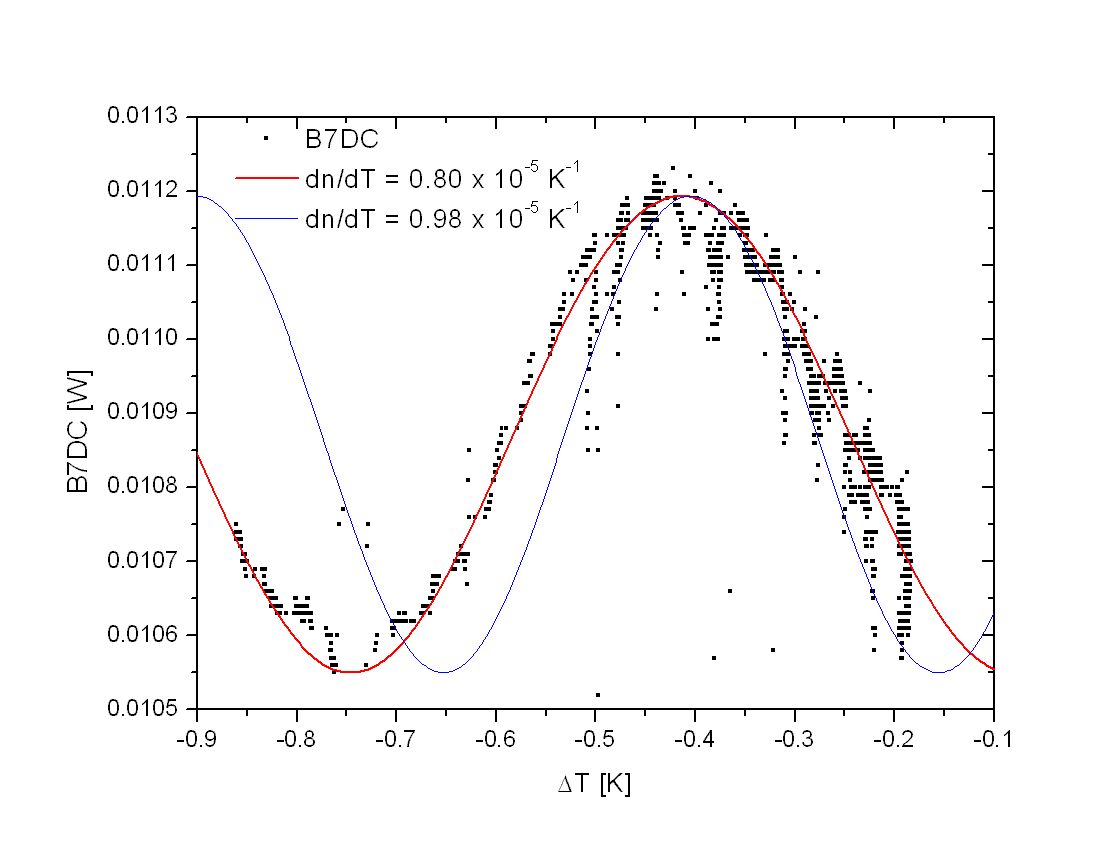
In the second plot is reported the first interesting "detector characterization" effect of this measurement. The transmitted power fluctuation has been plotted versus the temperature variation to reconstruct the sinusoidal behavior. The two curves overimpressed are the expected modeled power variations. To match the amplitude of the oscillation I tuned the reflectivity r1 of the AR coating of the NI mirror to 300ppm (I invite optical experts to check the simply formulas I‘m using that are reported in the note:
https://tds.virgo-gw.eu/ql/?c=1832&calledFile=VIR-001A-07.pdf
and to help me to improve this characterization).
To match the thermal period of the oscillation the key parameter is the refraction index gradient (dn/dT). This number (important in the thermal compensation business) is unknown for the Virgo mirrors and until now the 0.98E-5 K^-1 value has been used because it is the LIGO number. The blue curve has been computed with this number and it don‘t match our mirror behavior. A better matching is obtained if a dn/dT=0.80E-5K^-1 is adopted (red curve) .
The few points out of the curve correspond to the locking acquisition transients.
