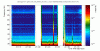
During this shift some tests turning ON the NI RH with the ITF @dark fringe have been performed. The goal was to evaluate the position of the DET-HWS beam on the NI TM in preparation to the NI absorption measurement.
16.02 UTC: RH ON, P_{applied on the RH}=2 W
16.33 UTC: P_{applied on the RH}=4 W
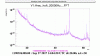
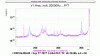
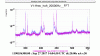
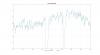
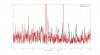
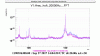
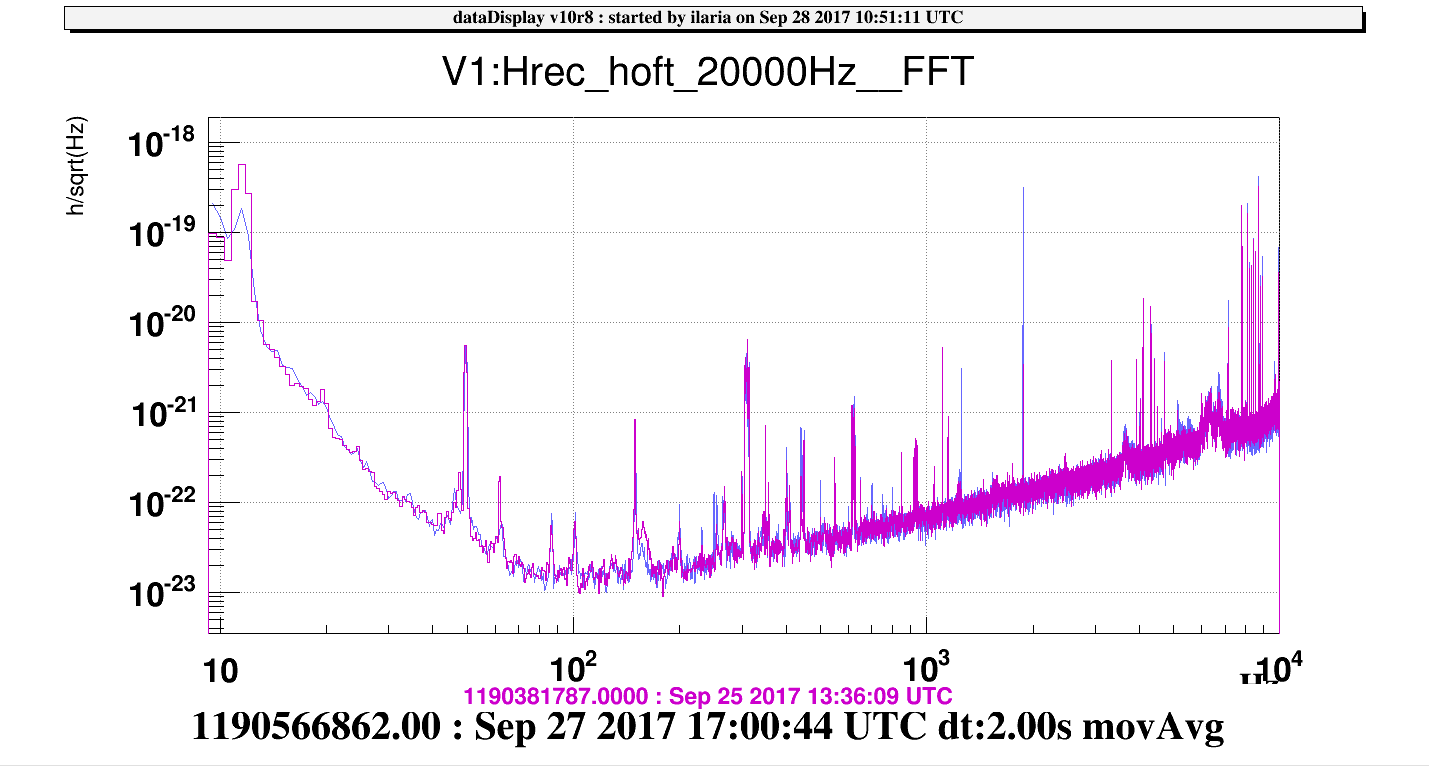
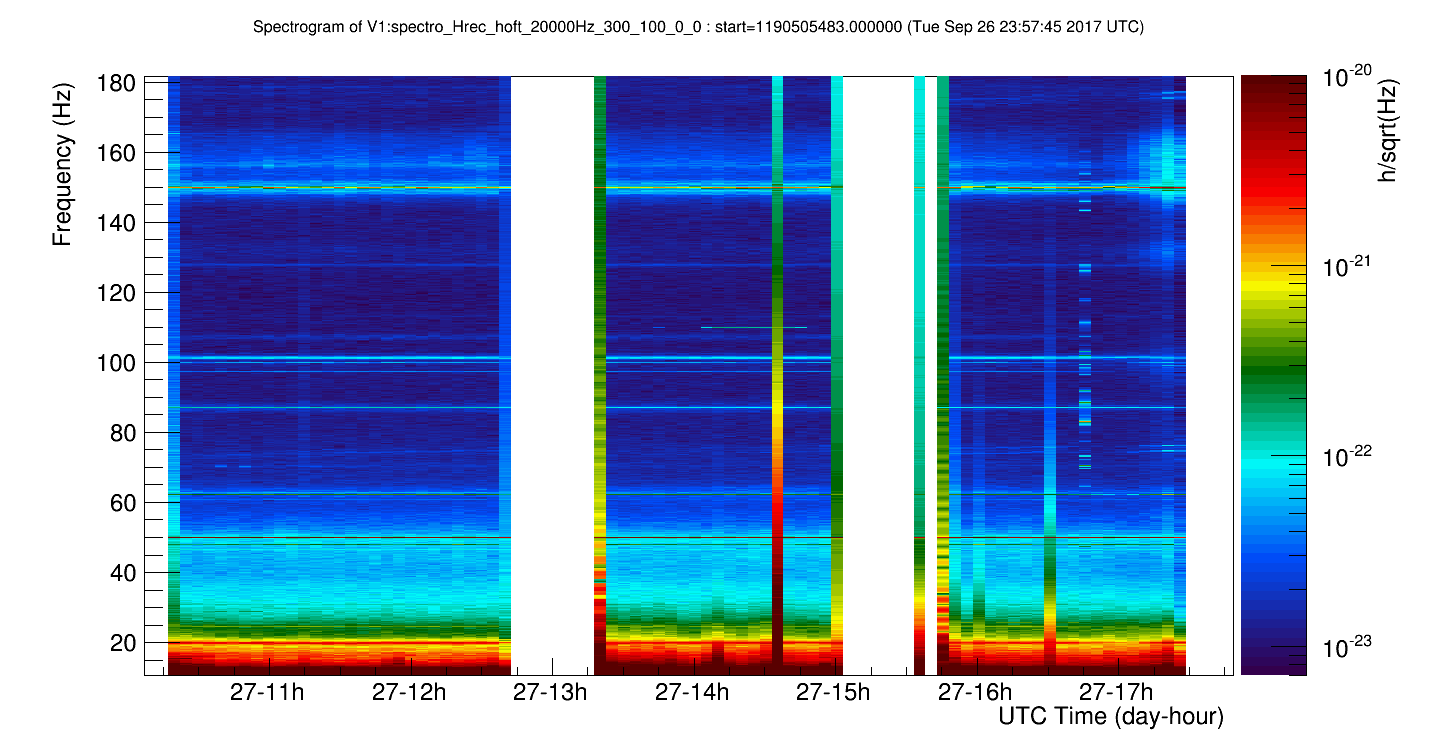
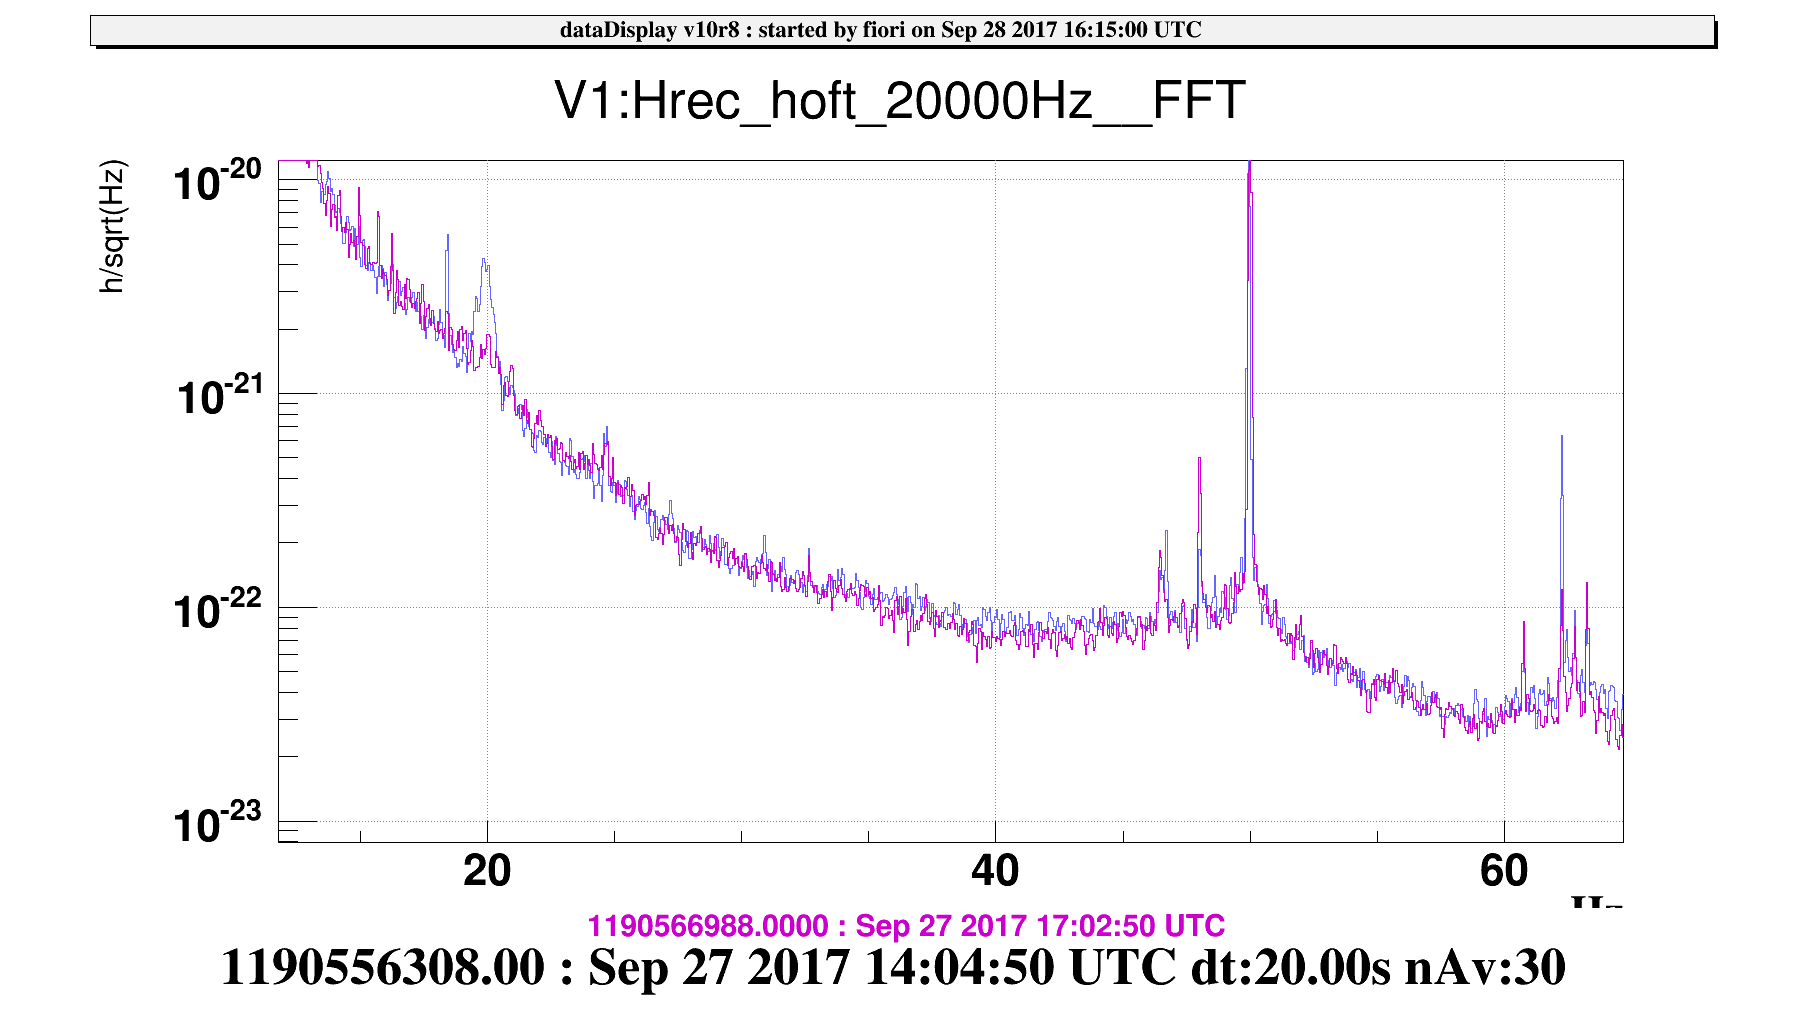
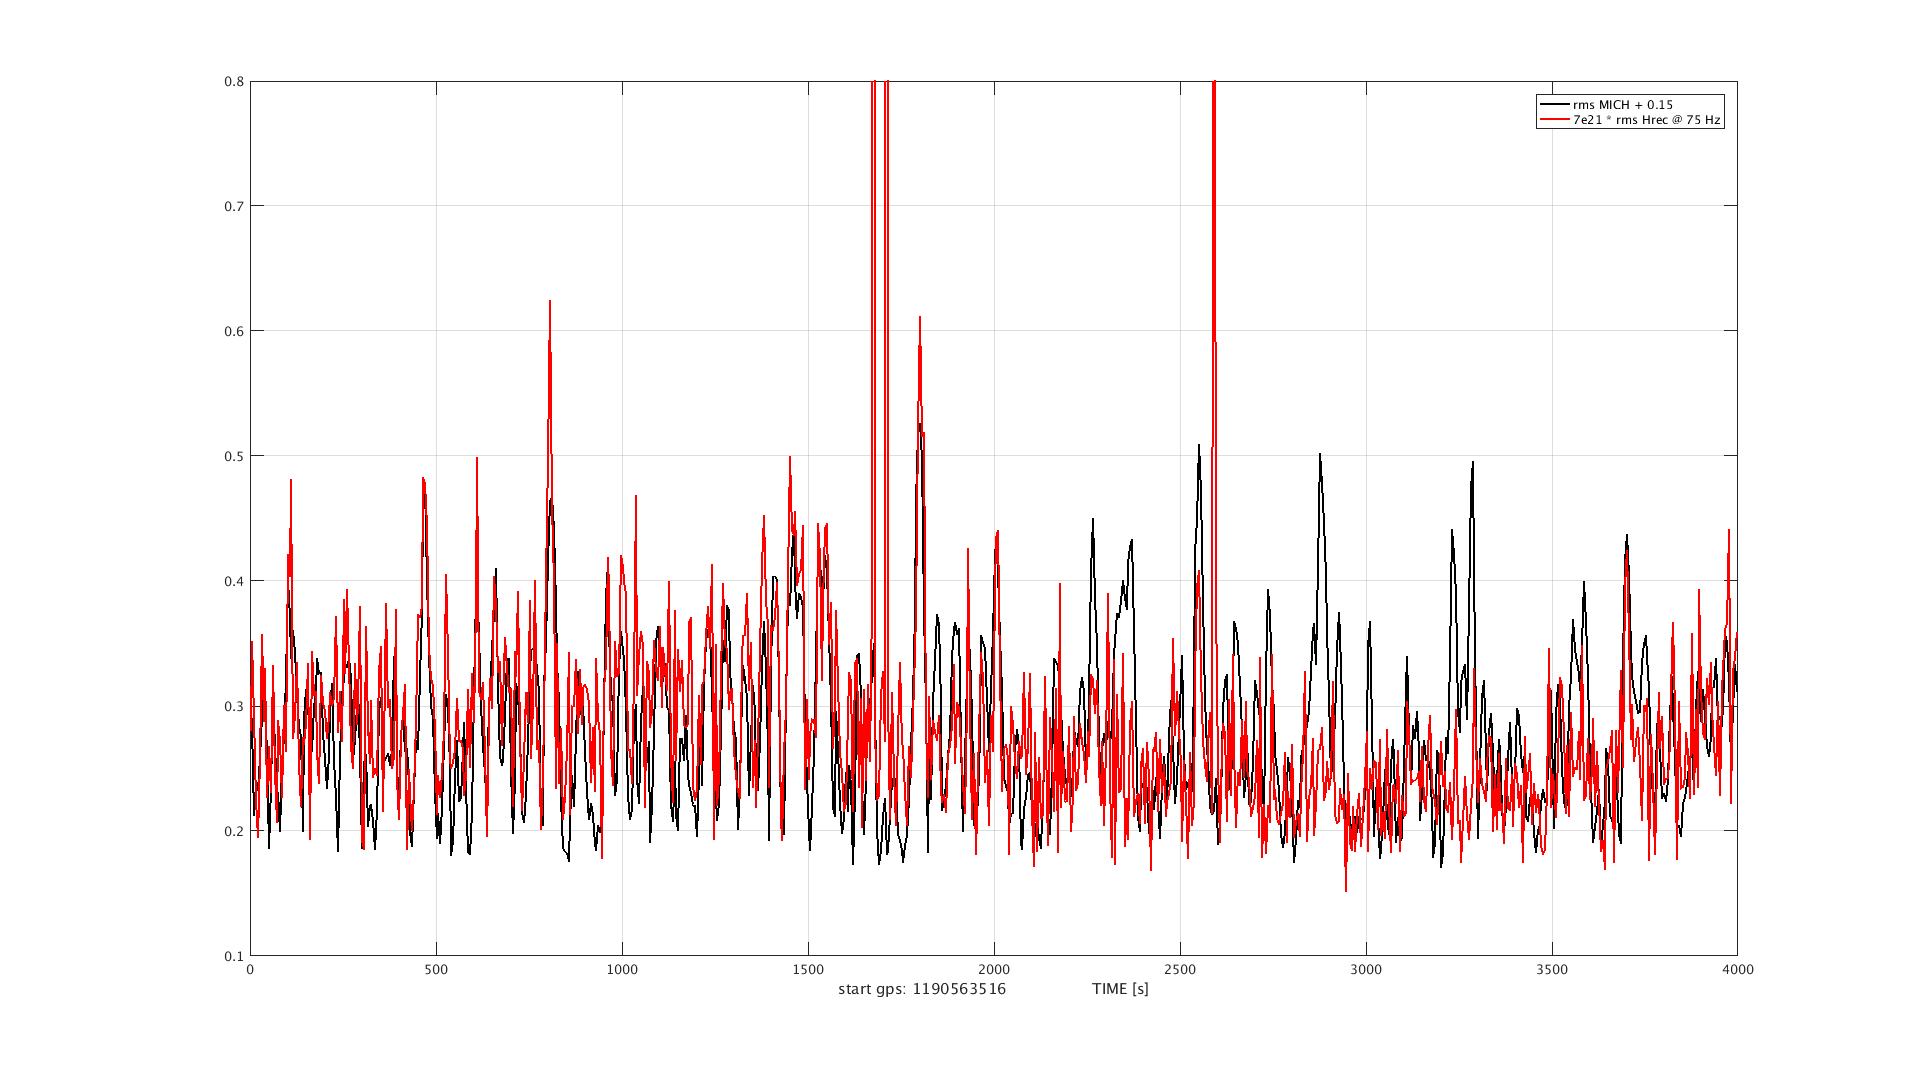
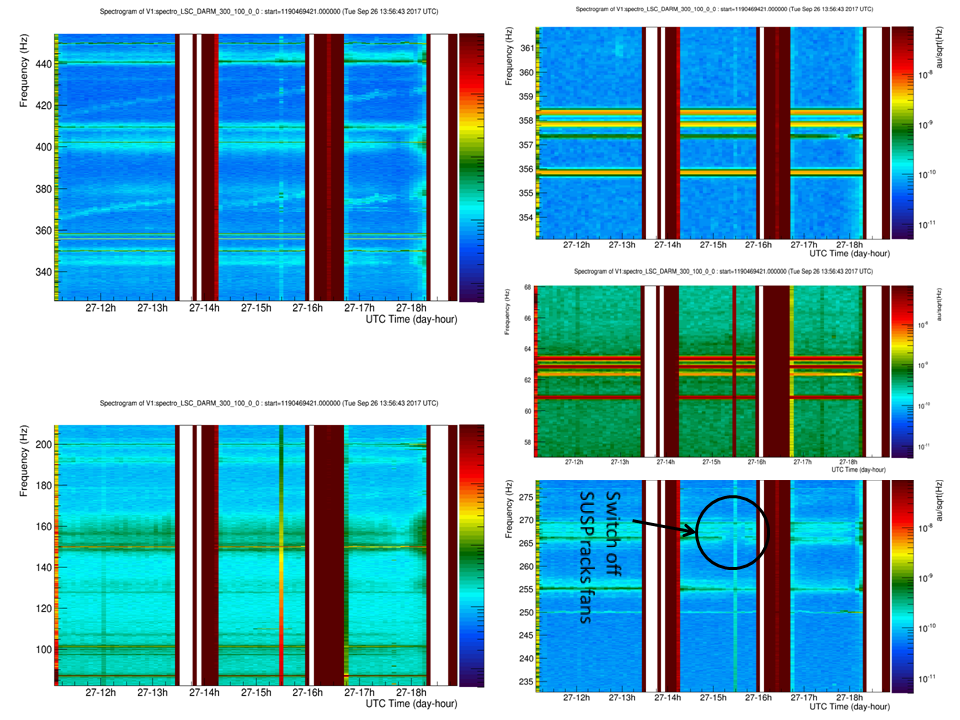
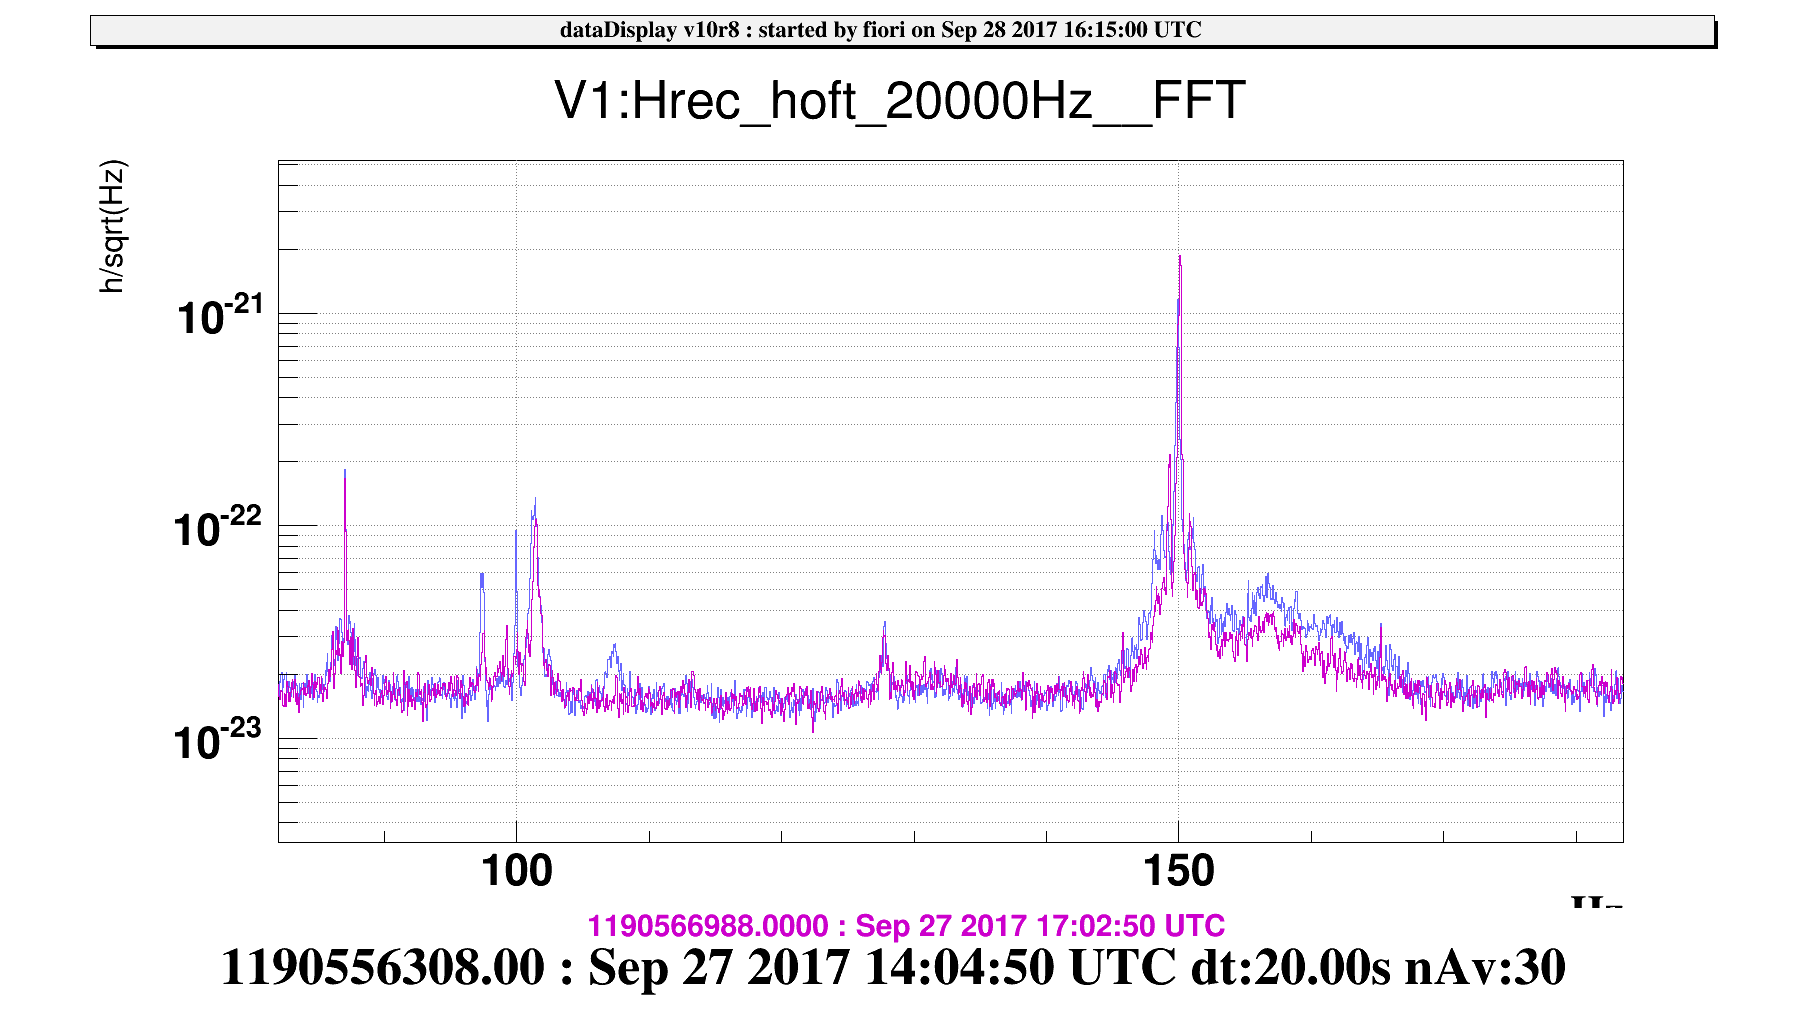
After the increase of power, Paolo noticed an improvement of the sensitivity, in particular a decrease of the peak at 20 Hz and at 155 Hz have been observed.
After half an hour a worsening of the sensitivity curve has been observed and the RH power has been reduced to 2W (17.22 UTC).
To be investigated.
The RH has been turned OFF at 17.44 UTC.
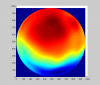
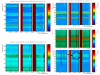
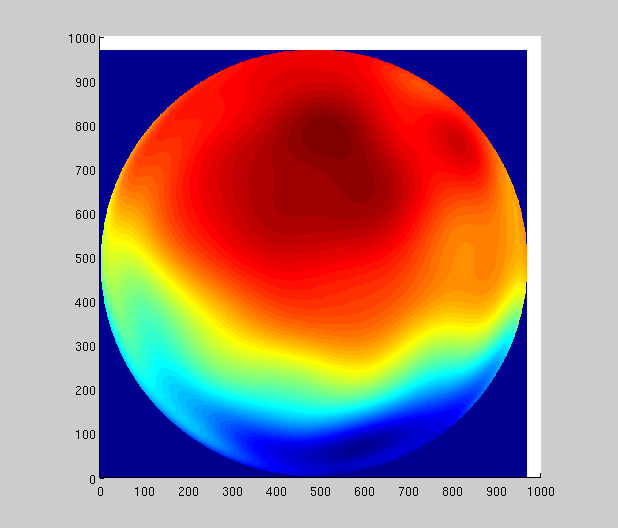
We analyzed the HWS wavefronts and the RH curvature is clearly visibile in the maps, this means that we are enough centered on the TM (see image in attachment).
The measurement of the NI absorption is postponed to tomorrow morning shift, because of the unlock of the IMC (see operator report).
After half an hour a worsening of the sensitivity curve has been observed and the RH power has been reduced to 2W (17.22 UTC).
To be investigated.
The RH has been turned OFF at 17.44 UTC.
We analyzed the HWS wavefronts and the RH curvature is clearly visibile in the maps, this means that we are enough centered on the TM (see image in attachment).
The measurement of the NI absorption is postponed to tomorrow morning shift, because of the unlock of the IMC (see operator report).
