Reports 1-1 of 1 Clear search Modify search
Environmental Monitoring (Environmental Monitoring)
Tringali, Passaquieti, Fiori - 18:12 Tuesday 18 November 2025 (68181) Print this report
Test on DET HVAC system

This morning, we performed a test on the valves' opening of the DET supply and return air duct distributions in order to evaluate the impact of the noise in DET Lab.

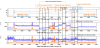
The attached drawings show the distribution of the supply (blue) and return (red) air ducts. The position of the valves along the ducts and in the different areas is indicated by the label RP (regolatore di portata, flow regulator).
The table reports the opening of the valves (checked through  Kieback & Peter interface), which are normally operated in automatic mode, as this is their standard working configuration (unlike those in INJ, which are in manual mode).

*********************  VALVES' OPENING (automatic mode) ******************************

Area Supply valve opening (%) Return valve opening (%)
SAS 0 10
New SAS (nuovo SAS) 8 6
Minitower A (DET area) 22 0
Minitower B (SQZ area) 23 0

0% corresponds to a fully closed valve
100% corresponds to a fully open valve
****************************************************************************************

Before starting the test focusing on the valve of the Minitower A area, we performed a few actions:

  • ~08:38:25 UTC – BACnetServer restarted;

  • ~08:54 UTC – the supply and return fan frequencies (HVAC_FREQ_OUT/IN) were manually fixed at 27.4 Hz and 13.8 Hz, respectively, through the Kieback & Peter control interface → Forzatura Manuale CTA. These values correspond to the operating configuration, which remains unchanged between SCIENCE and ACCESS modes (as referred by Davide Soldani).

  • all the supply and return valves of the four areas were set to 5% opening by switching them from automatic to manual mode. The action times are listed below:

Area of valves Time (UTC) Note
SAS  ~09:07   
New SAS  ~09:21-09:22  
Minitower A (DET area)  ~09:28-09:29  
Minitower B (SQZ area) ~09:35 supply fan starts to oscillate between ~(27-27.4) Hz --> to be checked!


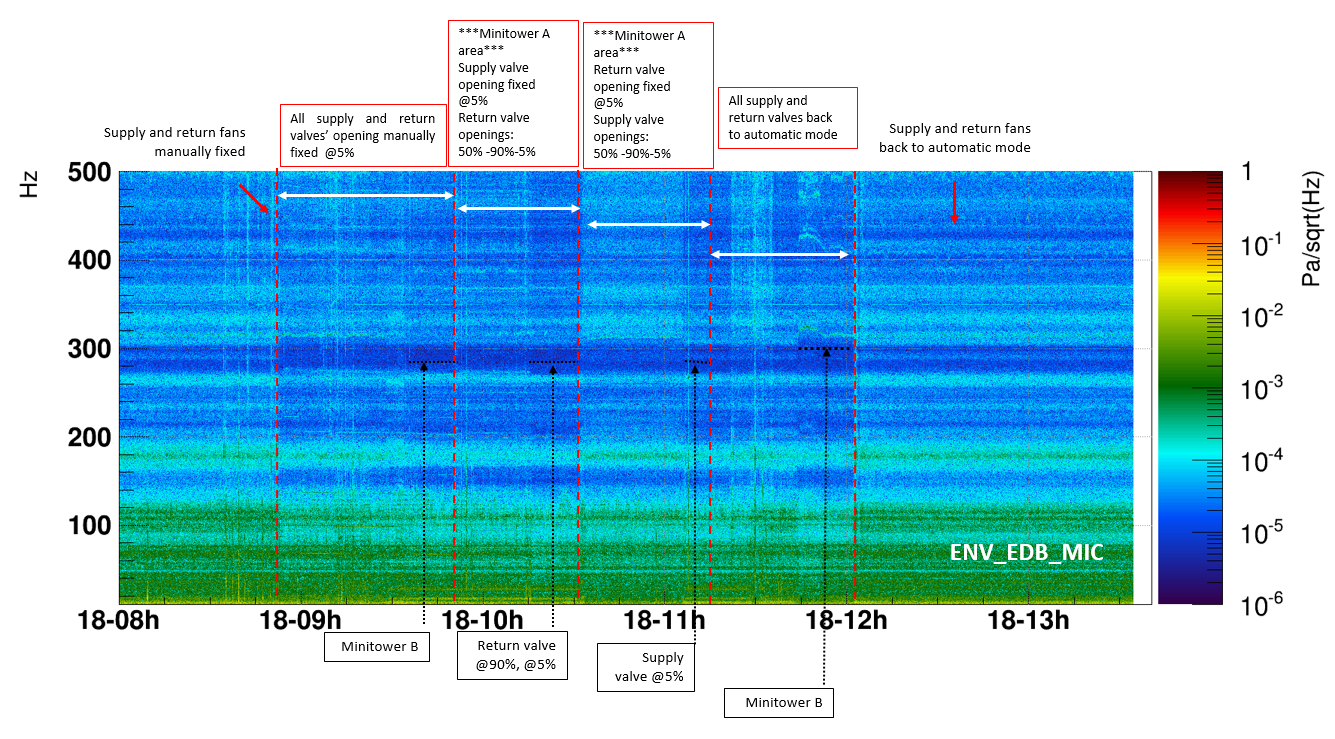
At this point, we changed the opening of the supply and return valves of the **** Minitower A area (DET lab)***:

Time (UTC) Supply valve opening  Return valve opening  Note
~09:54 5% 50%  
~10:09 5% 90%  
~10:24 5% 5%  
~10:31 50% 5%  
~10:46 90% 5%  
~11:05 5% 5%  

At the end of the test, we restored the automatic mode for the valves in each area and then for the fans, performing the actions in sequence:

  Time (UTC)
SAS supply and return valves ~11:15:21 
New SAS supply and return valves ~11:20:49
Minitower A supply and return valves ~11:28:25
Minitower B supply and return valves ~11:43:06
Supply fan ~12:01:06
Return fan ~12:21:36


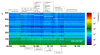
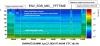
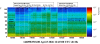
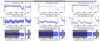
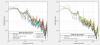
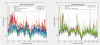
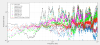
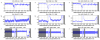
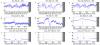
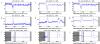
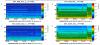
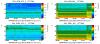
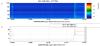
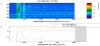
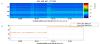
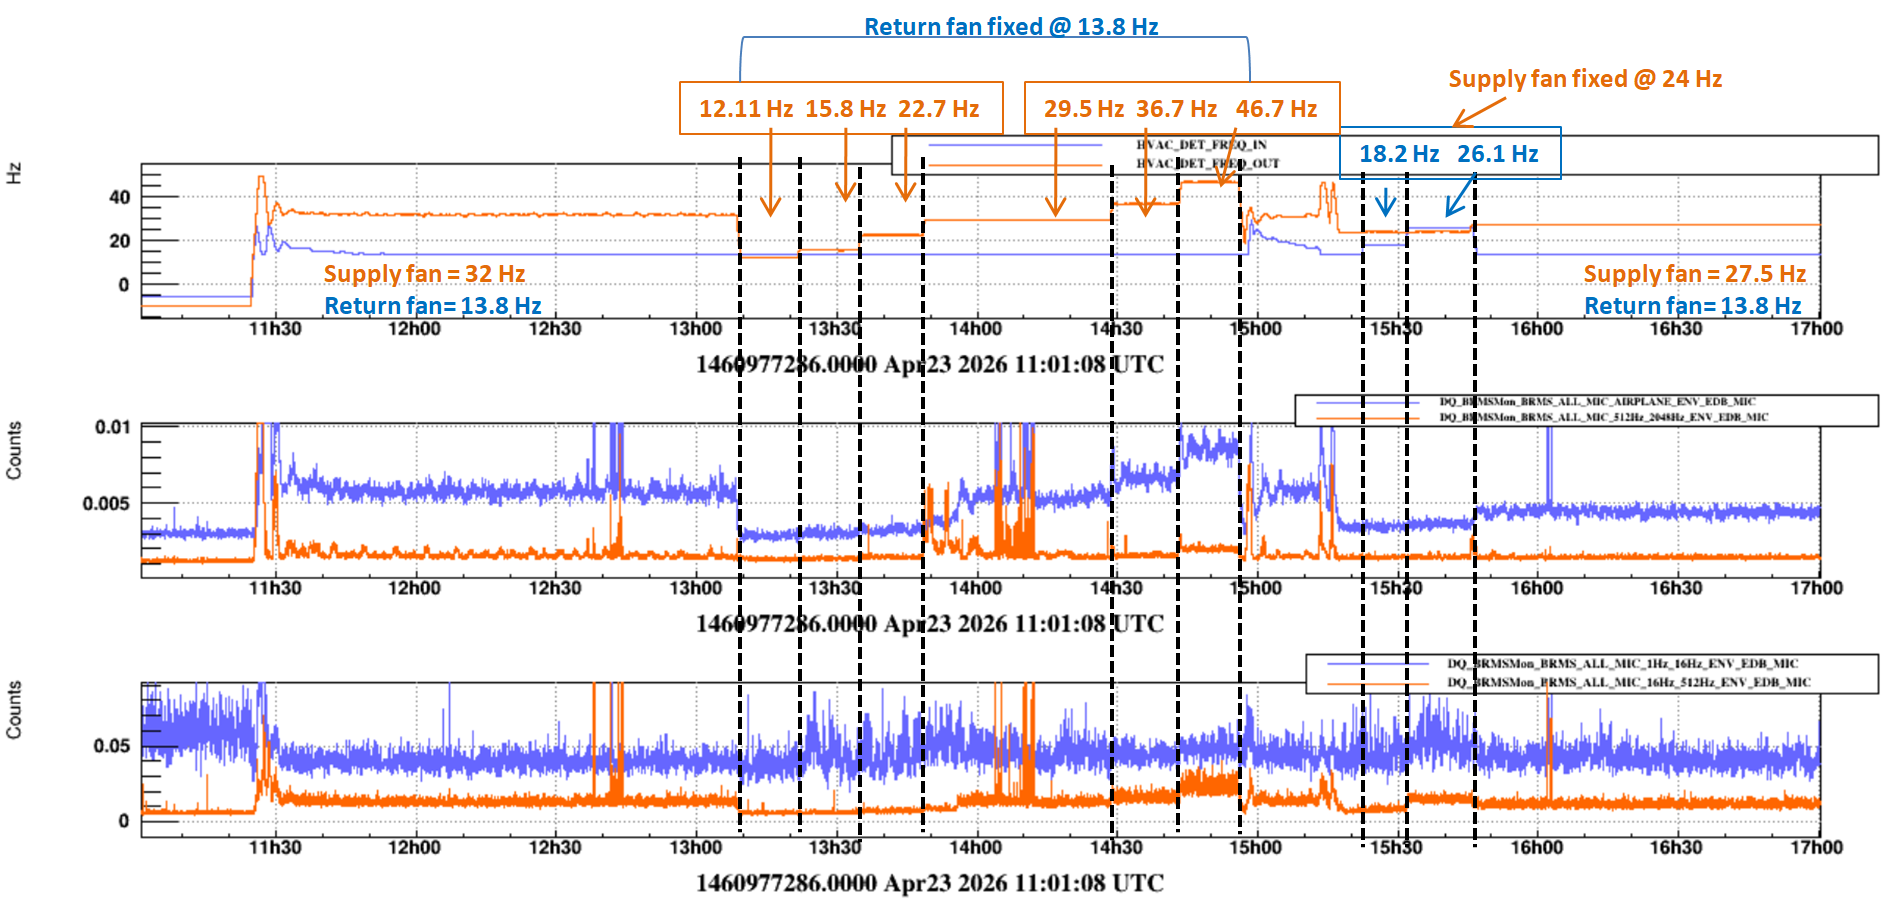
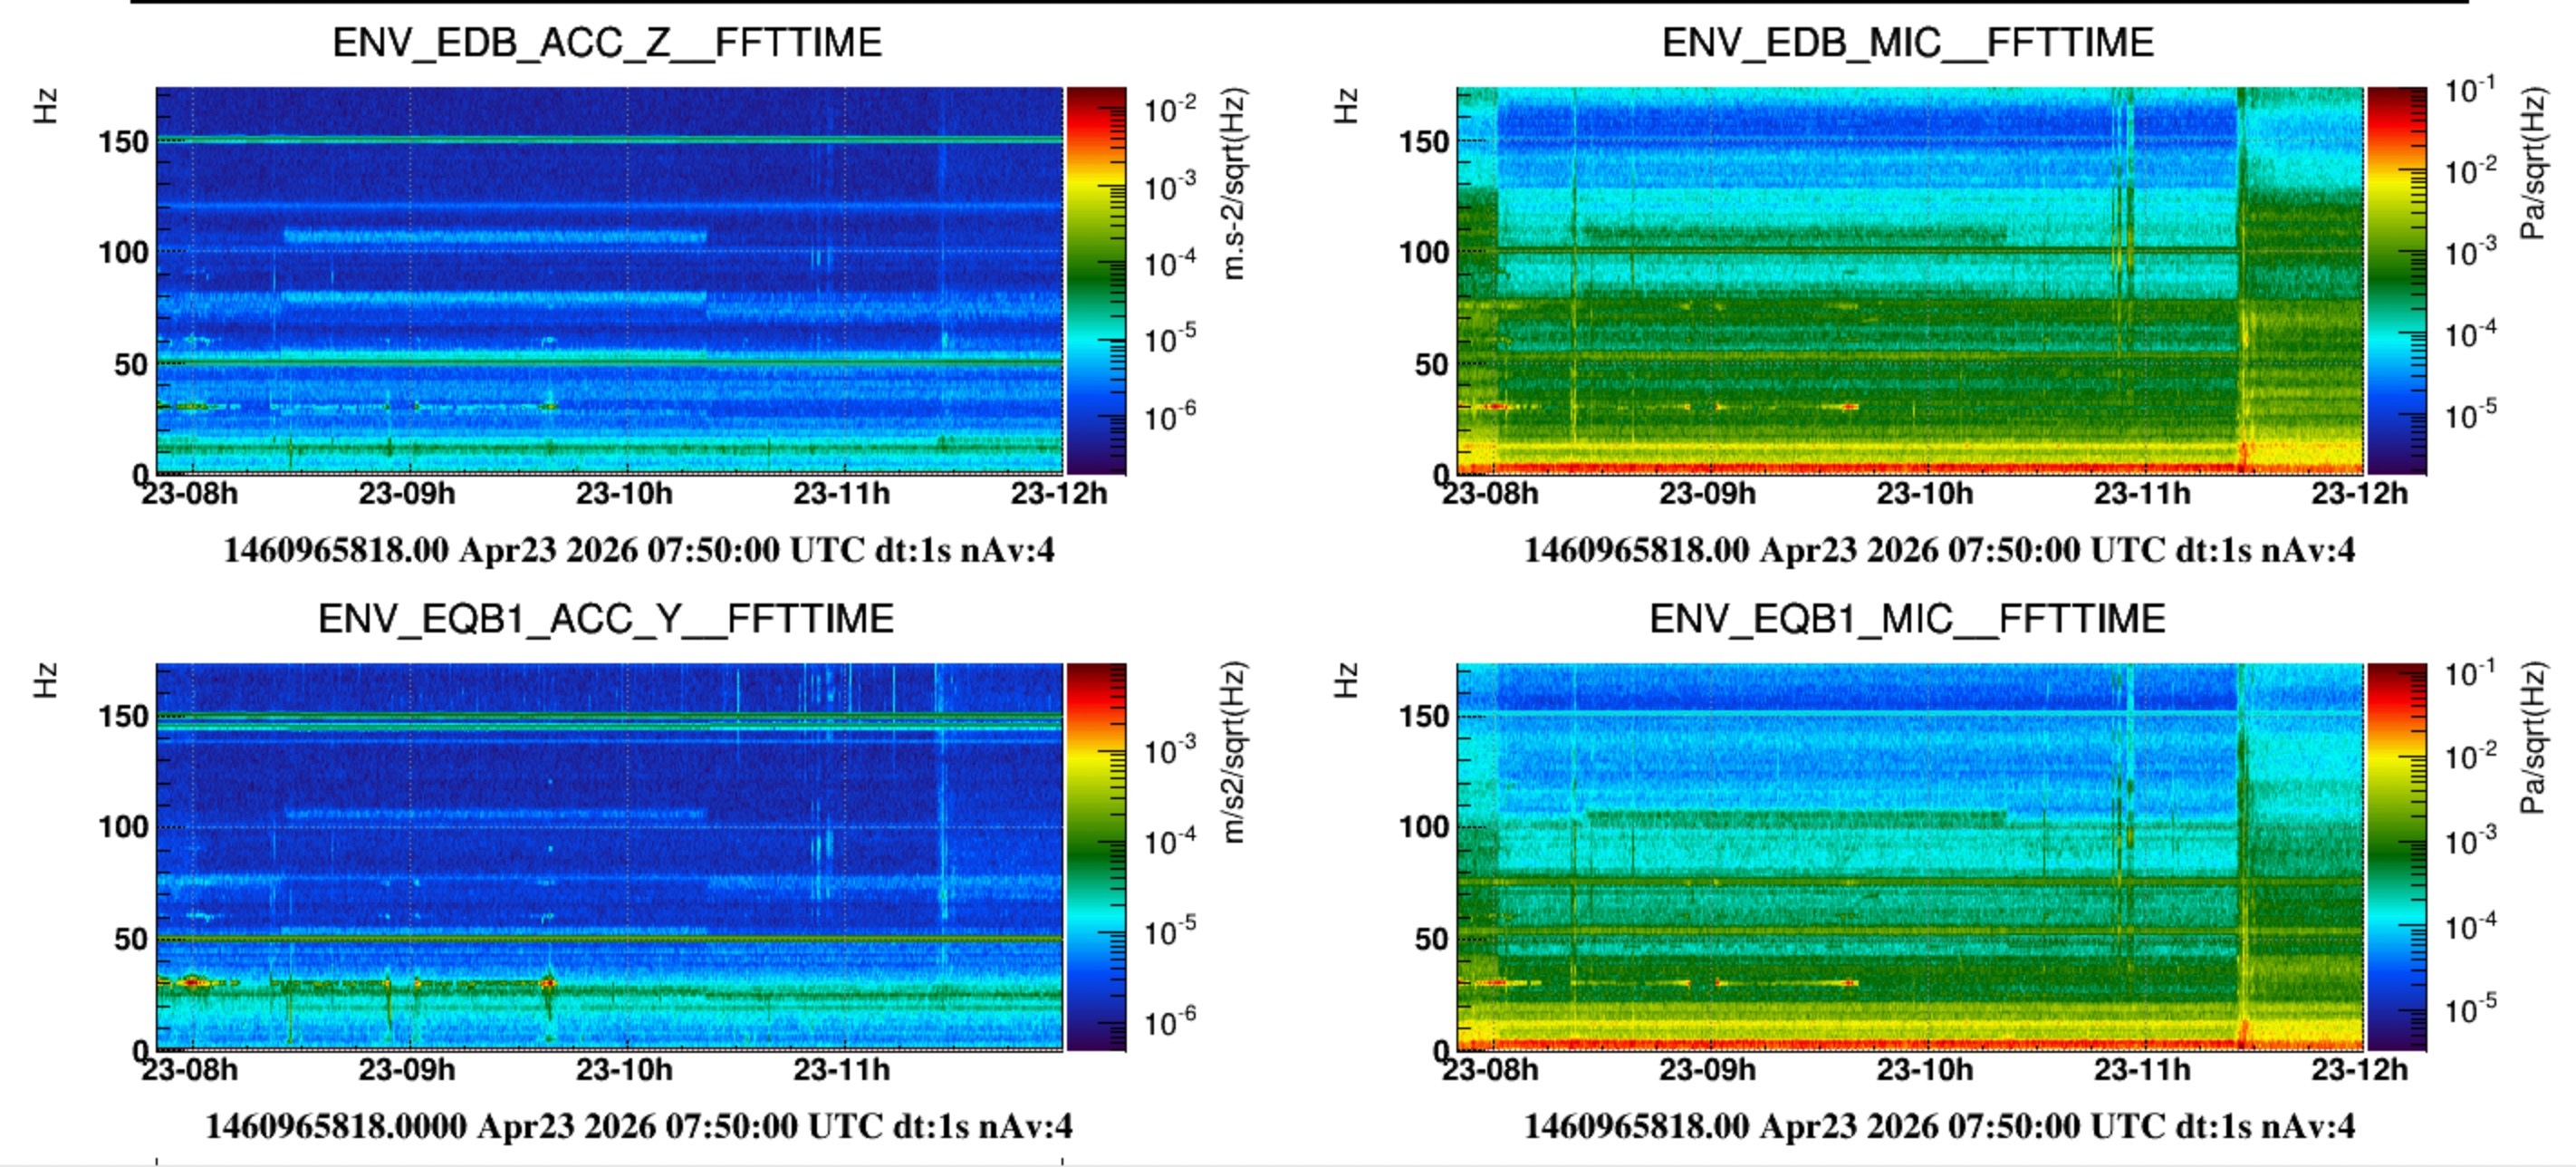
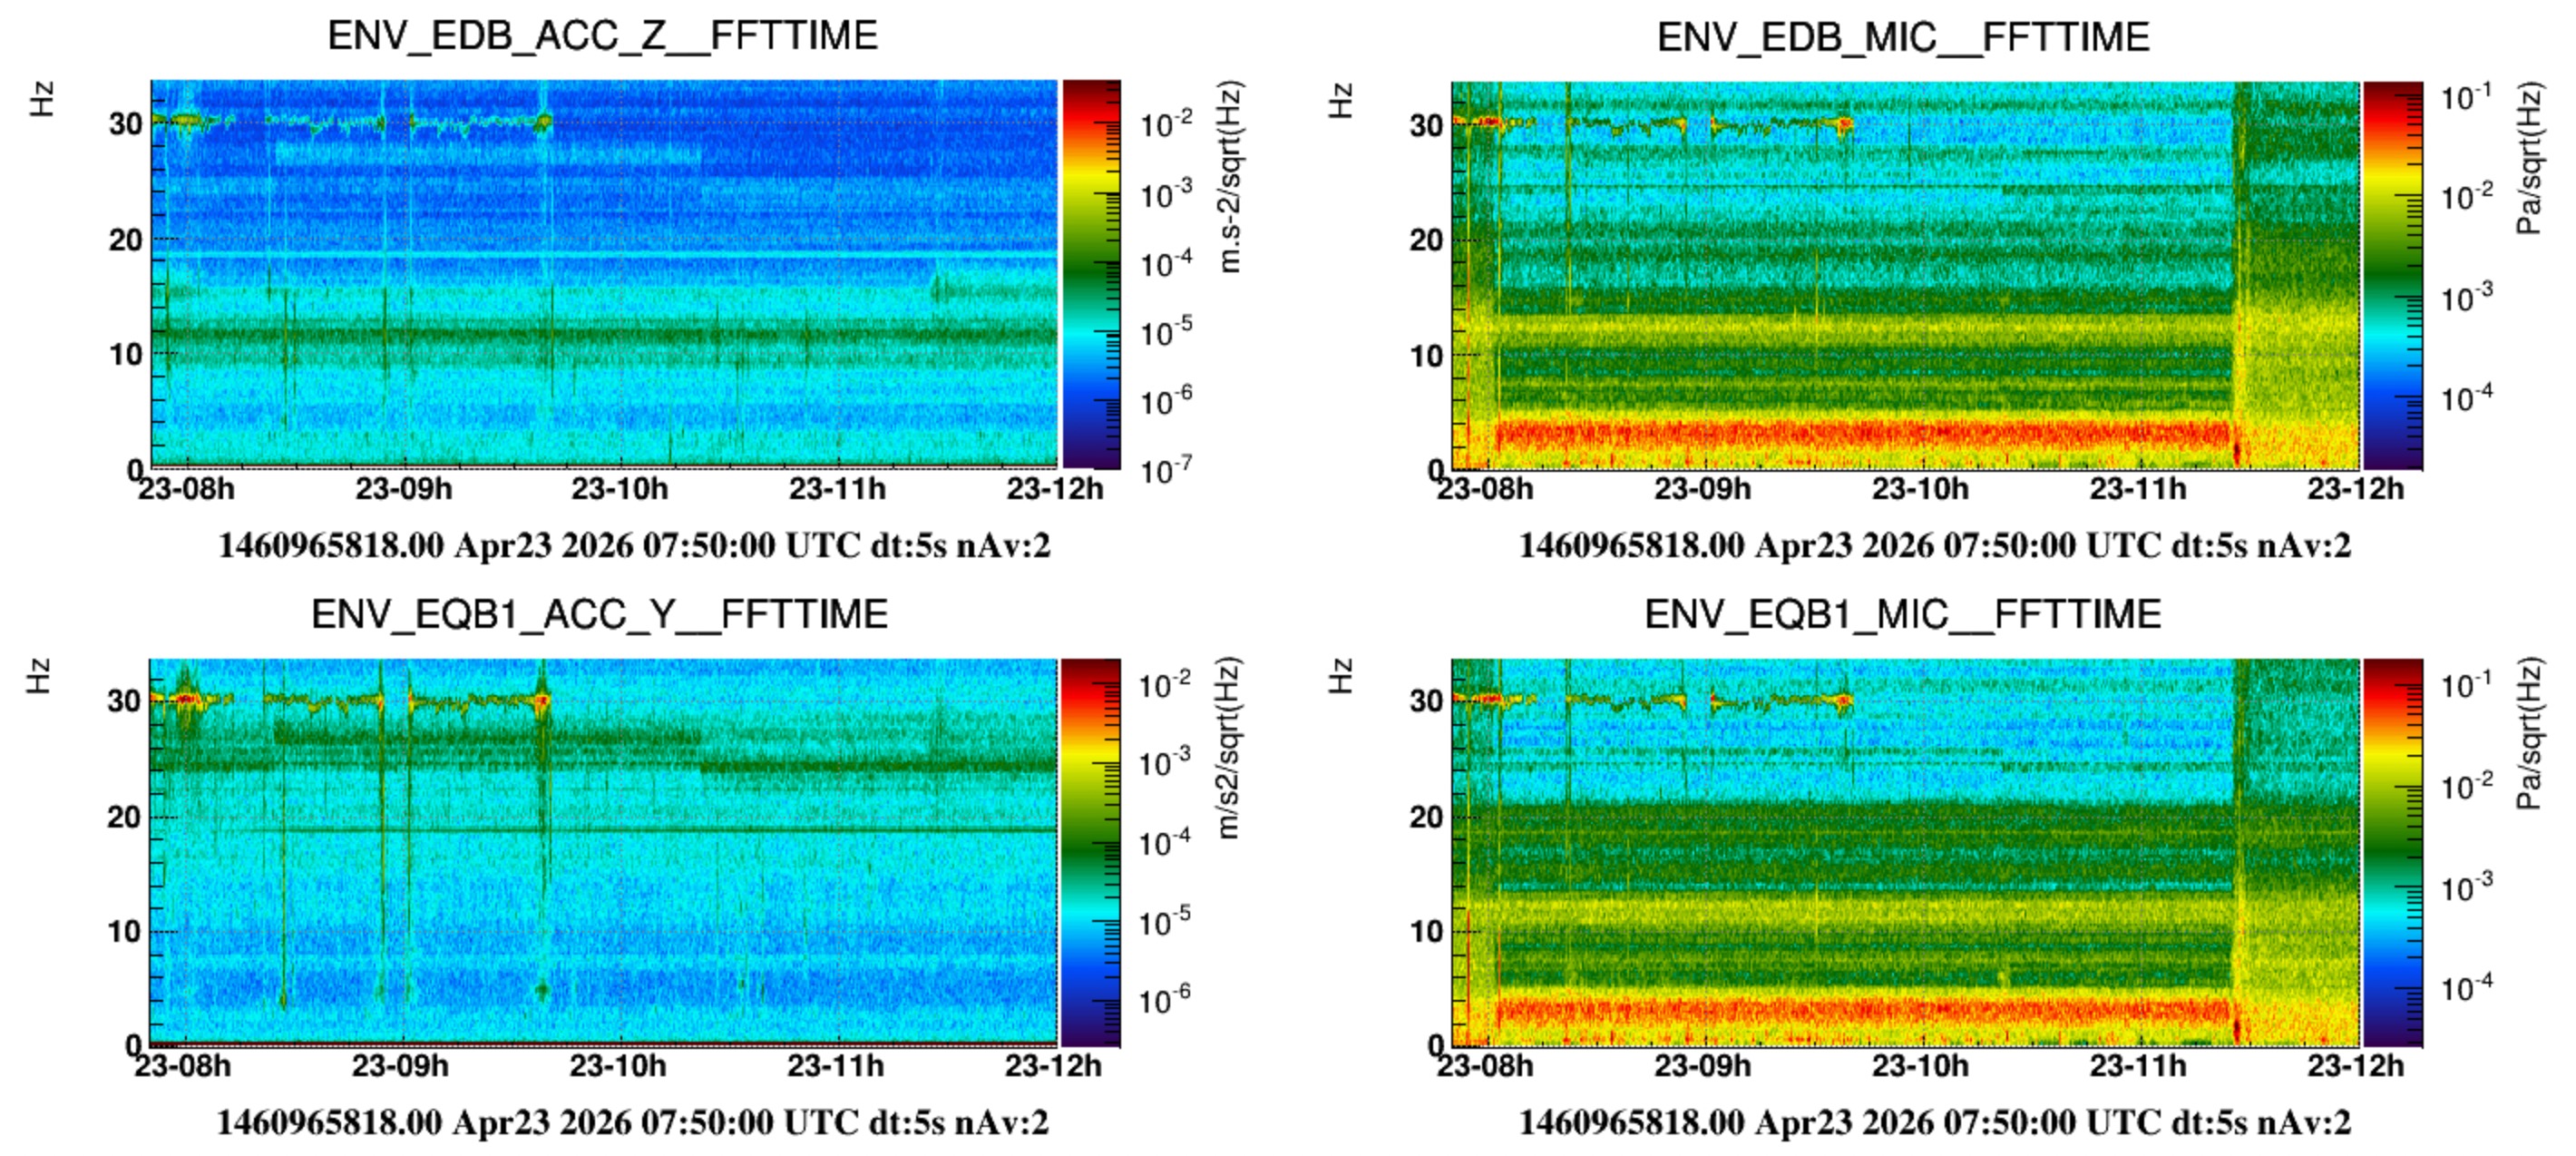
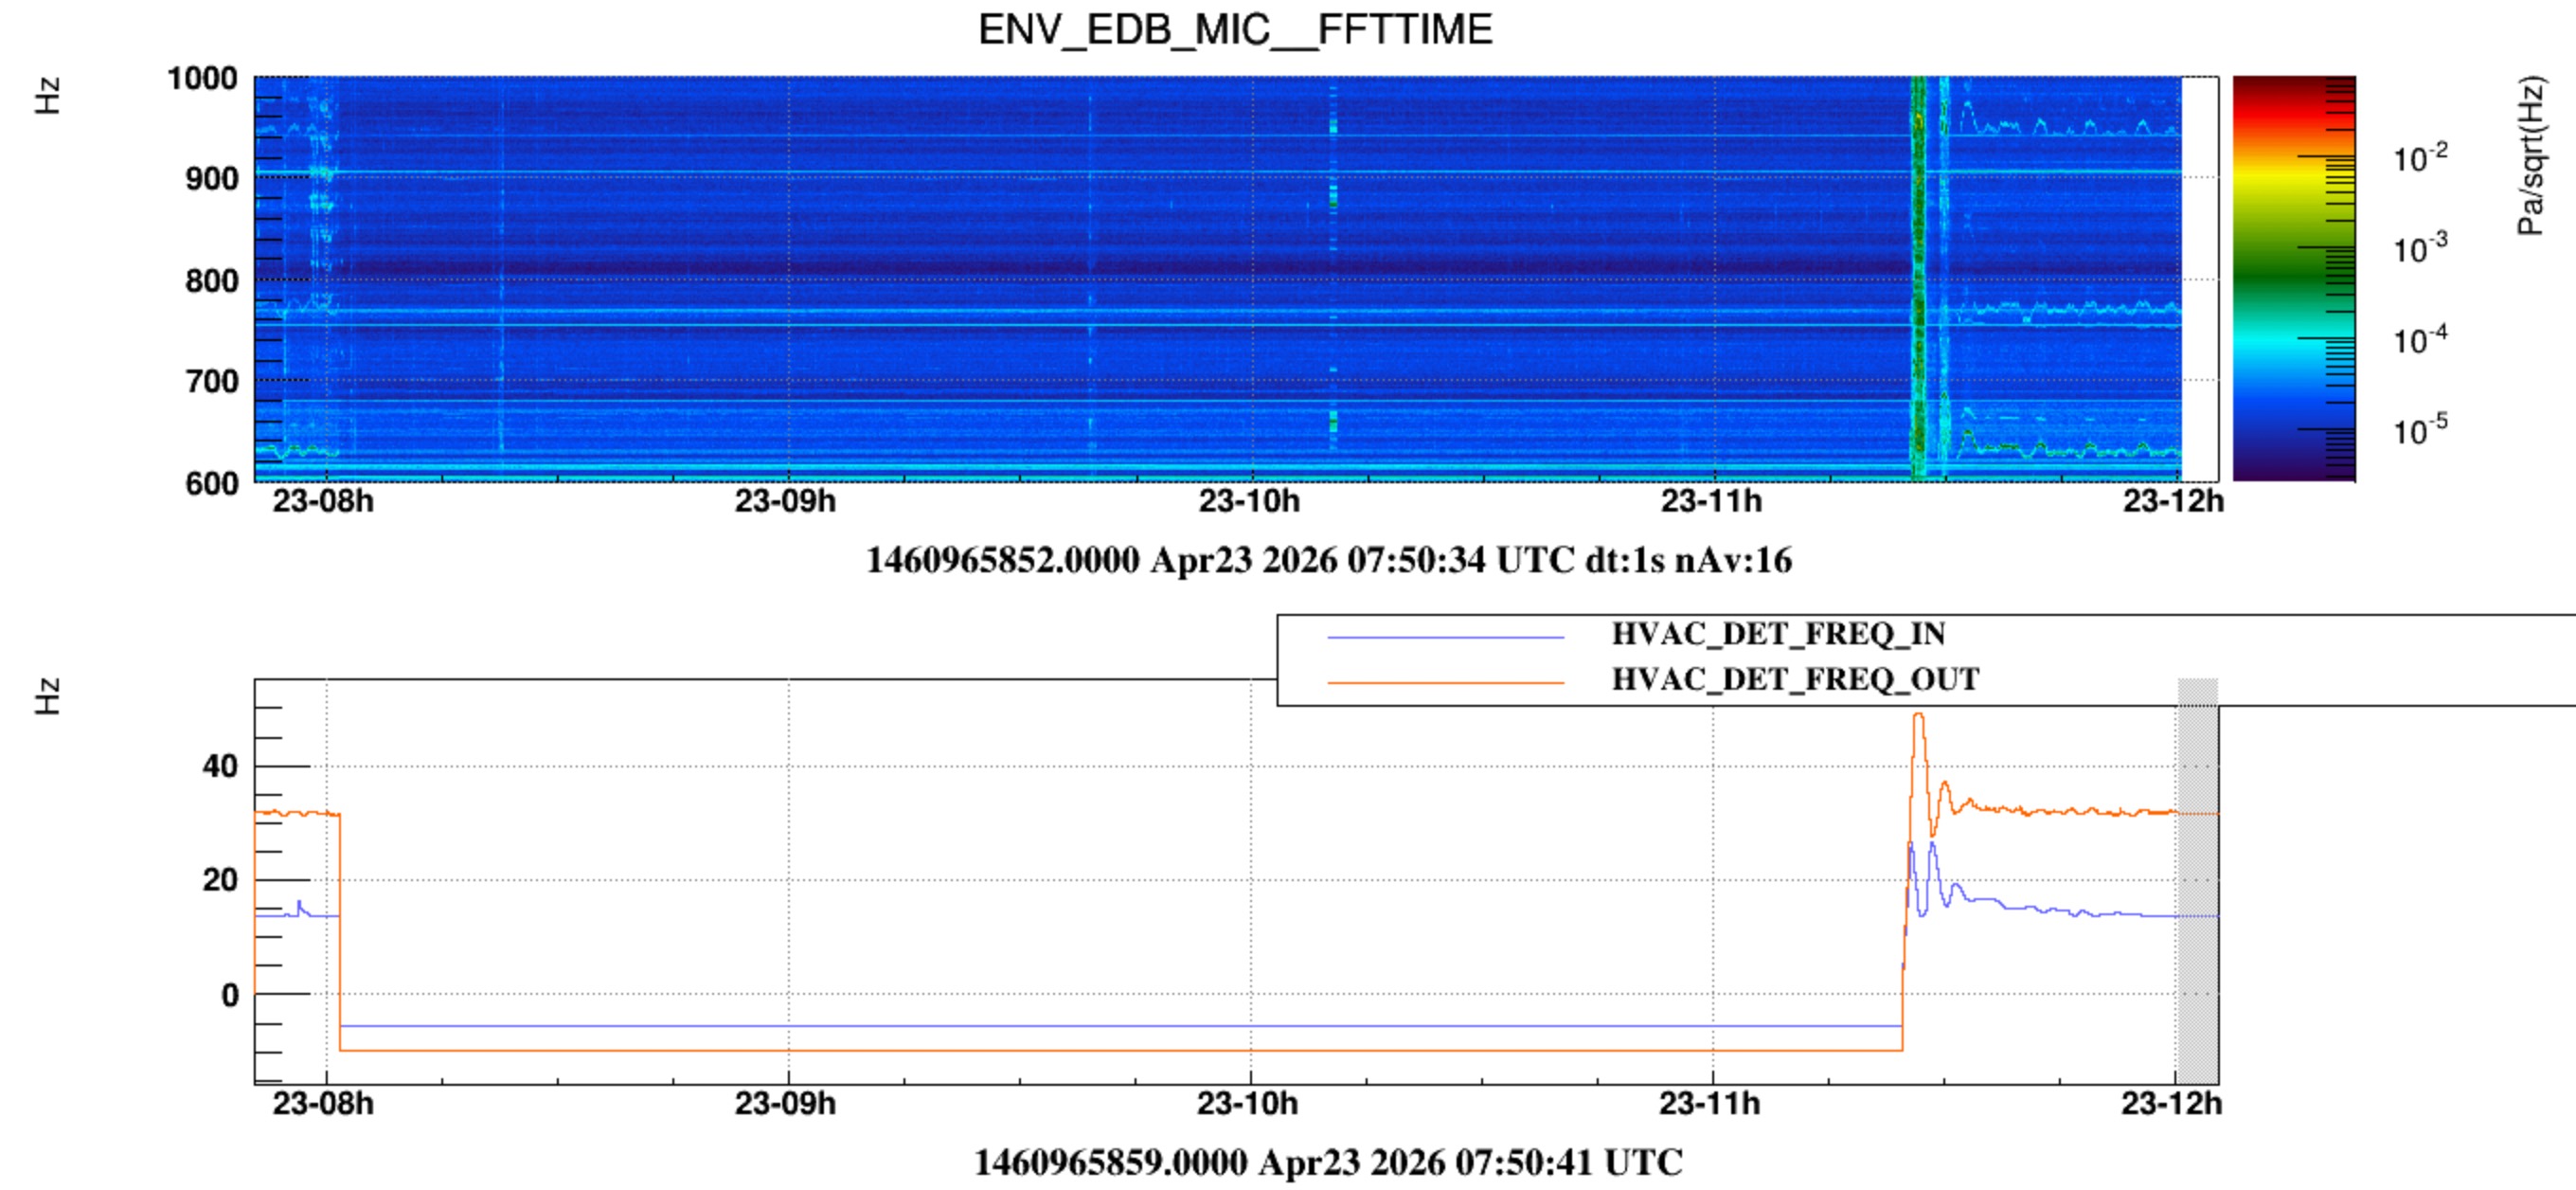
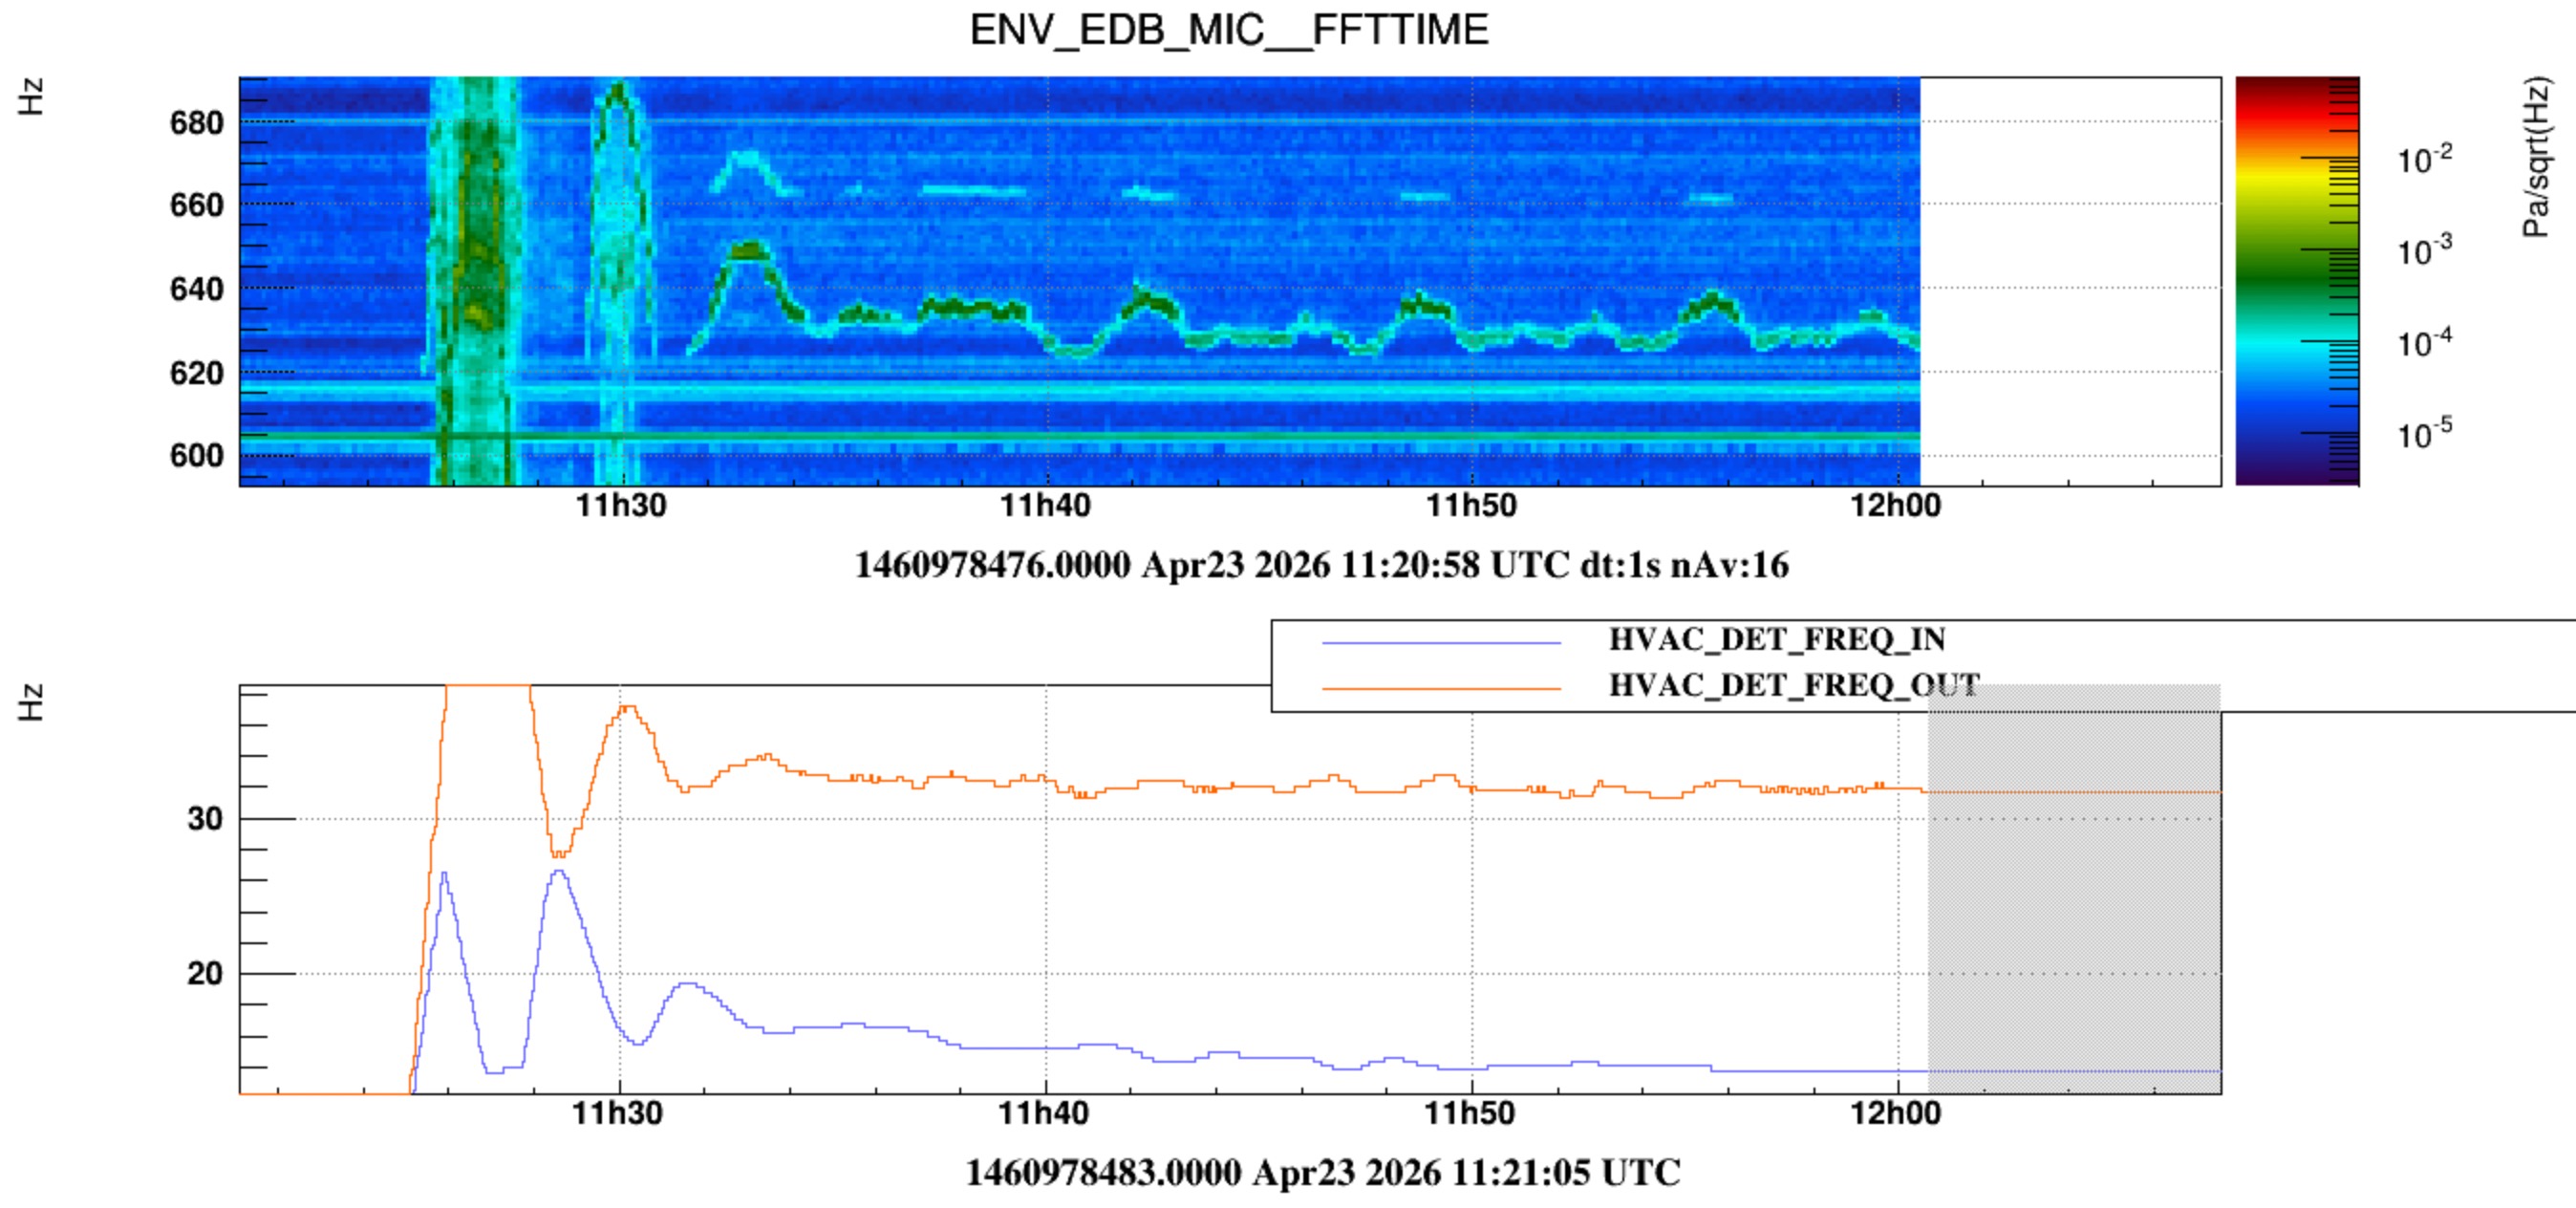
Figure 1 shows the acoustic noise (ENV_EDB_MIC) inside the DET Lab during the test. Analysis will follow.

The valve opening values in automatic mode returned approximately to their initial settings, except for the New SAS area, which shows 0% on the interface (Davide Soldani has been informed)


Images attached to this report
Non-image files attached to this report
Comments to this report:
Tringali, Fiori, Soldani - 19:25 Thursday 23 April 2026 (69028) Print this report

***** Acoustic noise in the DET Lab at different supply and return fan speeds *****

The scope of the test was to evaluate the acoustic noise at different supply and return fan operating speeds, determine the configuration corresponding to the minimum noise level, and monitor the system parameters during overnight operation.

The morning session was dedicated to preliminary investigations. The HVAC system was progressively shut down, including switching off the supply and return fans, isolating the water distribution (valves located in the CEB hall AHU room), and closing all supply, return, and outdoor air valves.
Tapping tests were also performed on the sections of the supply (bottom) and return (top) air ducts entering the interspace where the inverters are located.

The system was restored to its initial configuration before the fan speed tests.

During the afternoon session, supply and return fan speeds were tested by keeping one fan fixed at a given speed while varying the other; the fixed speeds were 24 Hz for the supply fan and 13.8 Hz for the return fan.

*** The supply and return fans were left at 27.5 Hz and 13.8 Hz, respectively, as a potentially low-noise configuration, to monitor acoustic noise and environmental parameters overnight. ***

Detailed actions are reported in the attached file.  A dedicated analysis will follow.

Non-image files attached to this comment
Tringali, Fiori - 18:43 Saturday 25 April 2026 (69034) Print this report

Comments on the test of the DET AHU supply and return fan speeds.

Figure 1 and Figure 2. Spectrograms of the microphone in DET lab (*EDB_MIC*) during the main actions carried out in the morning and afternoon, respectively.

Figure 3. The plots show the environmental parameters in the DET lab during the fan speed test and over the following period, with the selected fans configuration (supply @27.5 Hz, return @13.8 Hz) kept overnight. Temperature, relative humidity, and pressure signals do not show significant fluctuations, indicating that the chosen configuration provides stable environmental conditions.

Figure 4. Increasing the supply fan speed results in a clear increase in acoustic noise, as observed in the RMS levels across different frequency bands (less clear in the 1–16 Hz band). When varying the return fan speed, the effect on acoustic noise is generally weaker. However, an increase in the RMS level in the 16–512 Hz band can be observed at higher return fan speeds.

Figure 5, 6, 7.  With the return fan fixed at 13.8 Hz, reducing the supply fan speed down to ~22.7 Hz leads to acoustic noise levels that, up to a few hundred Hz, approach those measured with the system switched off (dashed black curve). When varying the return fan speed while keeping the supply fan fixed at a lower value than the reference (red curve, supply@31.8 Hz, return @13.8 Hz), a slight reduction in acoustic noise can also be achieved.

Figure 8. Reduction factor of the acoustic noise with respect to the reference configuration (supply @31.8Hz, return @13.8 Hz) during the test.

Figure 9. The figure shows a comparison of the acoustic noise inside the DET Lab during the last site-wide HVAC system switch-off (elog 68269). Switching off the DET AHUs (blue curve) reduces the acoustic noise inside the lab. A further reduction is achieved when the supply and return AHUs of the CEB hall are also switched off (green curve).


The table reports the air velocity and airflow values measured during the test.

Reuturn fan frequency (Hz)

Supply fan frequency (Hz) Supply air speed (m/s) Supply air flux (m3/h) Return air speed (m/s) Return air flux (m3/h)
13.8 (fixed) 12.11 1.03 1298 0.1 126
" 15.8 1.49 1877 0.15 189
" 22.7 2.72 3427 0.33 416
" 29.5 3.4 4284 0.99 1247
" 36.7 4.3 5418 2.1 2646
" 46.7 4.8 6048 2.27 2860
18.2 24 (fixed) 2.8 3528 0.26 328
26.1 " 2.85 3591 1.10 1386
13.8** 27.5** 2.9 3654 0.3 378

** Configuration left overnight and during the weekend

Duct area = (100 × 35) cm² = 0.35 m²
Airflow = duct area × air velocity × 3600


Images attached to this comment
Tringali, Fiori - 17:30 Tuesday 28 April 2026 (69048) Print this report

In the table below are reported the latest actions performed on the supply and return fan operation.

Time  Mode Supply fan frequency Return fan frequency Note
April 27, 12:30 UTC Automatic ~32 Hz ~13.8 Hz Supply: air speed ~2.6m/s → Air flux~3276 m³/h
Return: air speed ~0.2 m/s → Air flux~252 m³/h
April 27, 16:10 UTC Manual ~28.5 Hz ~13.8 Hz Supply: air speed ~2.5m/s → Air flux~3150 m³/h
Return: air speed ~0.3 m/s → Air flux~378 m³/h
April 28, 09:40 UTC Automatic ~32.8 Hz ~13.8 Hz  
April 28, 15:00 UTC Manual ~28.5 Hz ~13.8 Hz  

In Figure 1, a slight temperature drift of approximately 0.1–0.2 °C is observed over time, together with oscillatory behavior in the humidity control loop.

Images attached to this comment
Tringali, Fiori - 17:32 Wednesday 29 April 2026 (69051) Print this report

*** Erratum ***

Due to an offset between the Kieback & Peter interface and the inverter, the supply and return fan speeds reported were incorrect.
The values in the table below have been updated, and an additional frequency step has been added.


Time  Mode Supply fan frequency Return fan frequency Note
April 27, 12:30 UTC Automatic ~32 Hz ~13.8 Hz Supply: air speed ~2.6m/s → Air flux~3276 m³/h
Return: air speed ~0.2 m/s → Air flux~252 m³/h
April 27, 16:10 UTC Manual ~22 Hz ~15.7 Hz Supply: air speed ~2.5m/s → Air flux~3150 m³/h
Return: air speed ~0.3 m/s → Air flux~378 m³/h
April 28, 09:40 UTC Automatic ~32.8 Hz ~13.8 Hz  
April 28, 15:00 UTC Manual ~22 Hz ~15.7 Hz  
April 29, 10:36 UTC Manual  ~28.5 Hz ~13.8 Hz Supply: air speed ~3m/s → Air flux~3780 m³/h
Return: air speed ~0.3 m/s → Air flux~378 m³/h
fiori - 16:38 Thursday 30 April 2026 (69057) Print this report

Since yesterday 12:00 LT (April 29) the DET AHU is running in MANUAL mode (fixed fan frequencies) at slightly reduced rate of the SUPPLY fan (28.5 Hz instead of usual 31.5). Ambient parameters (TE, HU, PRES) look stable enough (see attached) so we decide to keep it in this configuration untill Monday.

Images attached to this comment
fiori, tringali - 17:44 Thursday 30 April 2026 (69058) Print this report

A few more observations concerning the test of April 23:

  • at some point, while the AHU was off, we stopped the water flux by closing the valves located inside the CEB AHU room. Unespectly we measured an increased acoustic noise in the range 50 to 100 Hz (Figure 1)
  • between 8:49 and 11:13 UTC, while the AHU was off, we closed all air valves of ducts (all set to 0%). In principle we would expect some change in the position of low frequency spectral peaks, if they were associated to acoustic modes of the air ducts. We did not notice any change (Figure 2).
  • acoustic spectrograms show some peaks changing frequency, mostly above a few hundred Hz. They seem correlated to the frequency of the SUPPLY fan (Figures 3 and 4). Yet, we then notice that similar ones are present also when the HVAC was running in MANUAL modes (that is when both fans frequency fixed): Figure 5. Could they be associated to the air flow regulators instead?
Images attached to this comment
Search Help
×

Warning

Error

The present report has been modified outside this window. Please check for its integrity in the main page.

Refreshing this page will move this report into drafts.

×