Reports 1-1 of 1 Clear search Modify search
Virgo Runs (C11)
fiori, paoletti - 14:55 Monday 15 October 2018 (43071) Print this report
DARM peaks zoology

A collection of spectrograms of DARM over C11: with jumping peaks (435 Hz) drifting peaks (462 Hz) breathing peaks (182, 320, 10-19-26Hz) on-off lines (111.11, 166.66, 222.22, 277.77, 333.33Hz) sidebands of mains harmonics (200Hz, 350Hz, ...)

Some of these are old friends from O2, like the jumping peak (it was at a a slightly different frequency at that time, around 442Hz, now around 435Hz) or the comb of on/off lines (which are spaced by 55.5555555 Hz !!)

The usual peaks at 101Hz (now smaller than before) and 157Hz (thought to be SIB2 modes) show common enhancements at the beginning of some locks, like those of October 14  (around 13UTC and around 17 UTC).

Food for thoughts....

Images attached to this report
Comments to this report:
Paoletti, Fiori - 16:32 Monday 15 October 2018 (43078) Print this report
Images attached to this comment
Paoletti - 11:59 Wednesday 17 October 2018 (43121) Print this report
Images attached to this comment
mwas, flaminio - 12:24 Wednesday 17 October 2018 (43124) Print this report
fiori - 15:25 Wednesday 17 October 2018 (43132) Print this report

Some further hints on the 55.5periodic comb:

  • guided by the fact that Bruco finds a small coherence at these lines with SDB1_LC* ... I found that indeed these lines are present in the SDB1_LC* signal: Figure 1
  • these lines seems modulated by ASC_DIFFp_TY that basically is equal (why so?) to SDB1_B1s1_56MHz_I, there is very nice correspondence between the peaks: Figure 2. And these are the same modulation observed at the 50Hz harmonics

hunting seems to narrow down ...

Images attached to this comment
mwas - 22:32 Wednesday 17 October 2018 (43138) Print this report
The ~277Hz line on SDB1 LC TY comes from the B5 QD2 quadrant on SDB1 (figure 1). As the local control signals are not used to control the SDB1 bench just the quadrant.
What is surprising is that this line is not visible on SDB1 B5 QD1 (figure 2), so it is unlikely (but not impossible) that it is a beam jitter.
Note that the line is extremely narrow (less than 1mHz), so it must be produced by a digital system synchronized on the GPS.
Another option is that SDB1 B5 QD2 signal is picking some electromagnetic cross talk from somewhere else (it is visible in both the vertical and the horizontal signal, figure 3). The question then is what is causing this interfering signal (something close to the electronic rack on the mezannine next to the detection tower?), and how does it couple to the interferometer.
Images attached to this comment
mwas - 10:09 Thursday 18 October 2018 (43144) Print this report
direnzo, cella - 20:35 Sunday 21 October 2018 (43196) Print this report

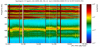
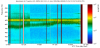
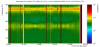
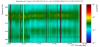
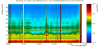
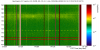
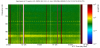
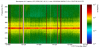
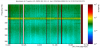
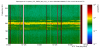
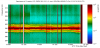
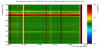
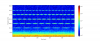
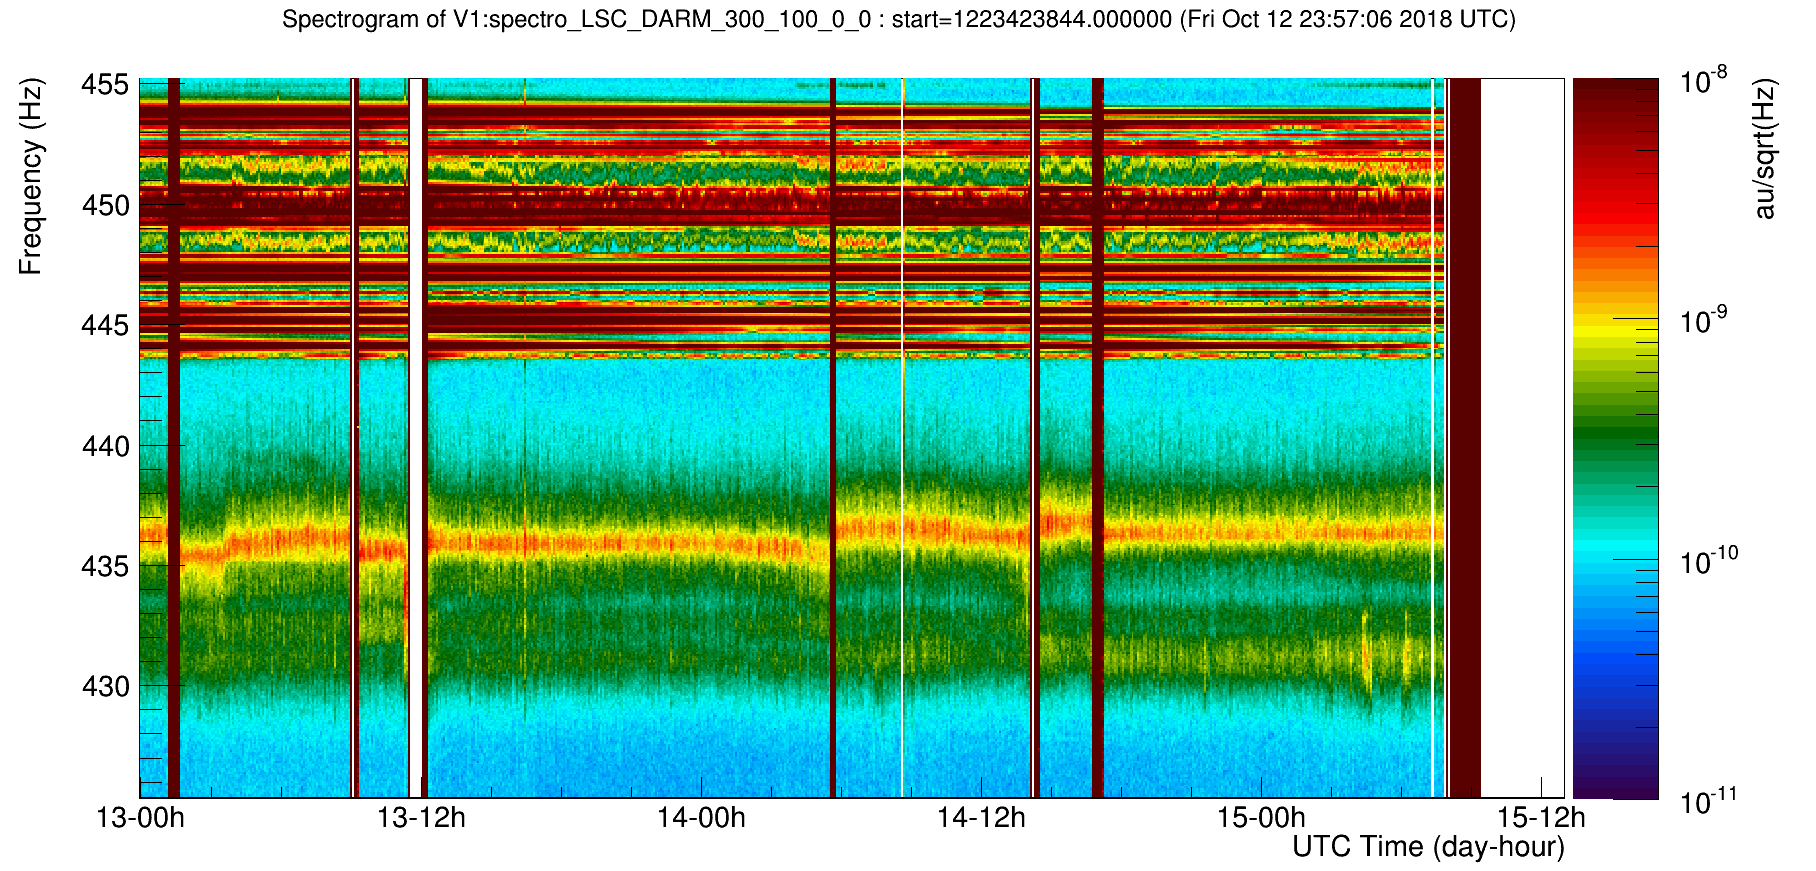
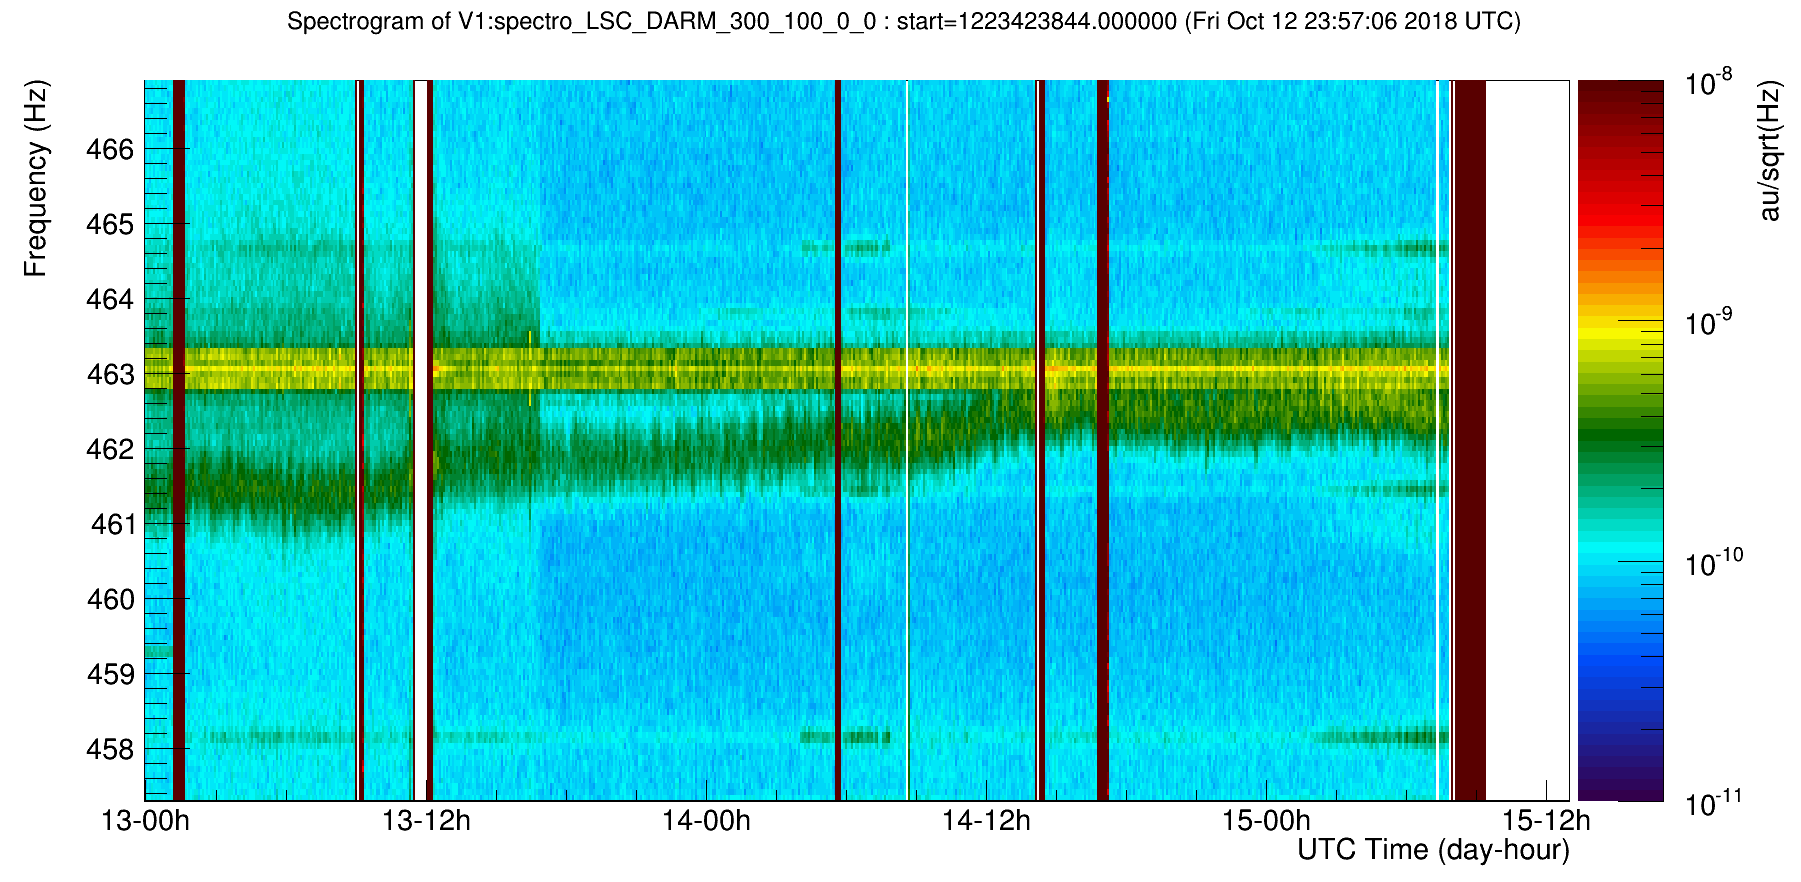
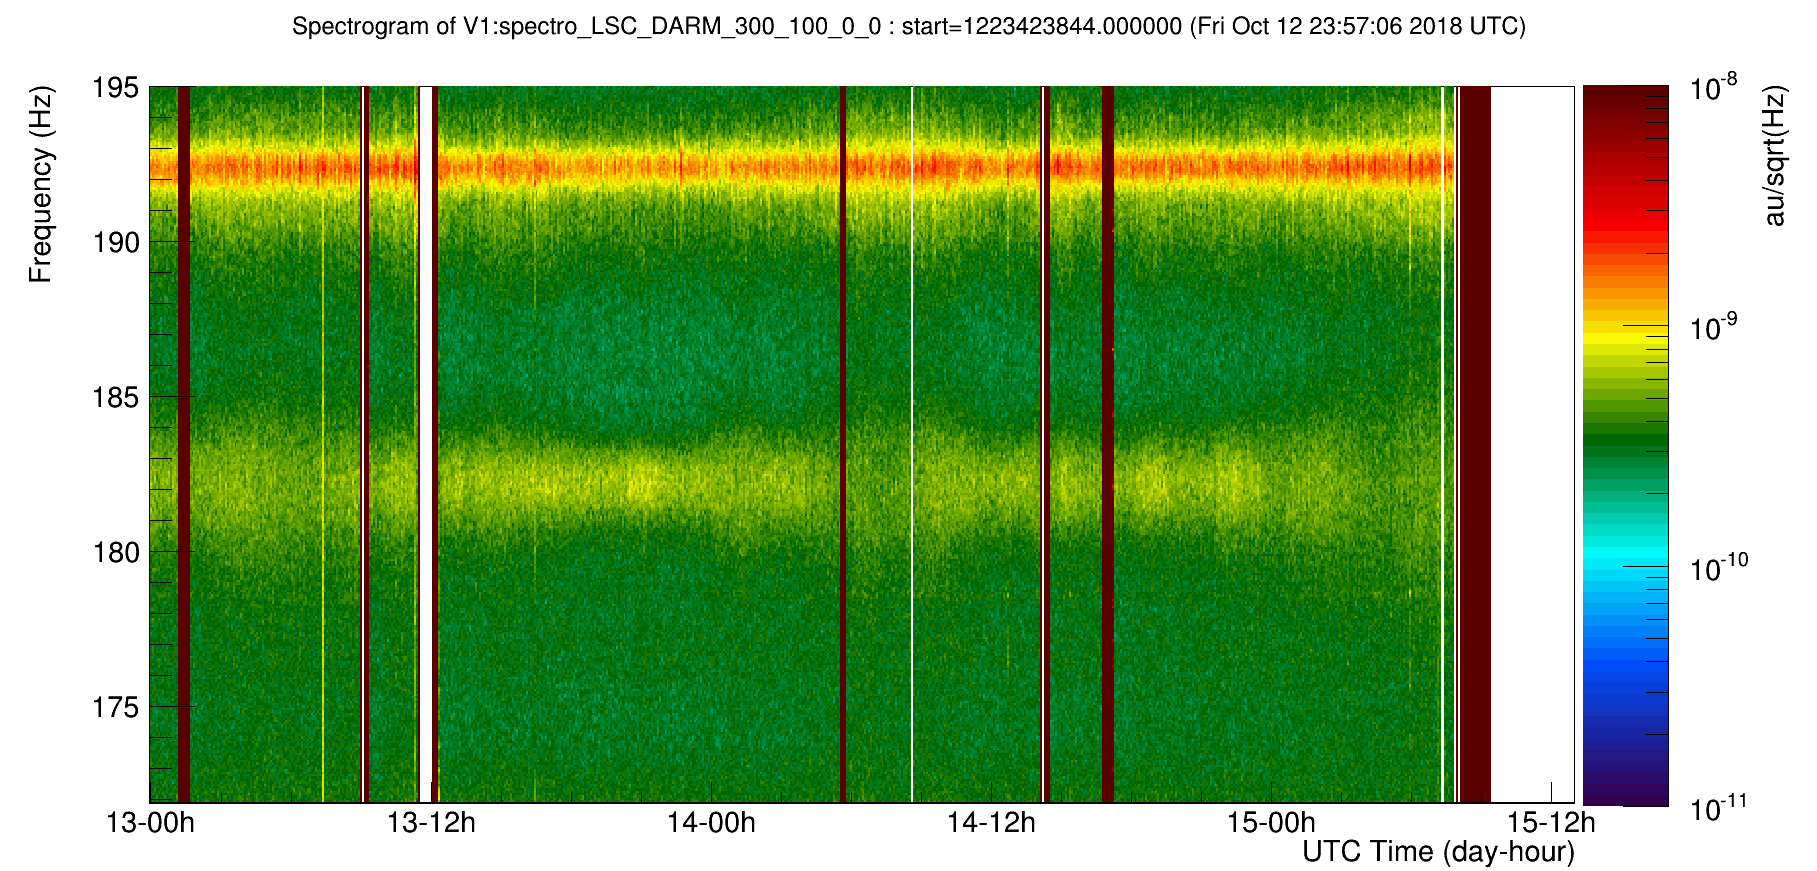
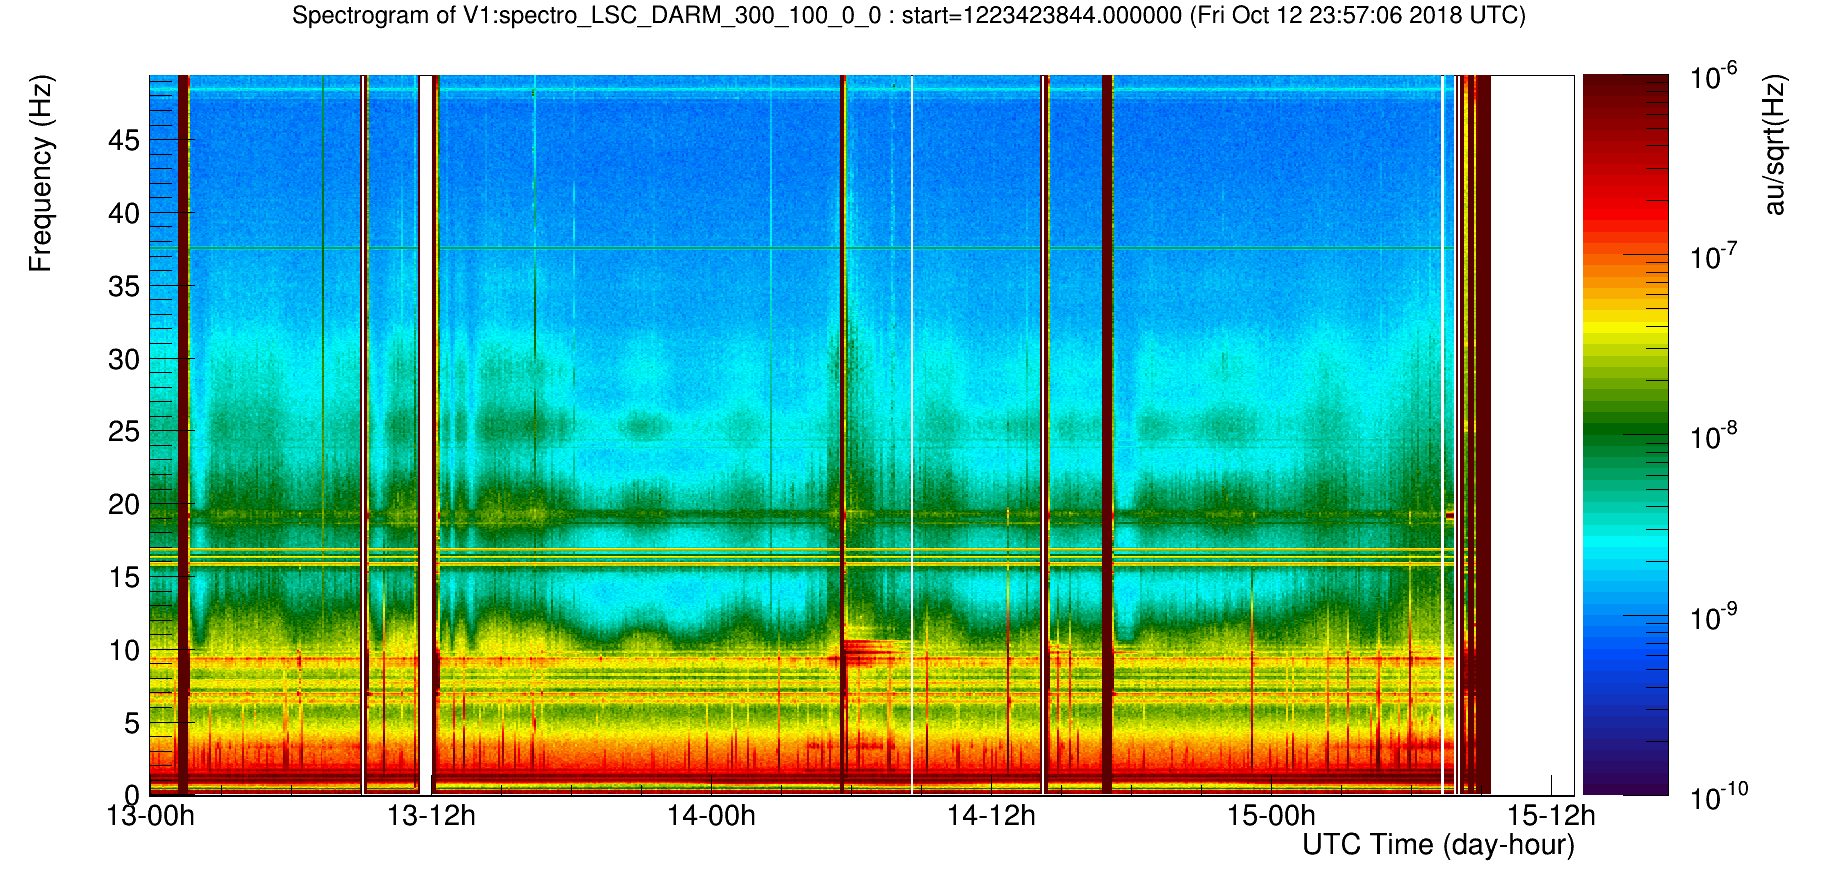
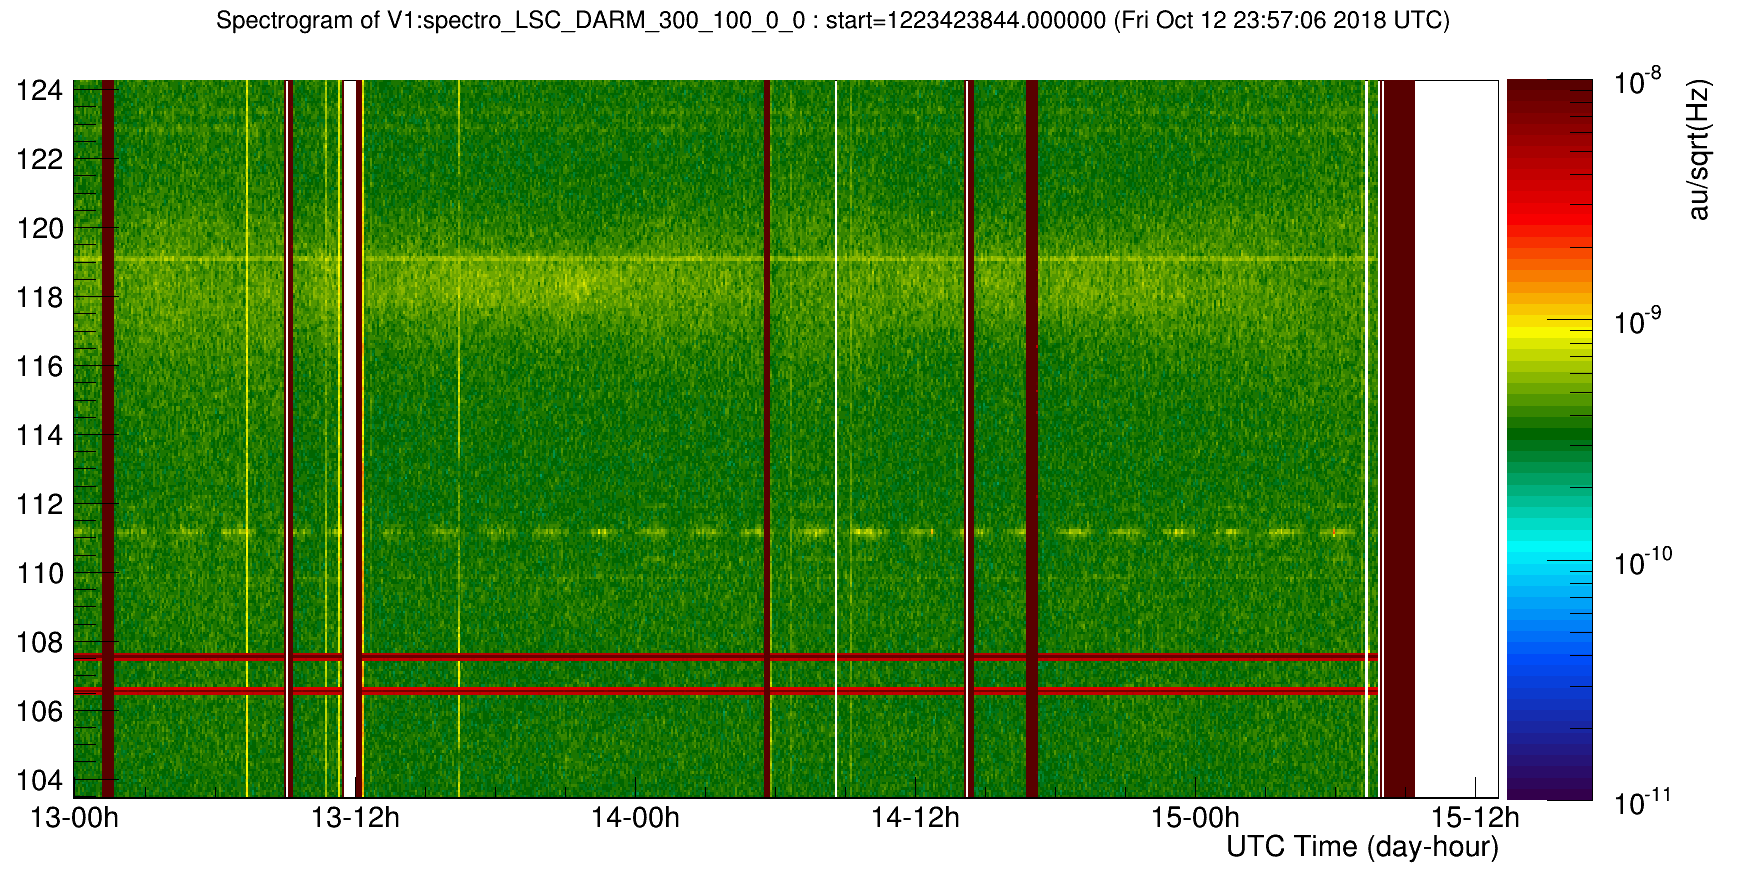
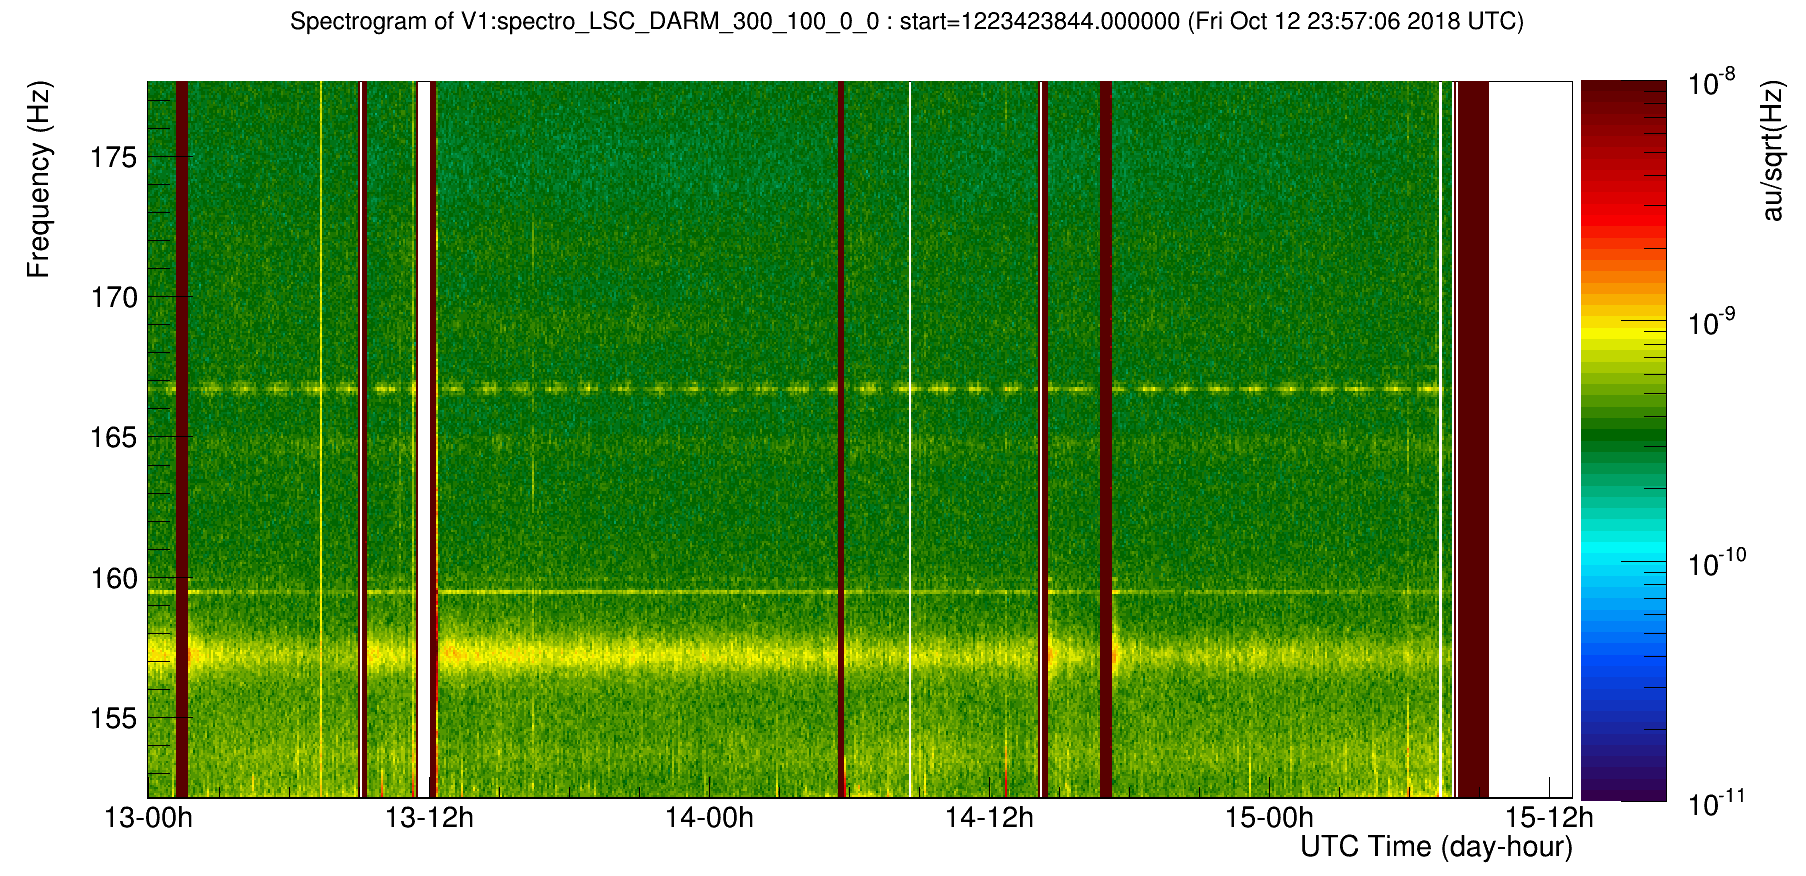
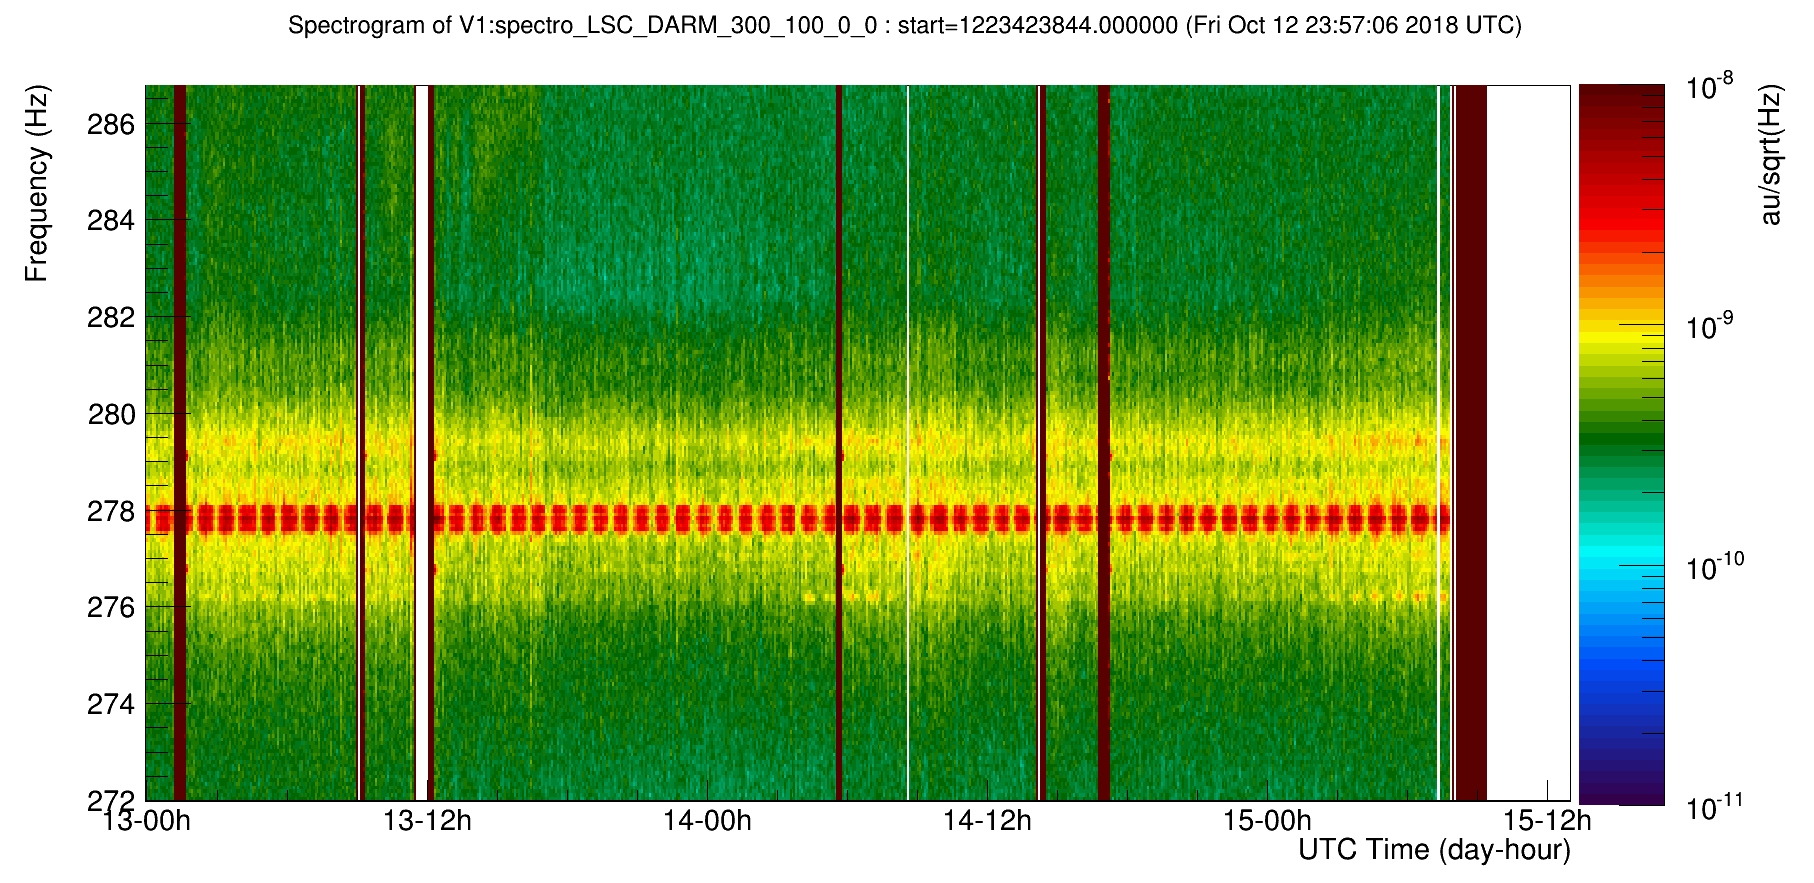
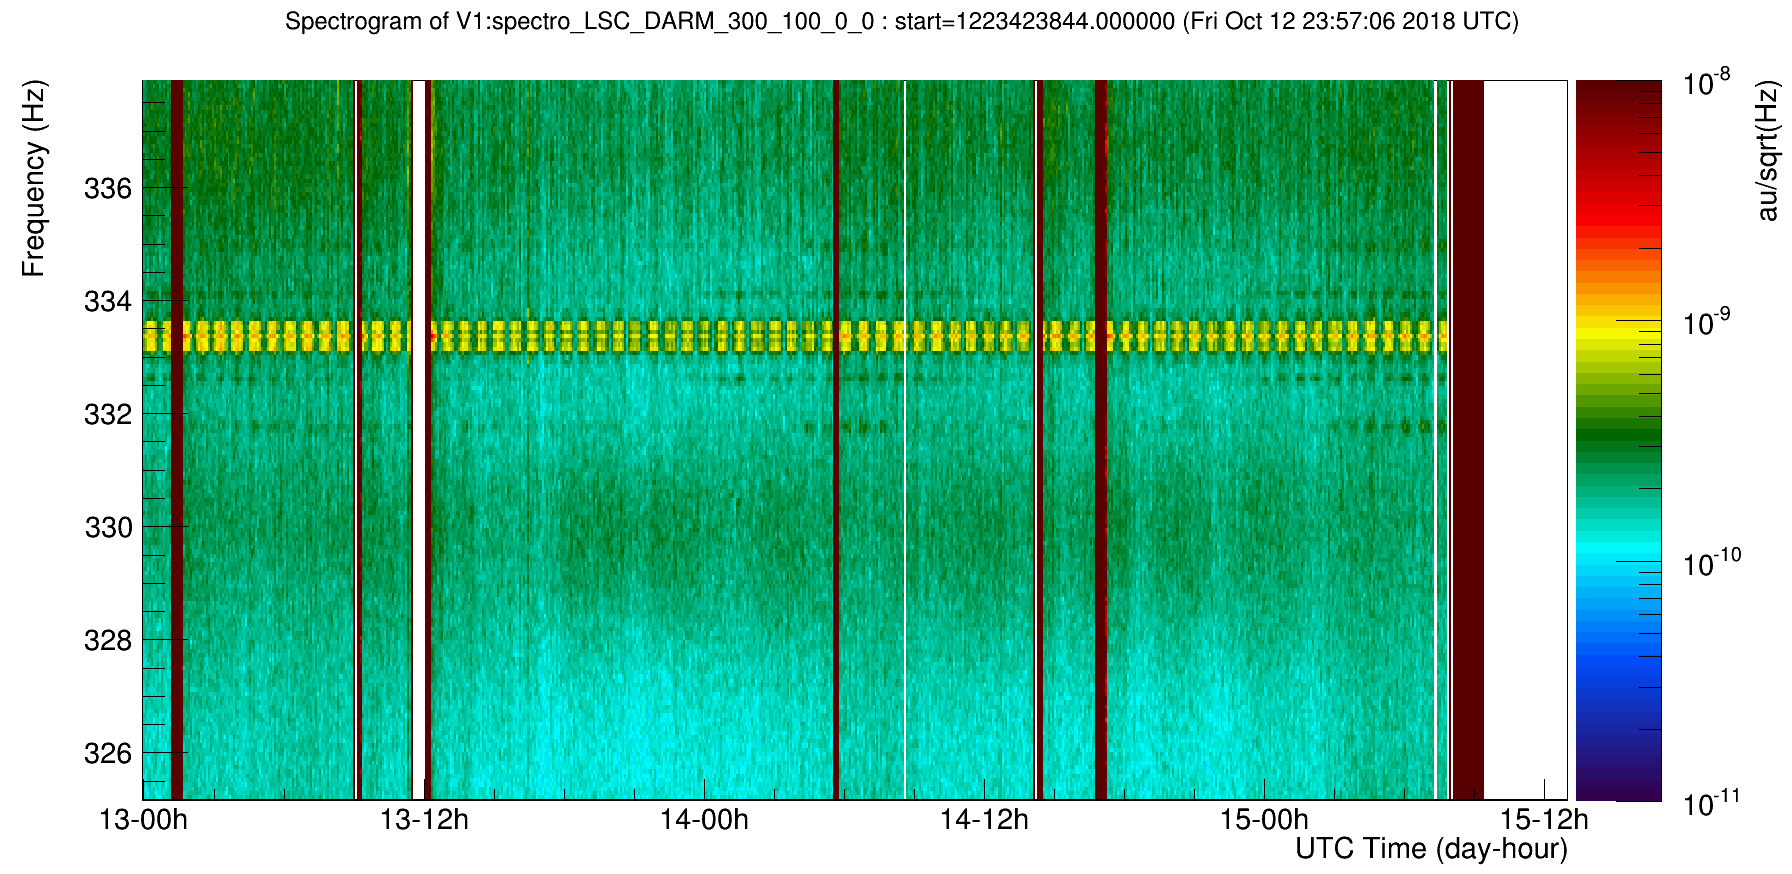
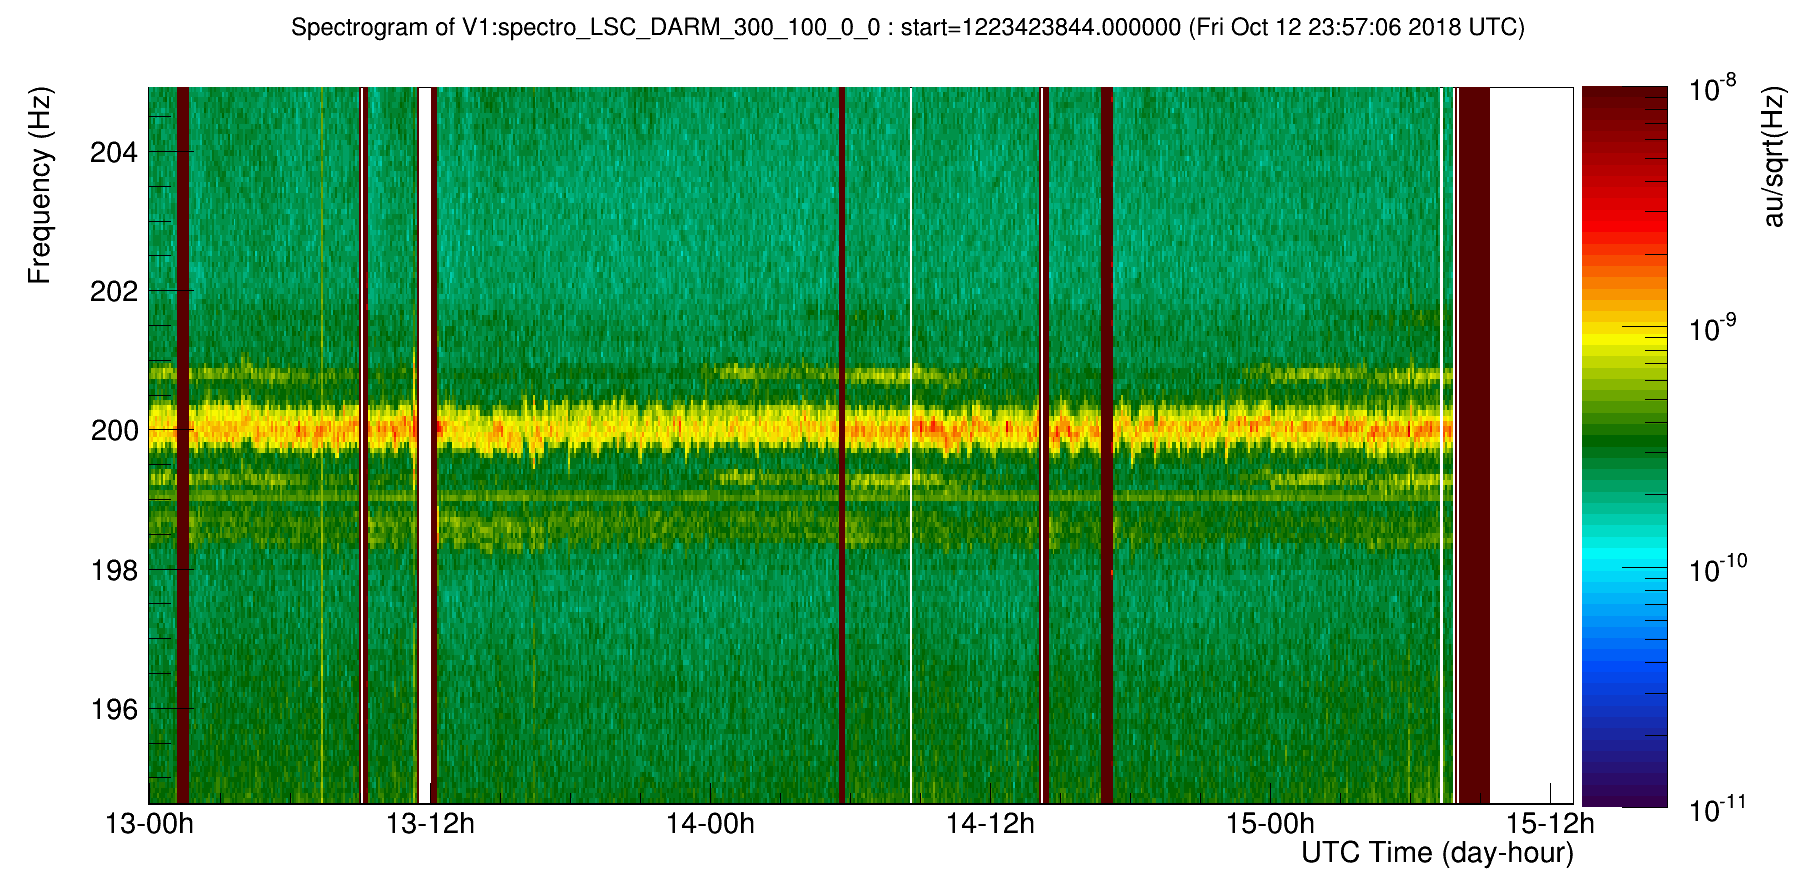
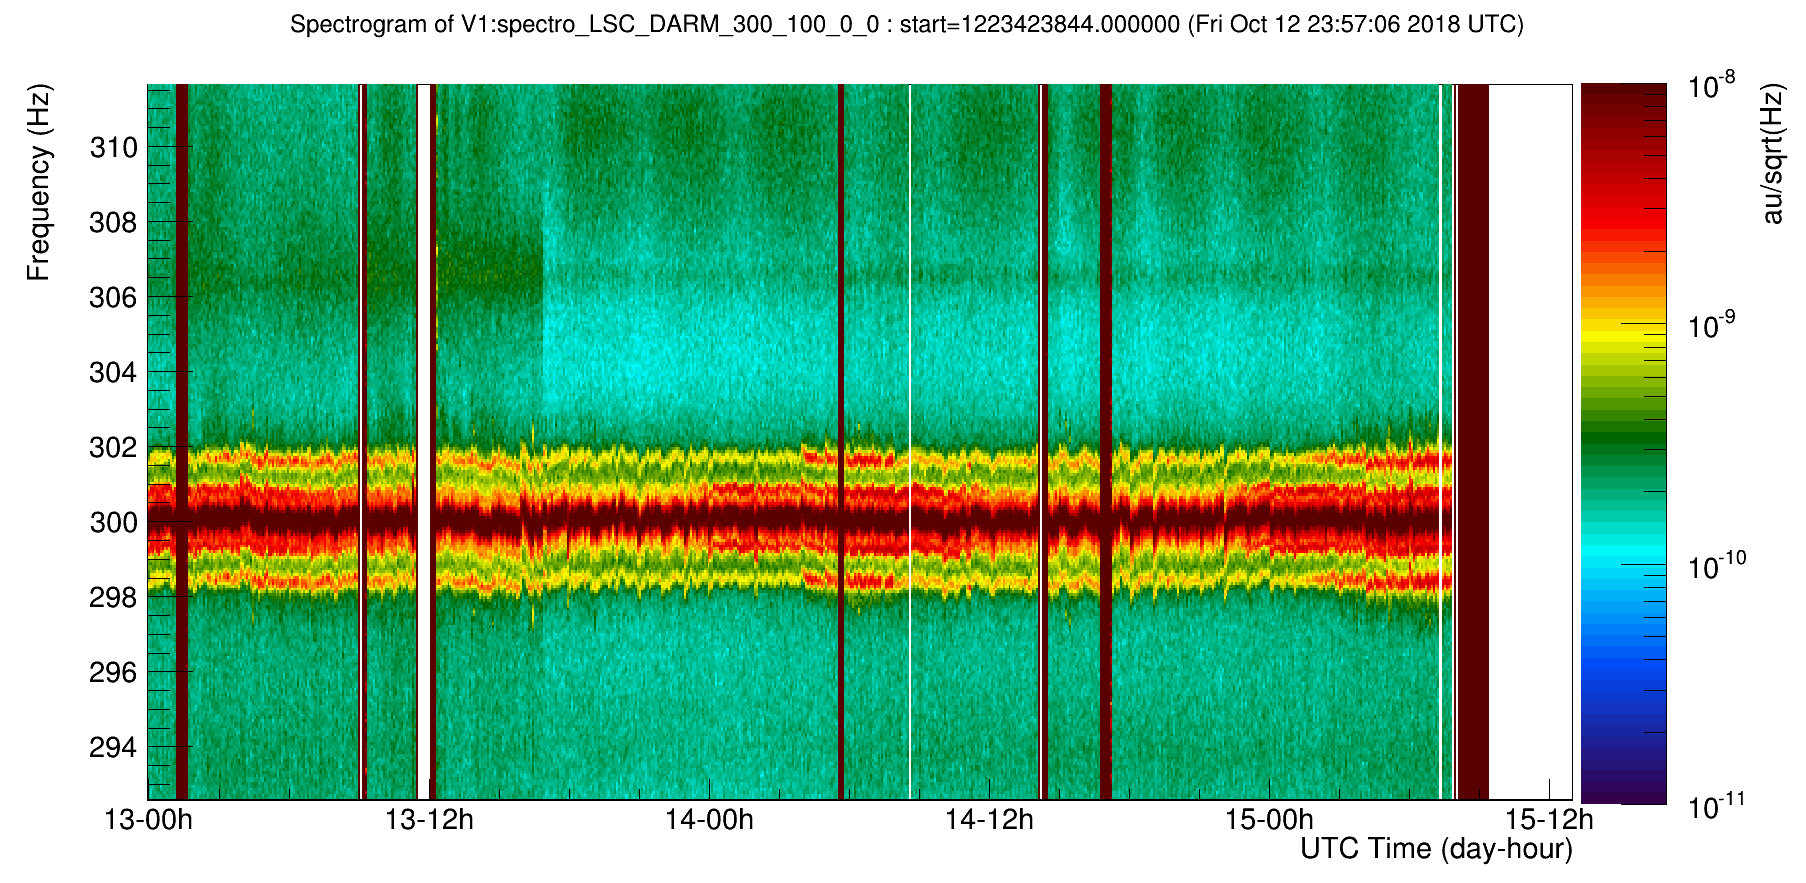
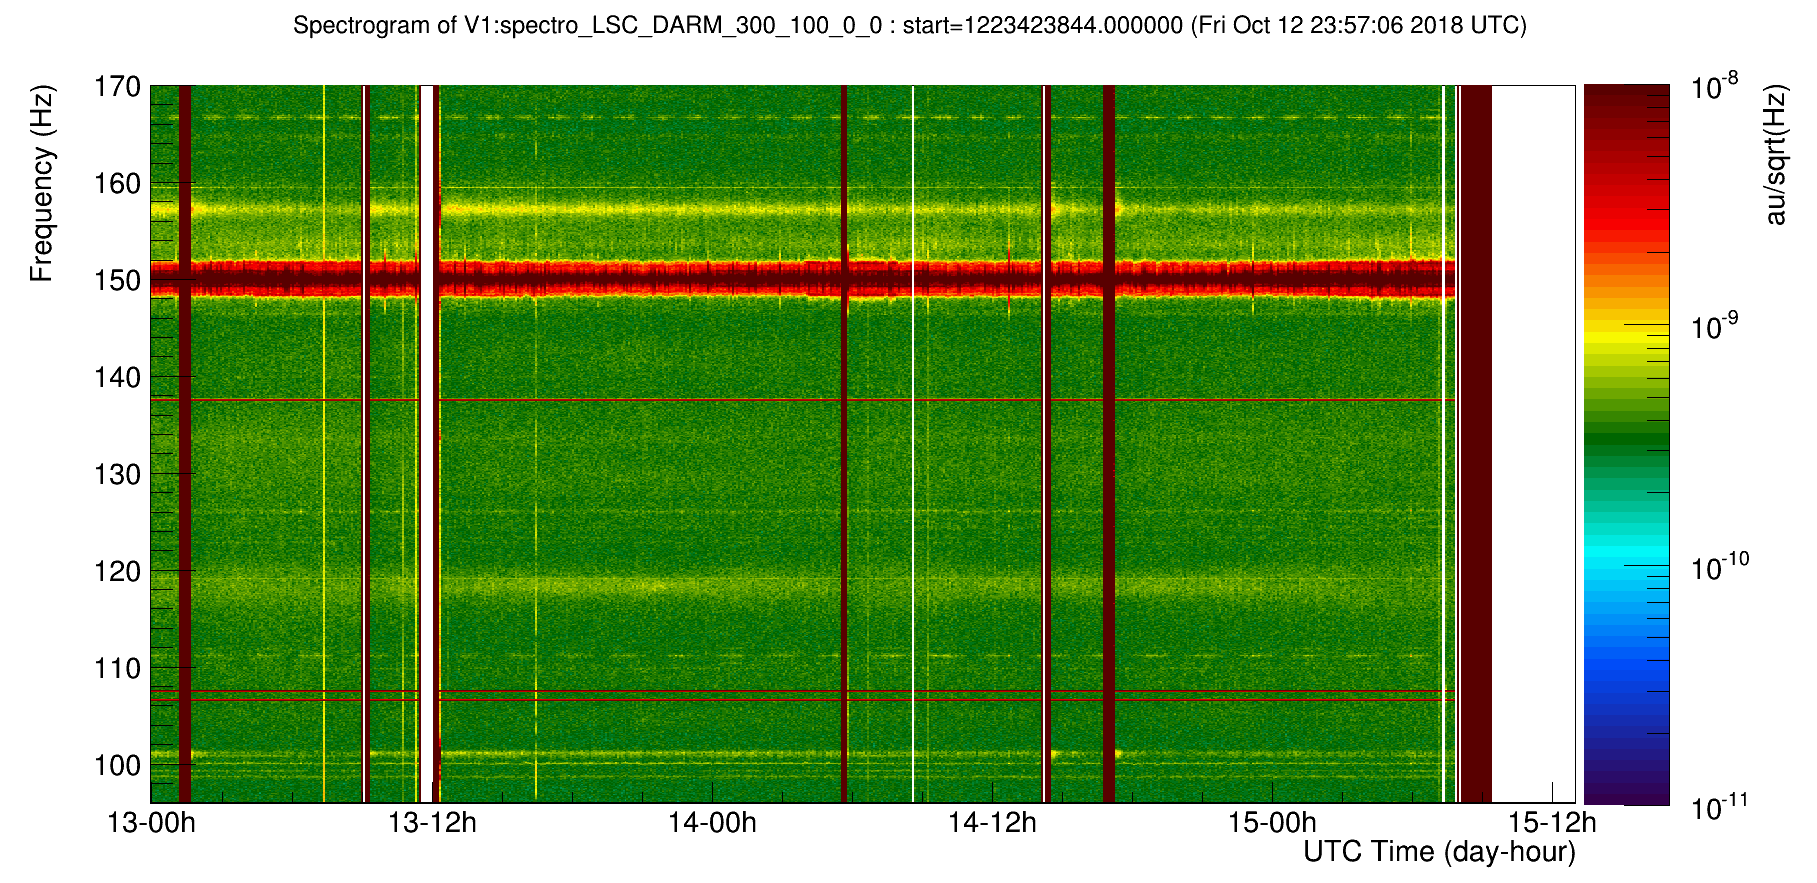
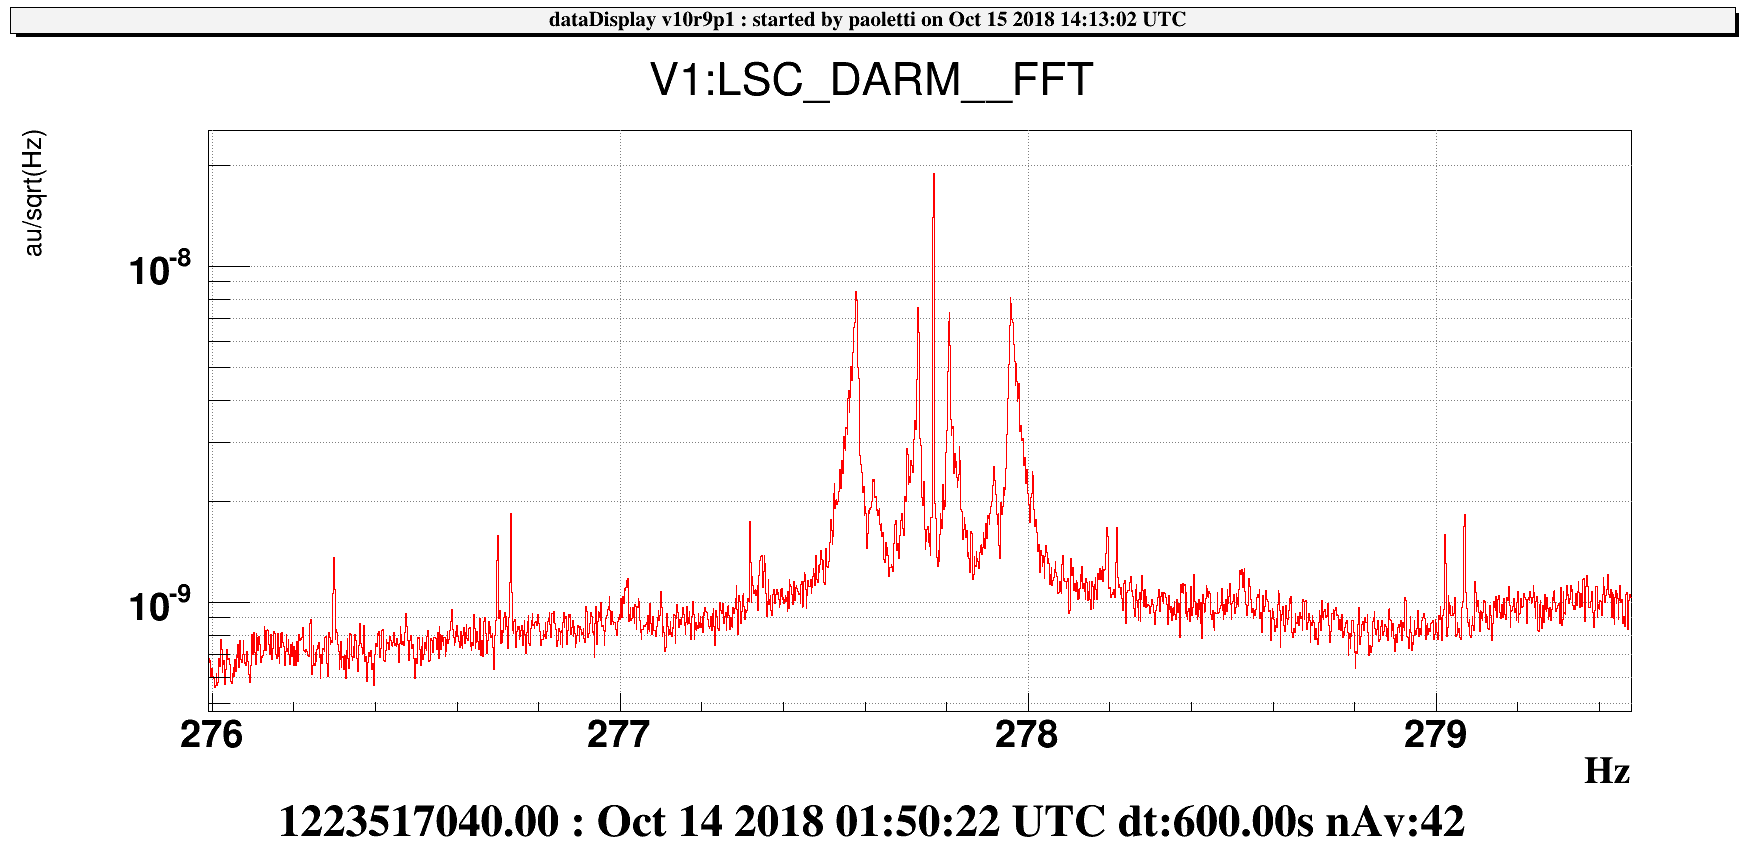
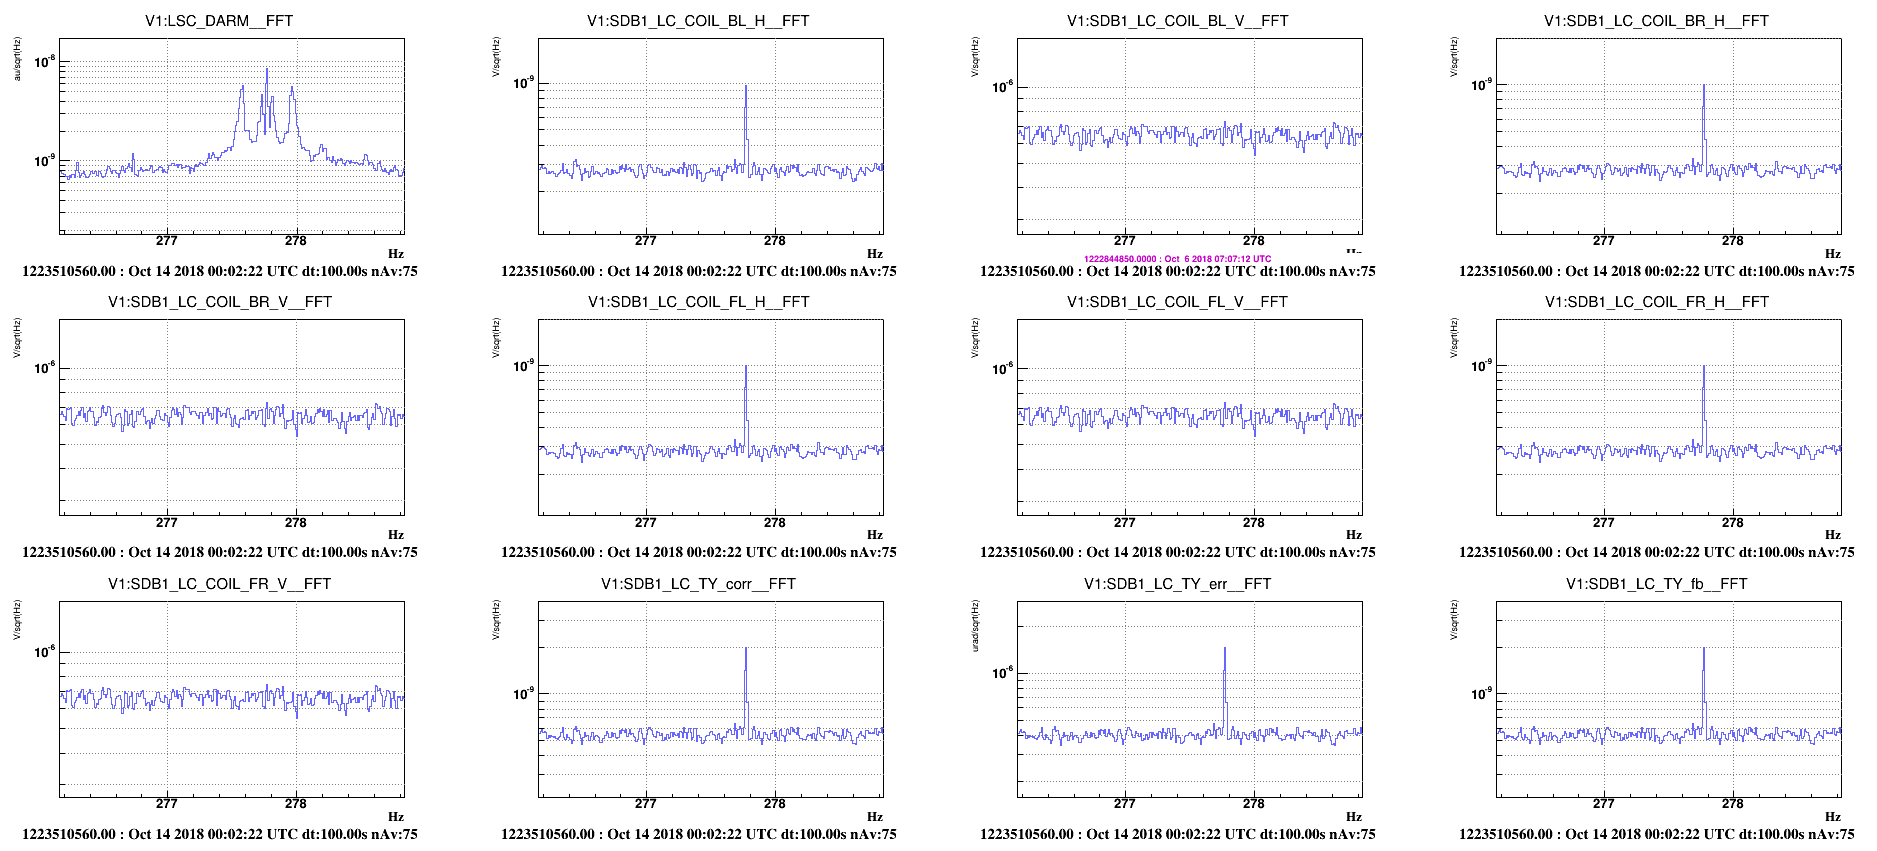
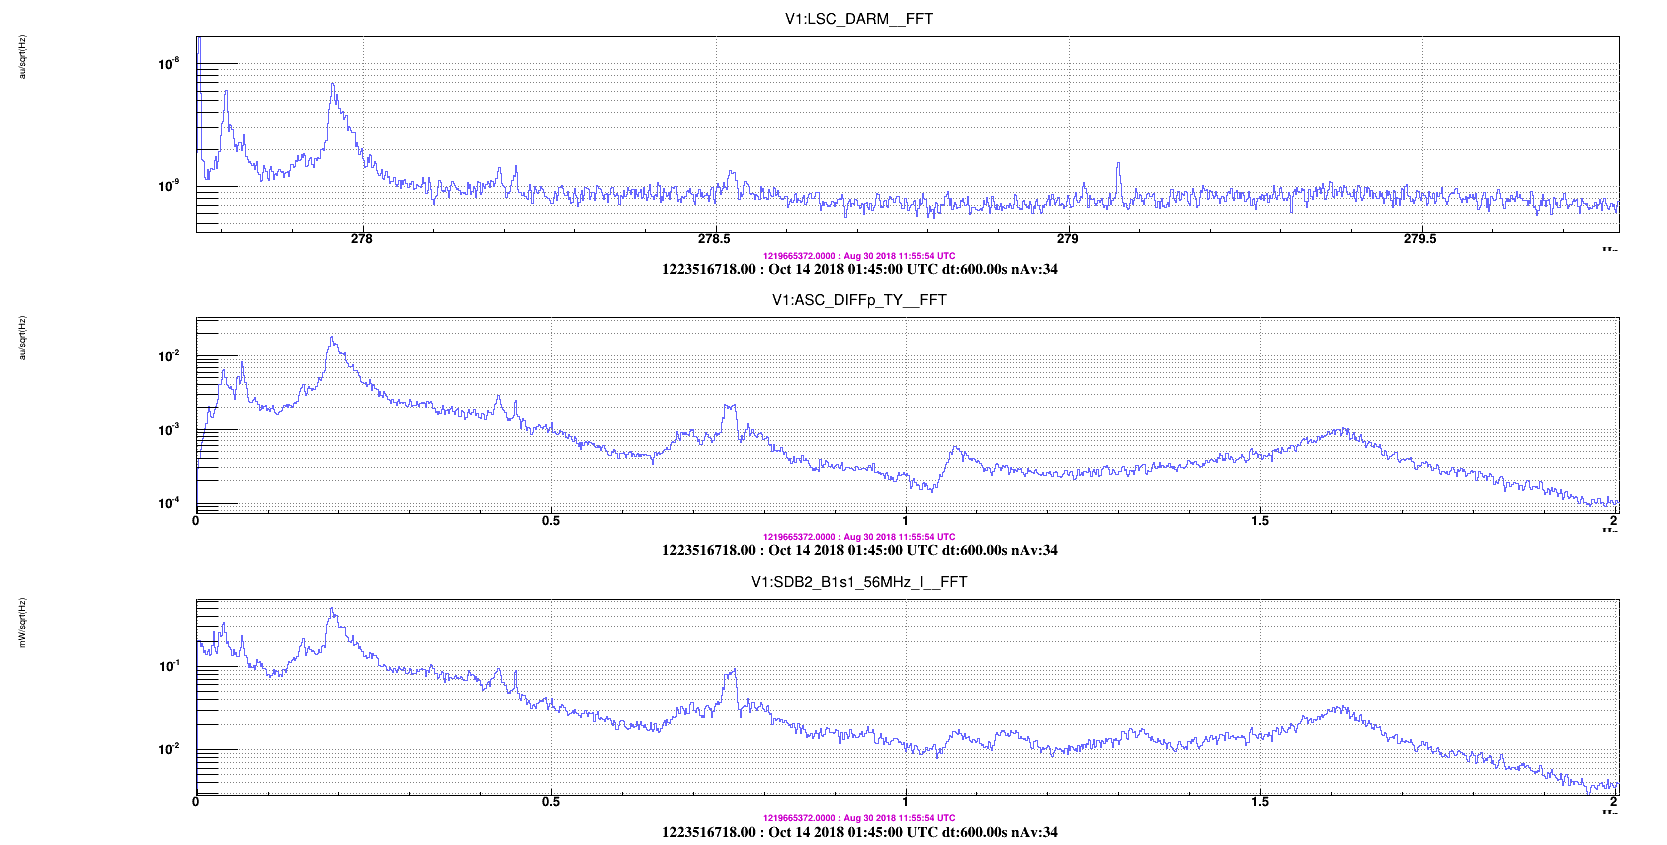
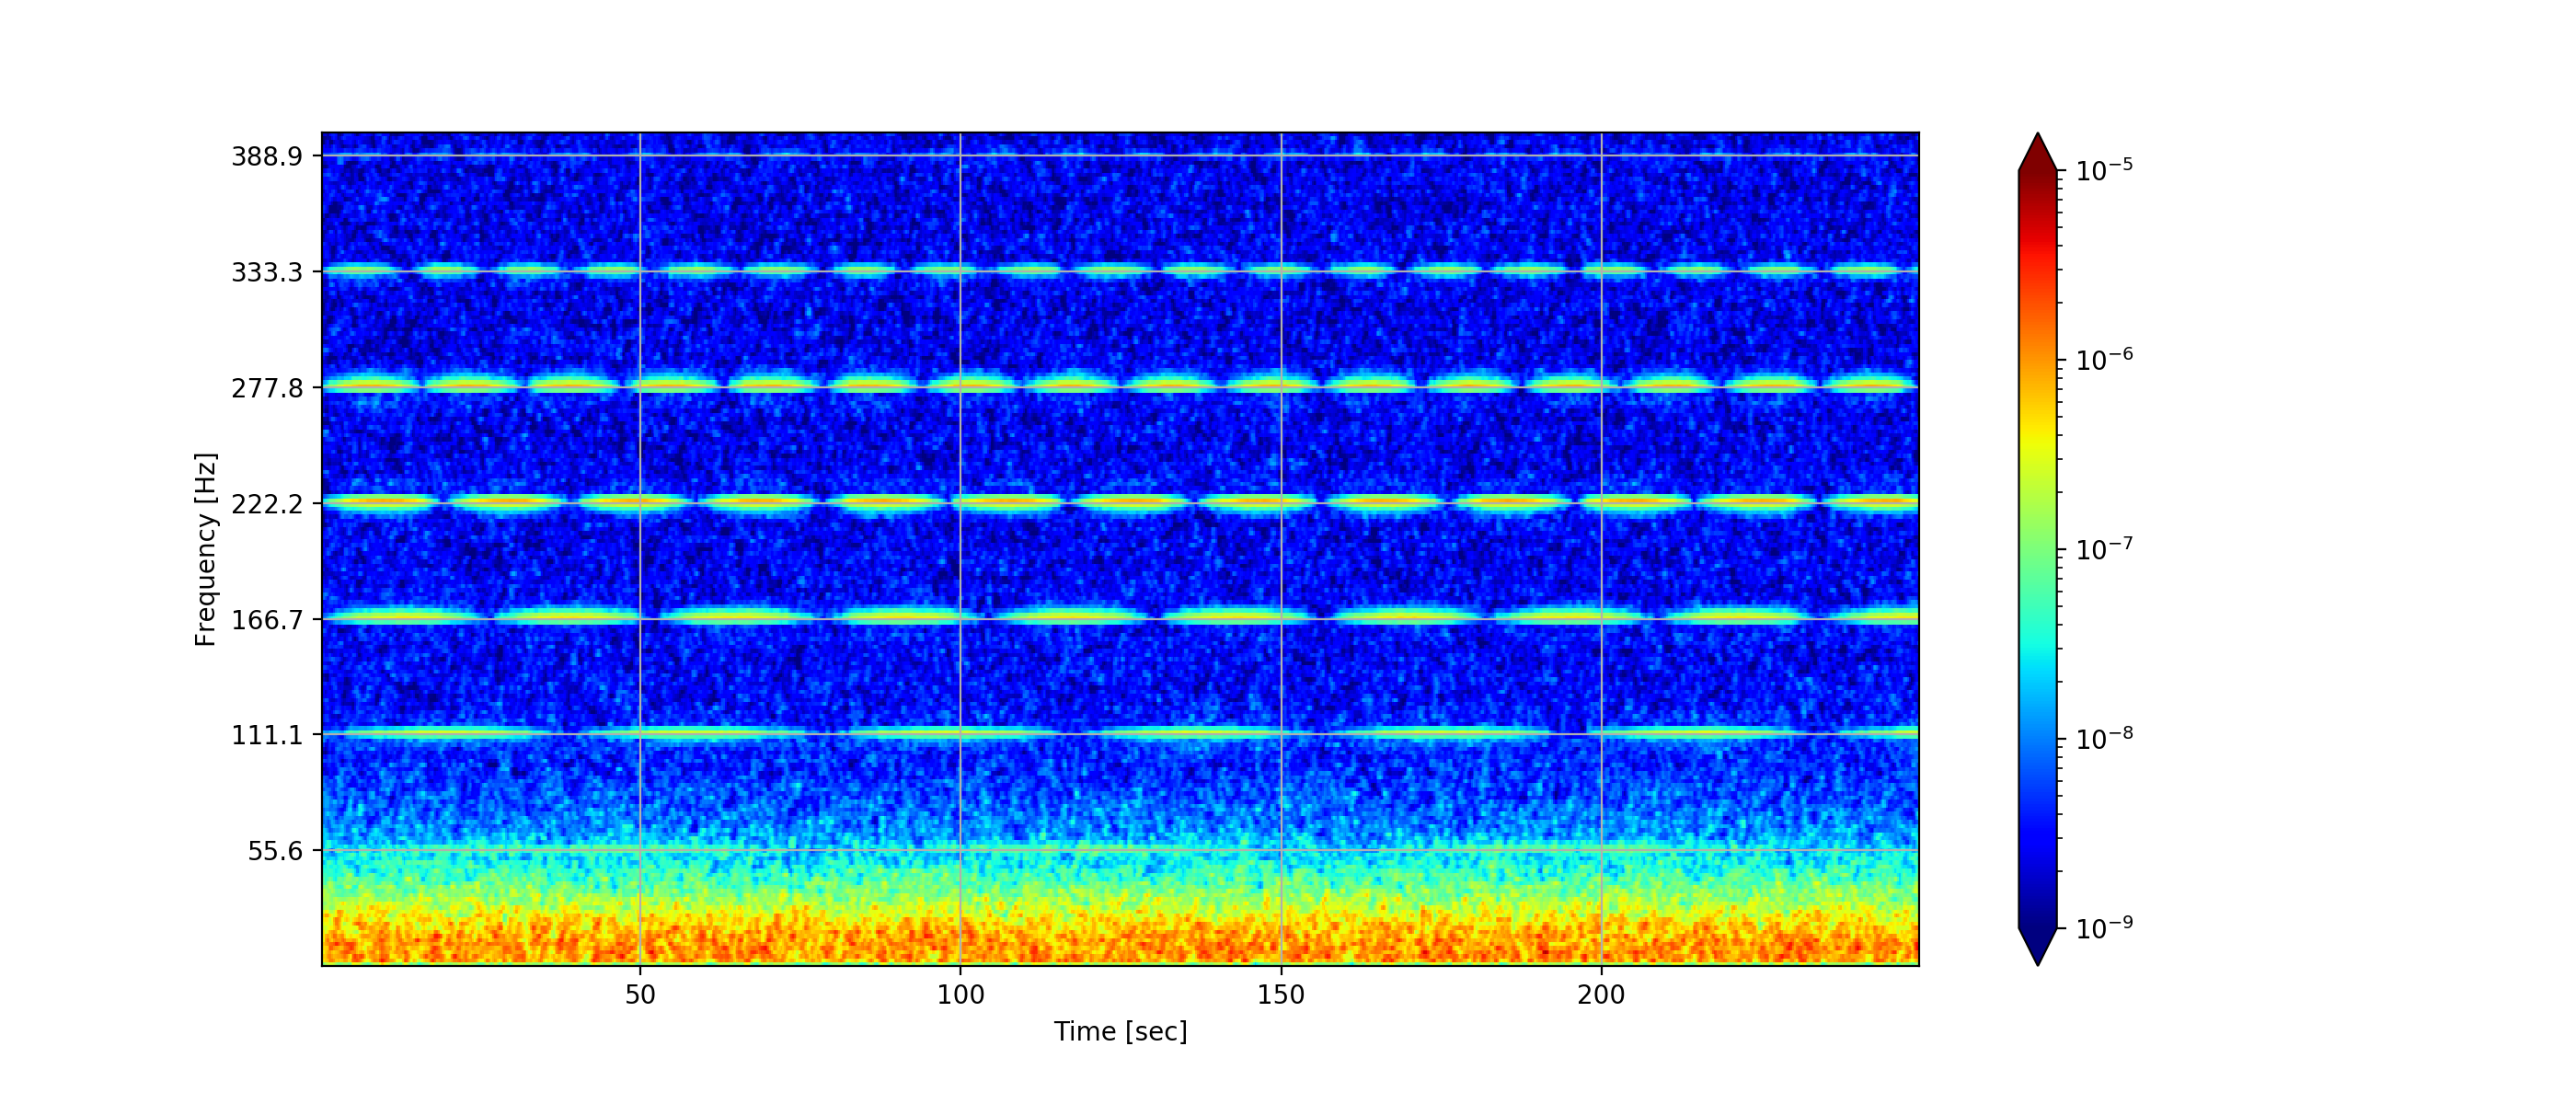
I think that the lines we see in the LSC_DARM spectrogram are likely to be produced by two "beating" square waves with frequencies very close to each other. In particular, this could be the case of one square wave with frequency f0 = 27.7778 Hz which couples to a second one with frequency f1 = f0 + 6.4*10^-5 Hz. This frequency difference produces the very slow amplitude modulation, of the order of some hours, visible in the LSC_DARM spectrogram, which also depends on the frequency of the line.

Alternatively, the same effect can be produced by the superposition of two square waves with similar amplitudes, one with 55.5556 Hz and the other with 6.4*10^-5 Hz of frequency.

Further details can be found in this ipython notebook: http://nbviewer.jupyter.org/urls/gitlab.com/fdirenzo/spectrogram-tests/raw/master/on-off_lines.ipynb.

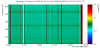
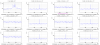
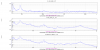
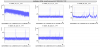
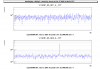
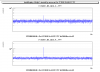
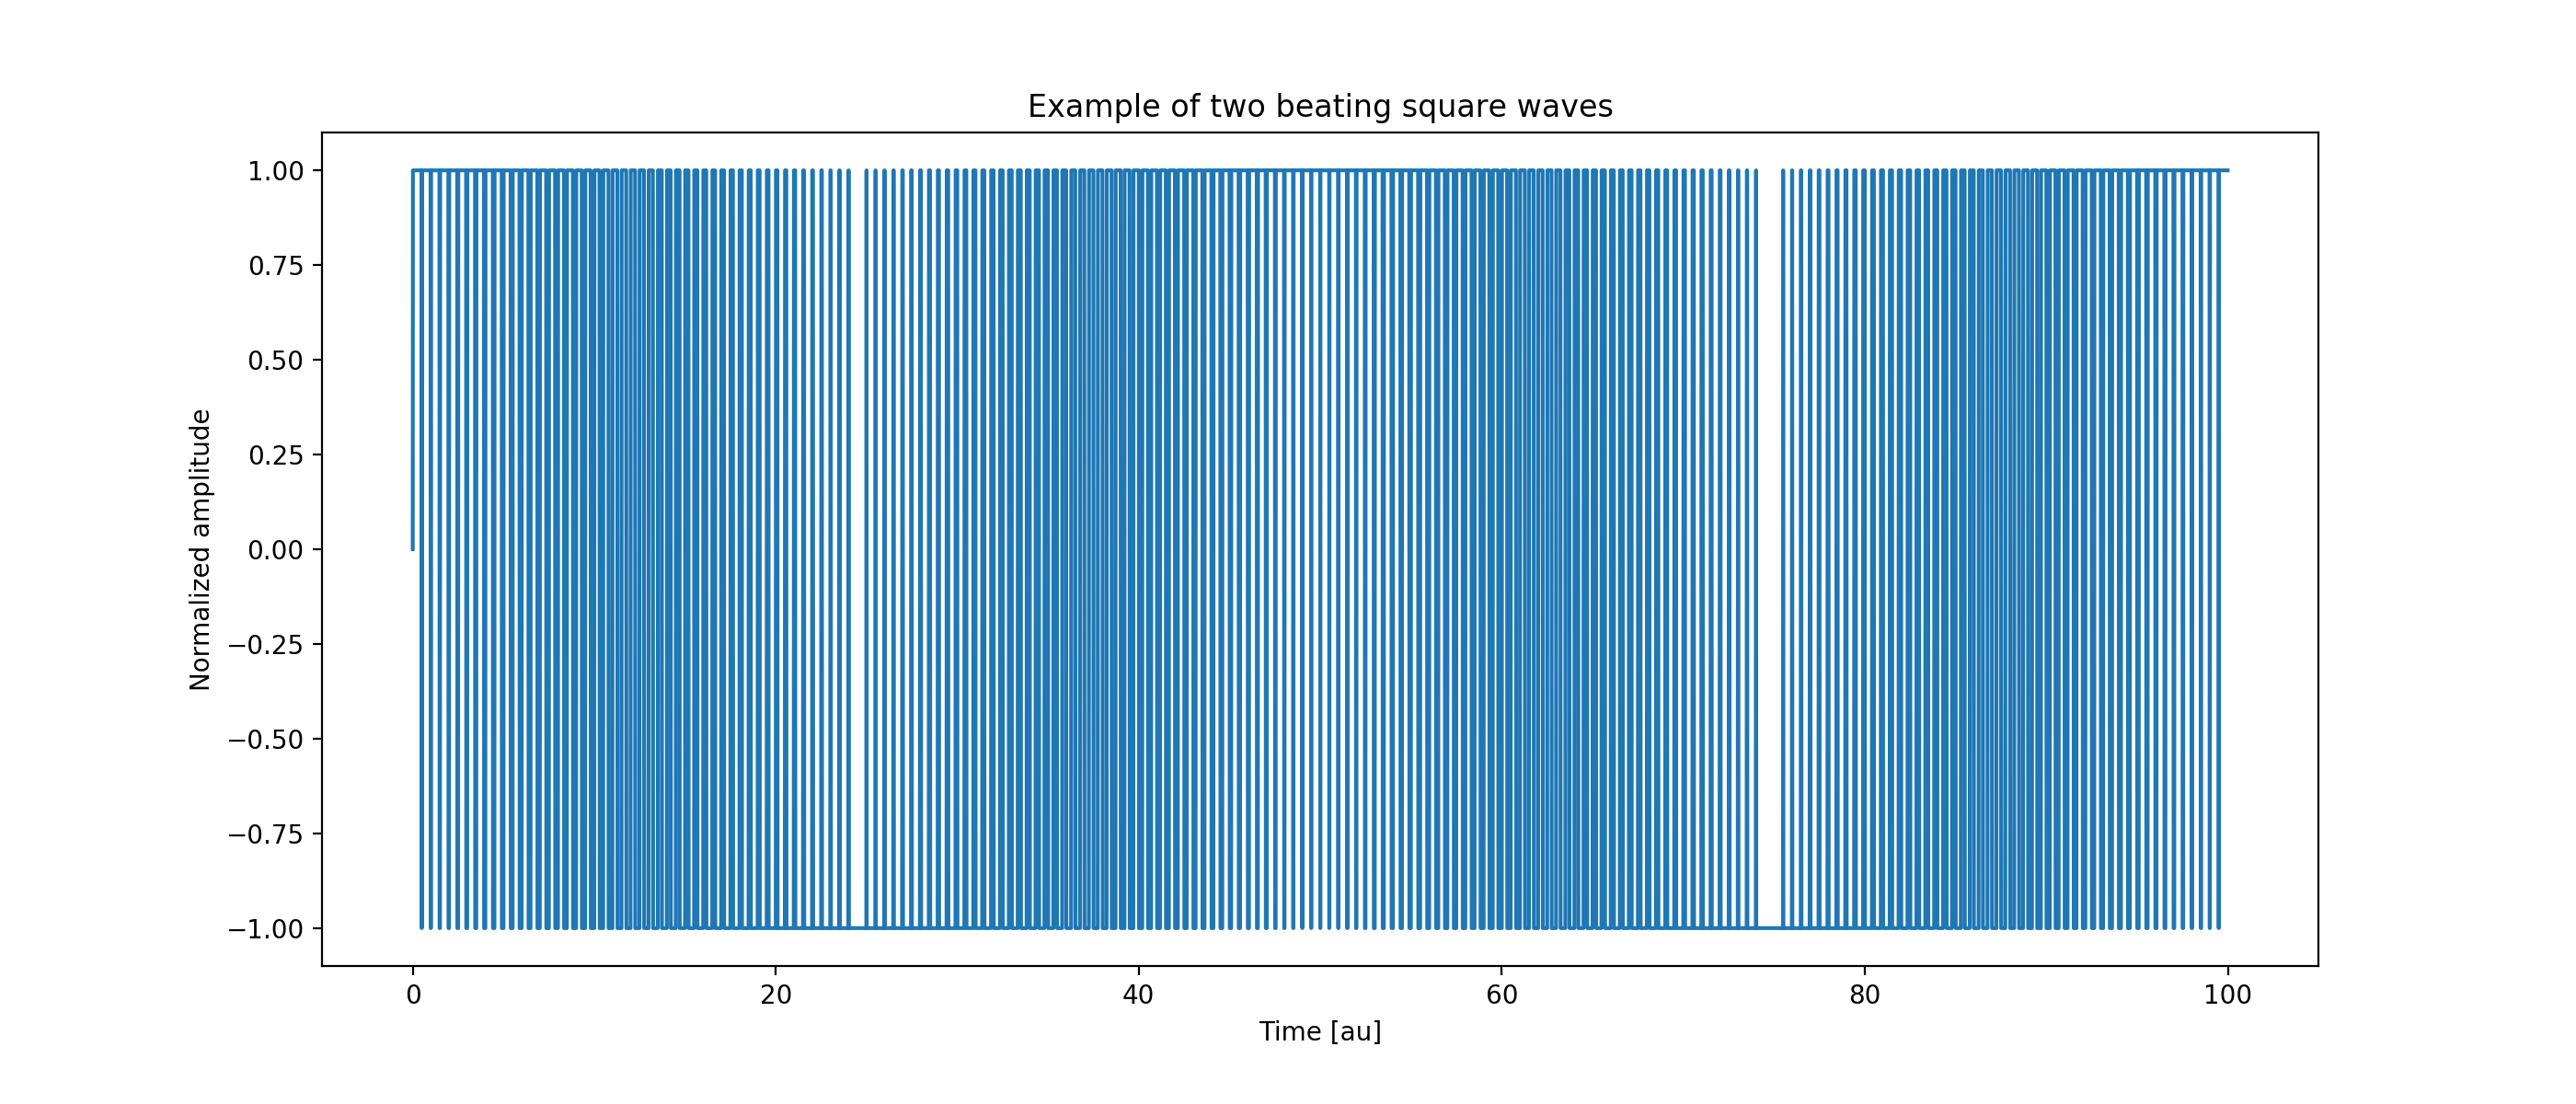
I attached one plot representing the beating of two square waves with frequencies differing by just 2% (exagerating the described effect) , and the spectrogram of two beating square waves with f0 = 27.77 Hz and |f1 - f0| = 6.4*10^-3 Hz, that is two orders of magnitude "faster" than what we see in the LSC_DARM spectrogram. As you can notice, the spectrogram I reproduced is very close to the LSC_DARM one (besides the 100x time squeezing).

Therefore, I wonder if there exist two digital signals with approximately the same frequency, 27.7778 Hz, that could couple and affect the DARM signal?

Images attached to this comment
andrew.lundgren - 0:44 Wednesday 24 October 2018 (43253) Print this report

At Hanford, there appear to be two combs, one in the X end electronics and one in the center station. The two combs each have fundamental frequencies near 56.8 Hz, but are separated by 0.34 mHz. I think there's also a nonlinear mixing of the two required to precisely explain the resulting amplitude modulation. Details are in LHO alog 44707.

Search Help
×

Warning

×