Reports 1-1 of 1 Clear search Modify search
Environmental Monitoring (Environmental Monitoring)
Tringali, Paoletti, Fiori - 12:36 Tuesday 09 September 2025 (67662) Print this report
DET Lab acoustic injection: setup and tests

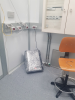
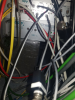
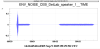
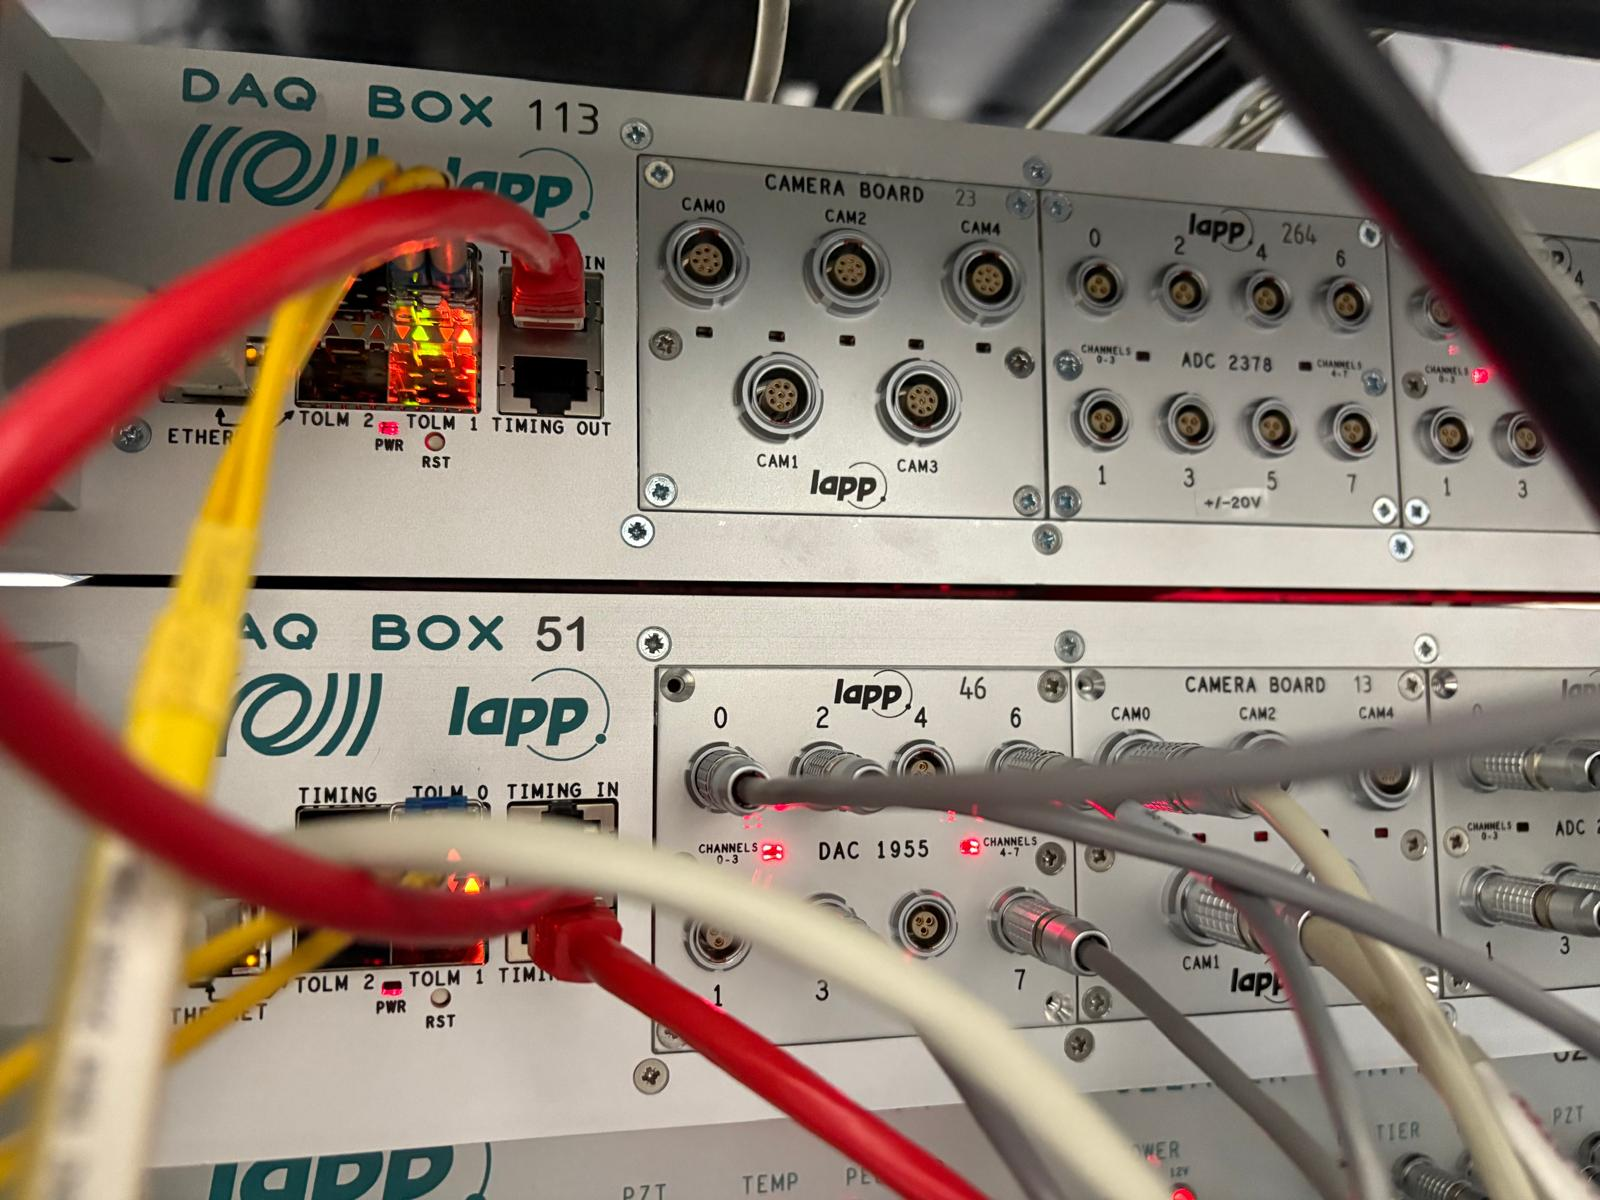
In view of the implementation of the acoustic injection in the METRATON node, we prepared the setup. The loudspeaker was installed in the DET Lab (in the corner, behind the door) and powered by a standard UPS socket, see Figure 1. The DAC channel used for the noise injection is located under the EDB, see Figure 2, 3 . Details are given below:

*******************************************************************************
DAQ box: DBOX_SN51, DAC1955_SN46
Channel used:  7
Channel of ENV noise matrix: NOISE_CEB_DetLab_speaker_1

*******************************************************************************

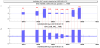
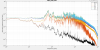
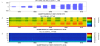
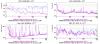
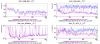
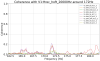
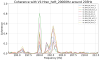
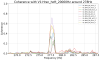
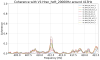
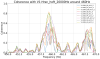
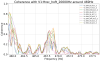
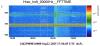
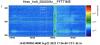
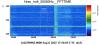
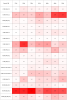
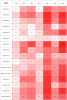
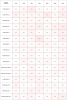
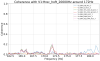
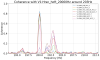
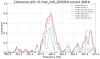
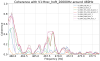
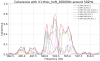
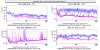
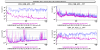
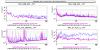
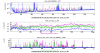
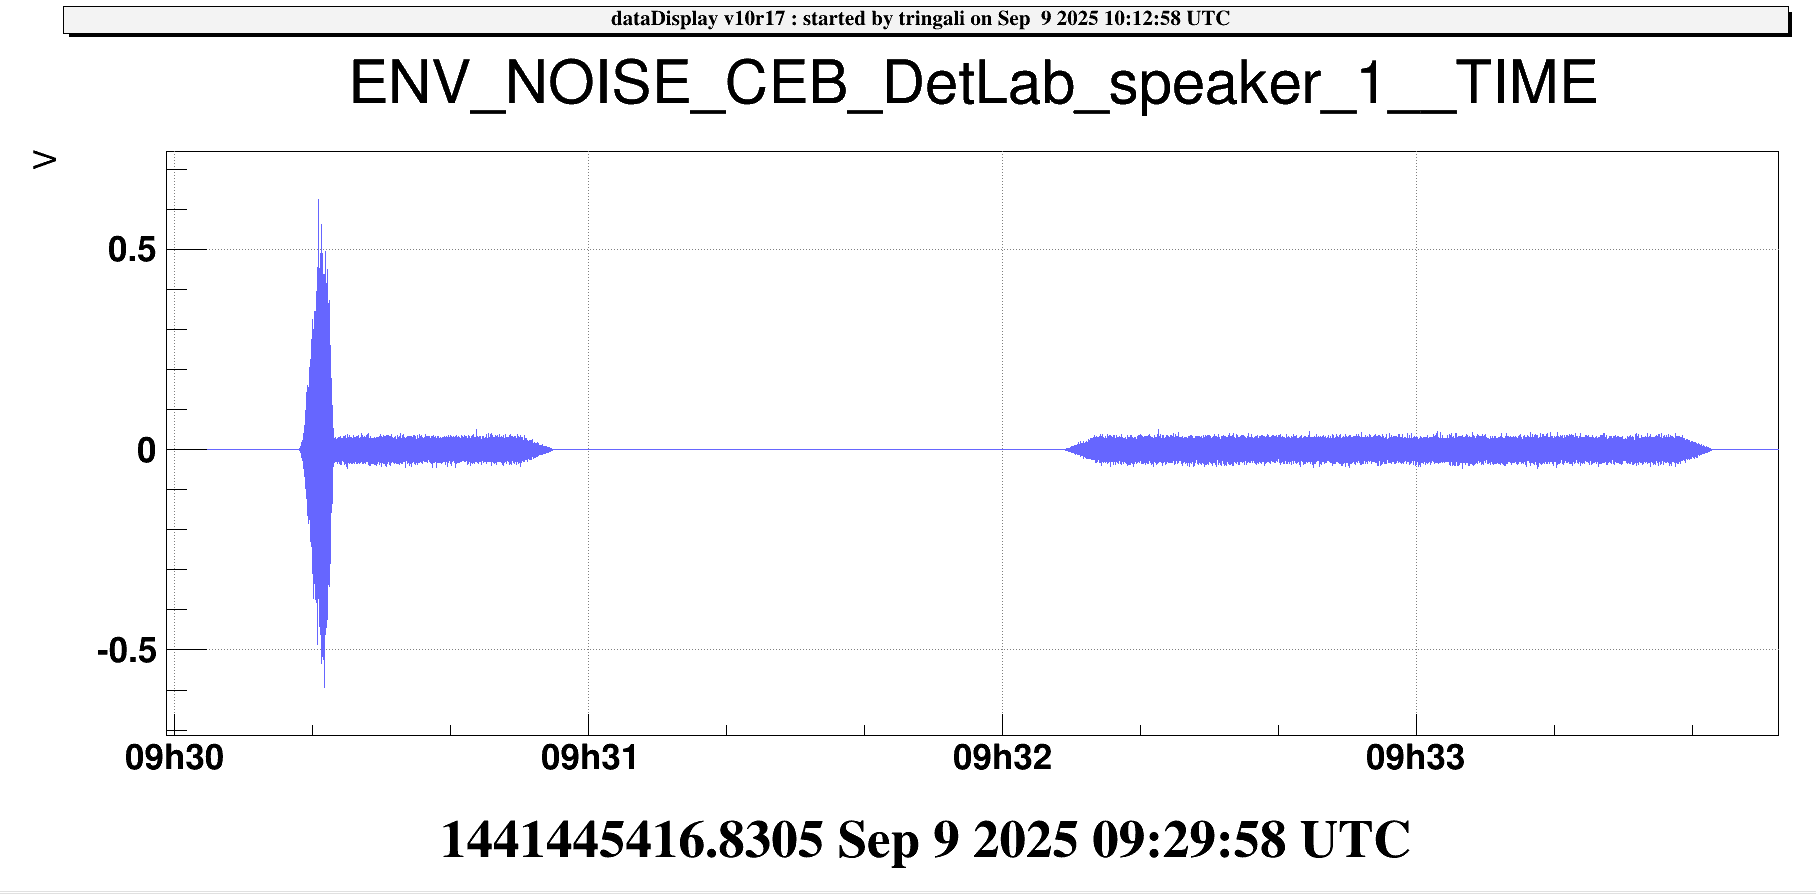
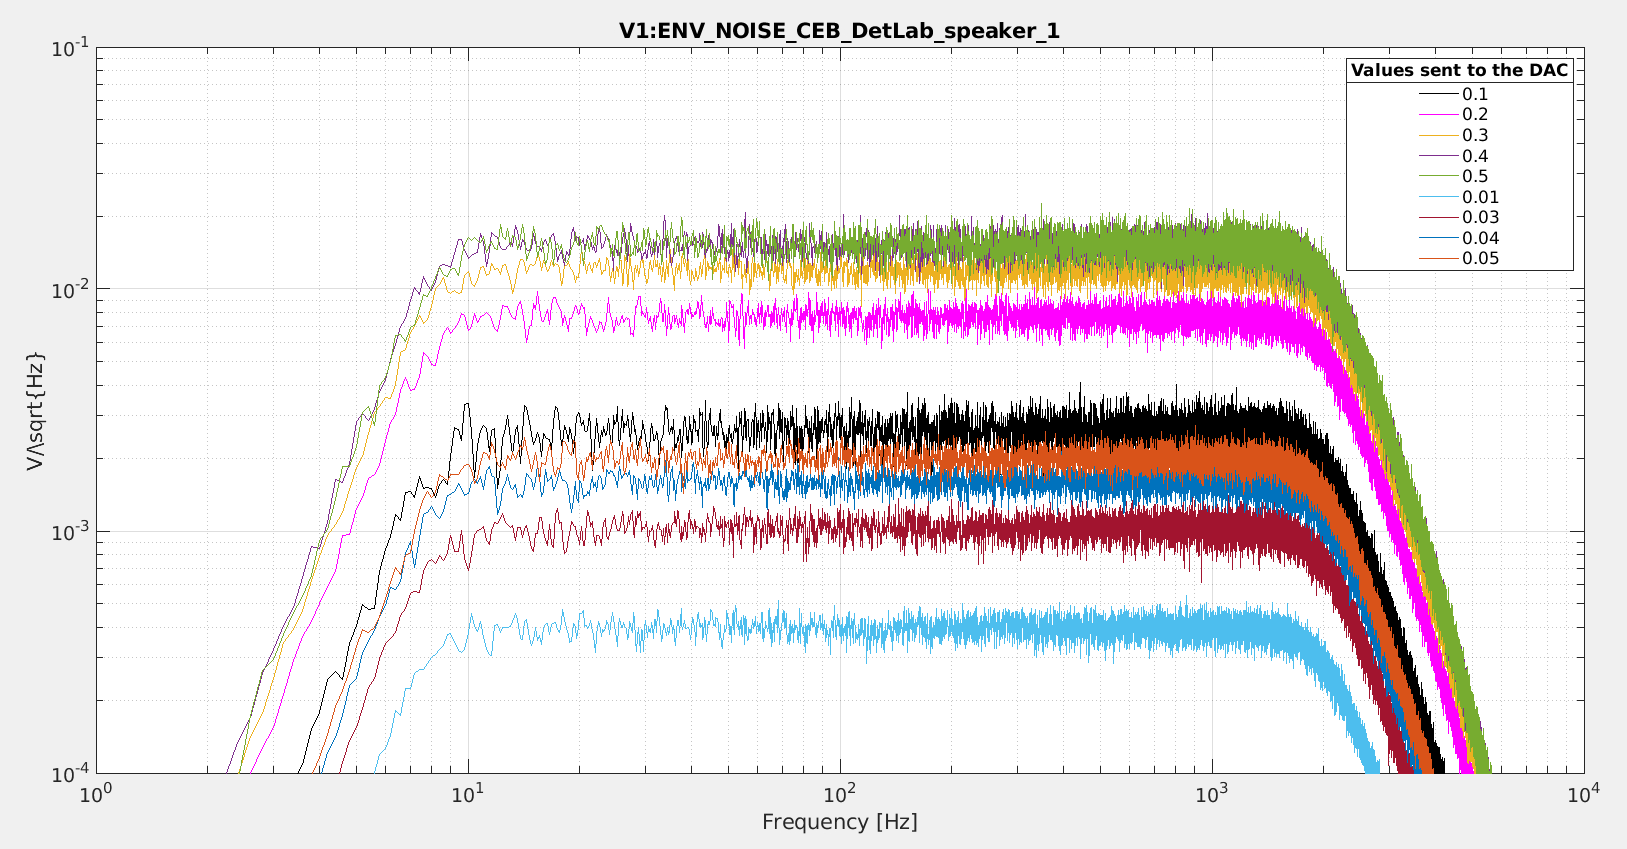
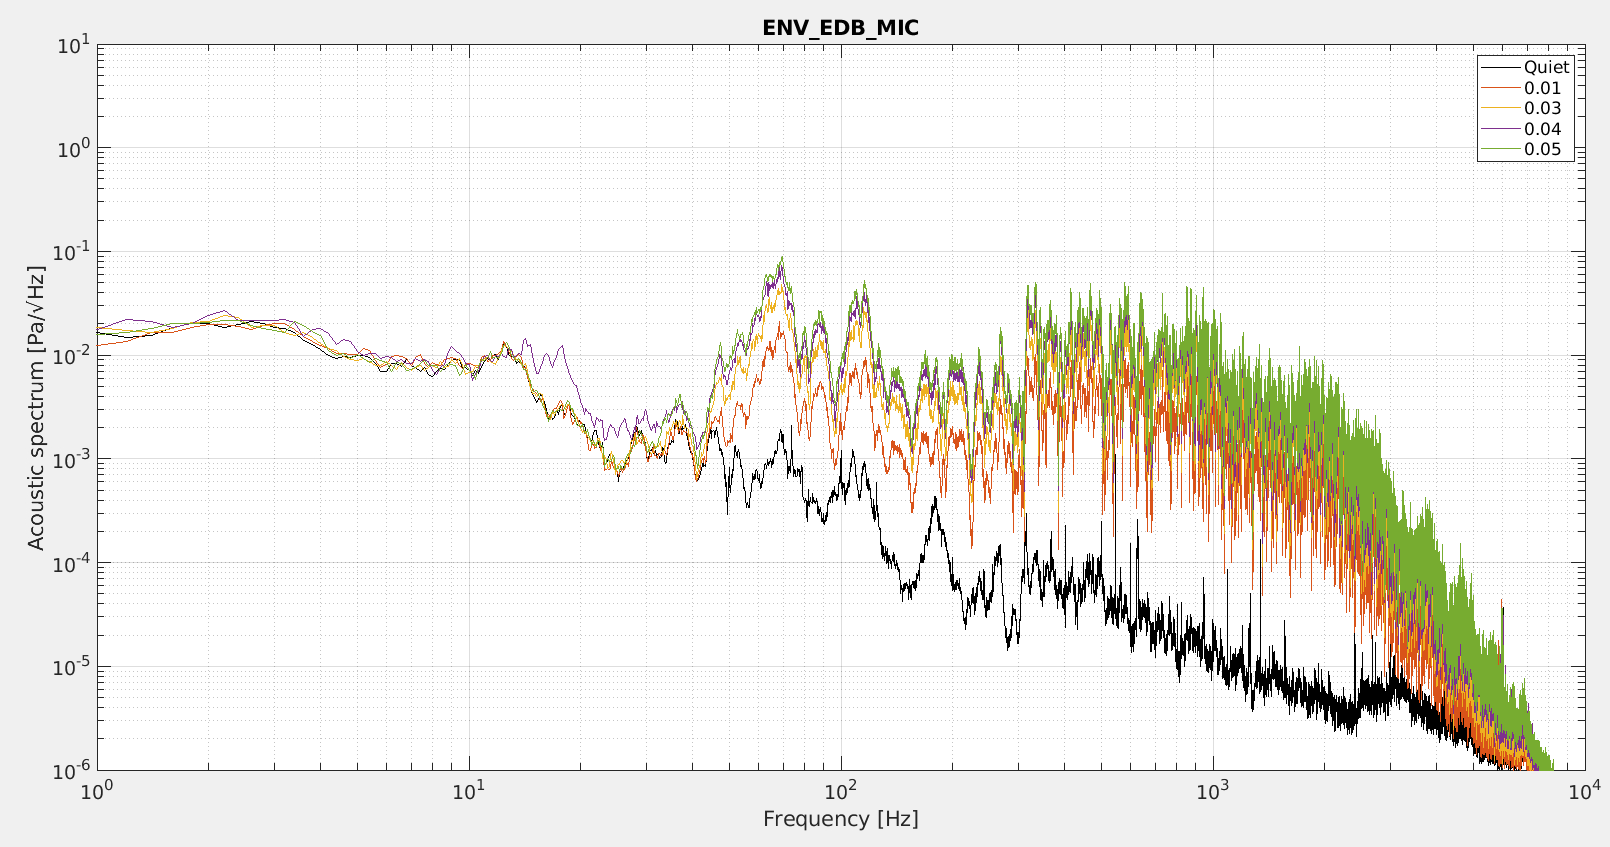
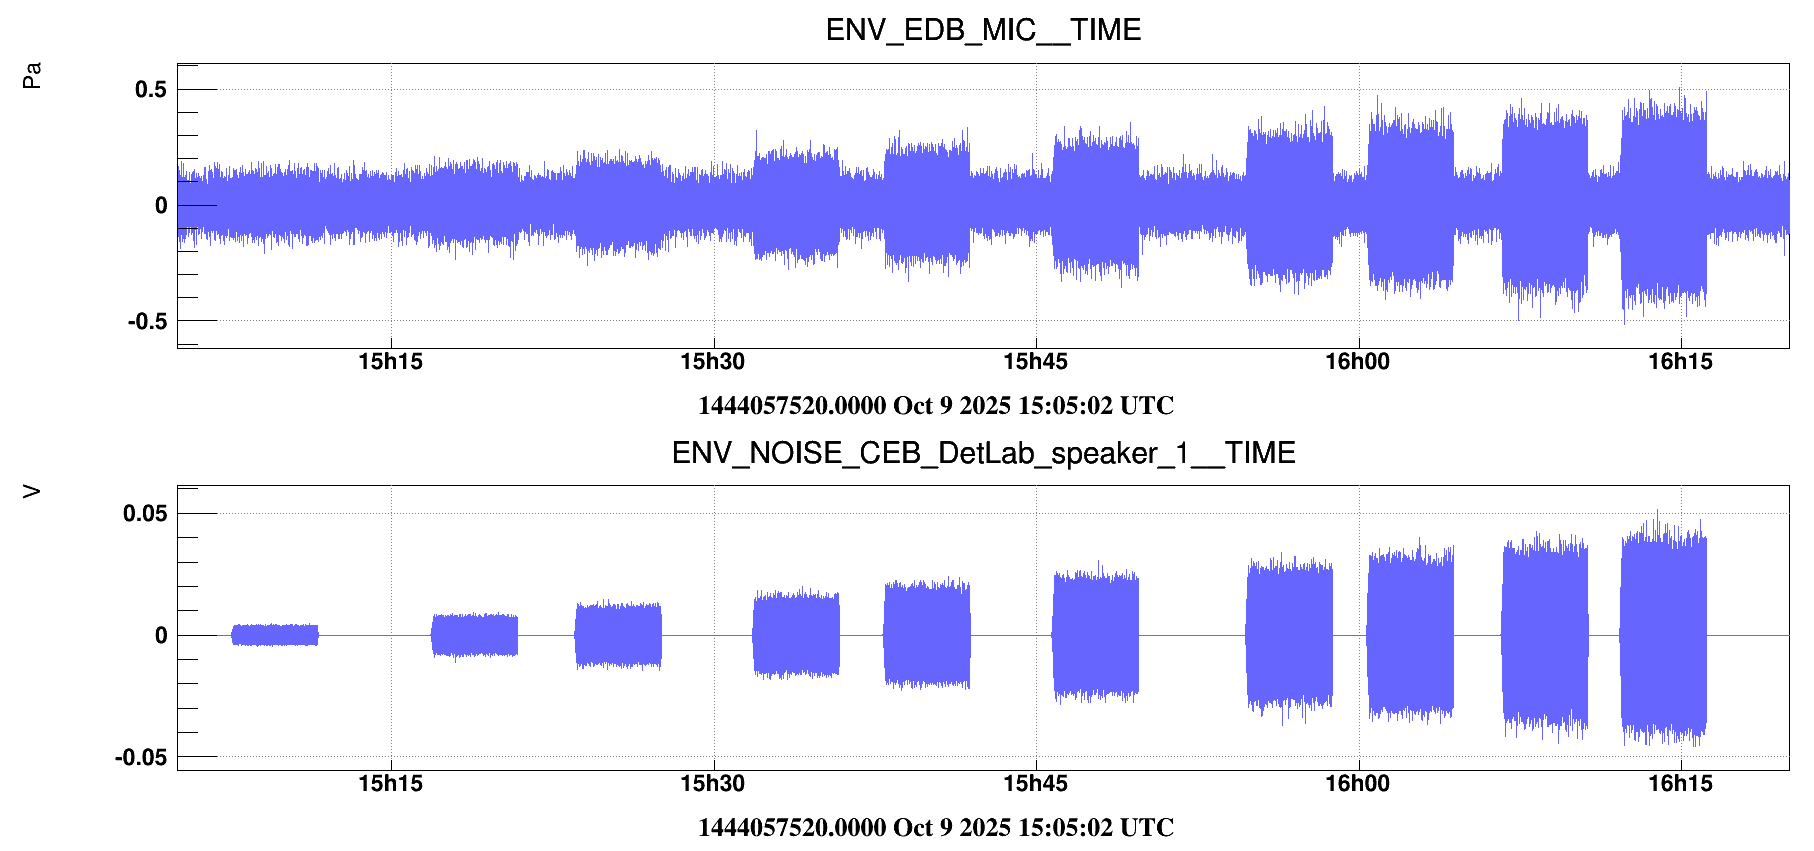
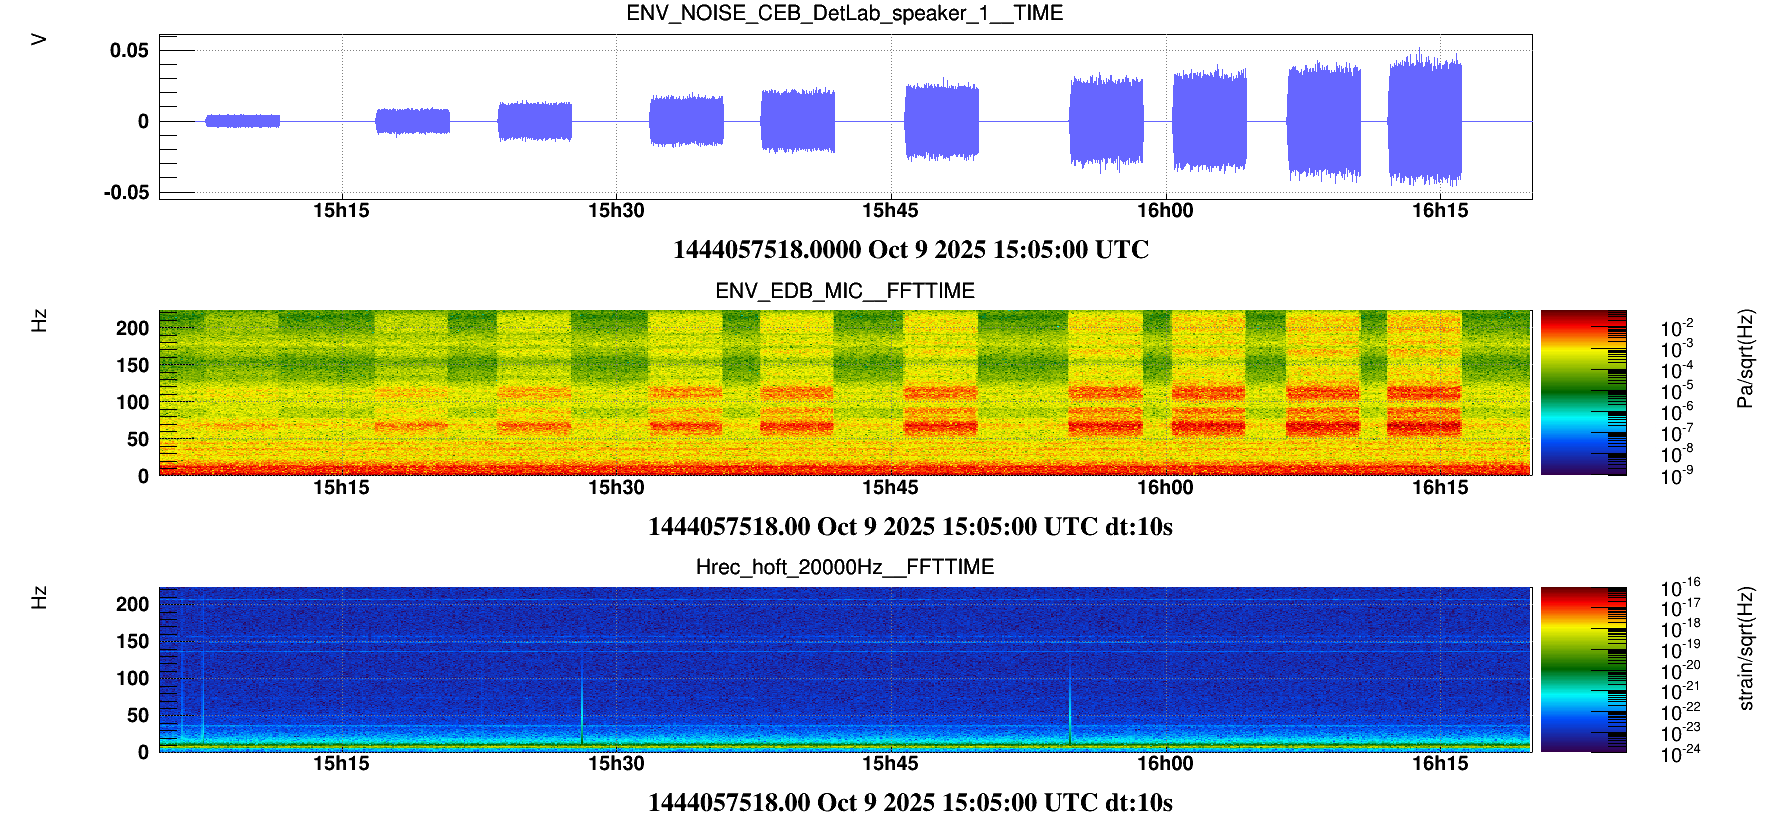
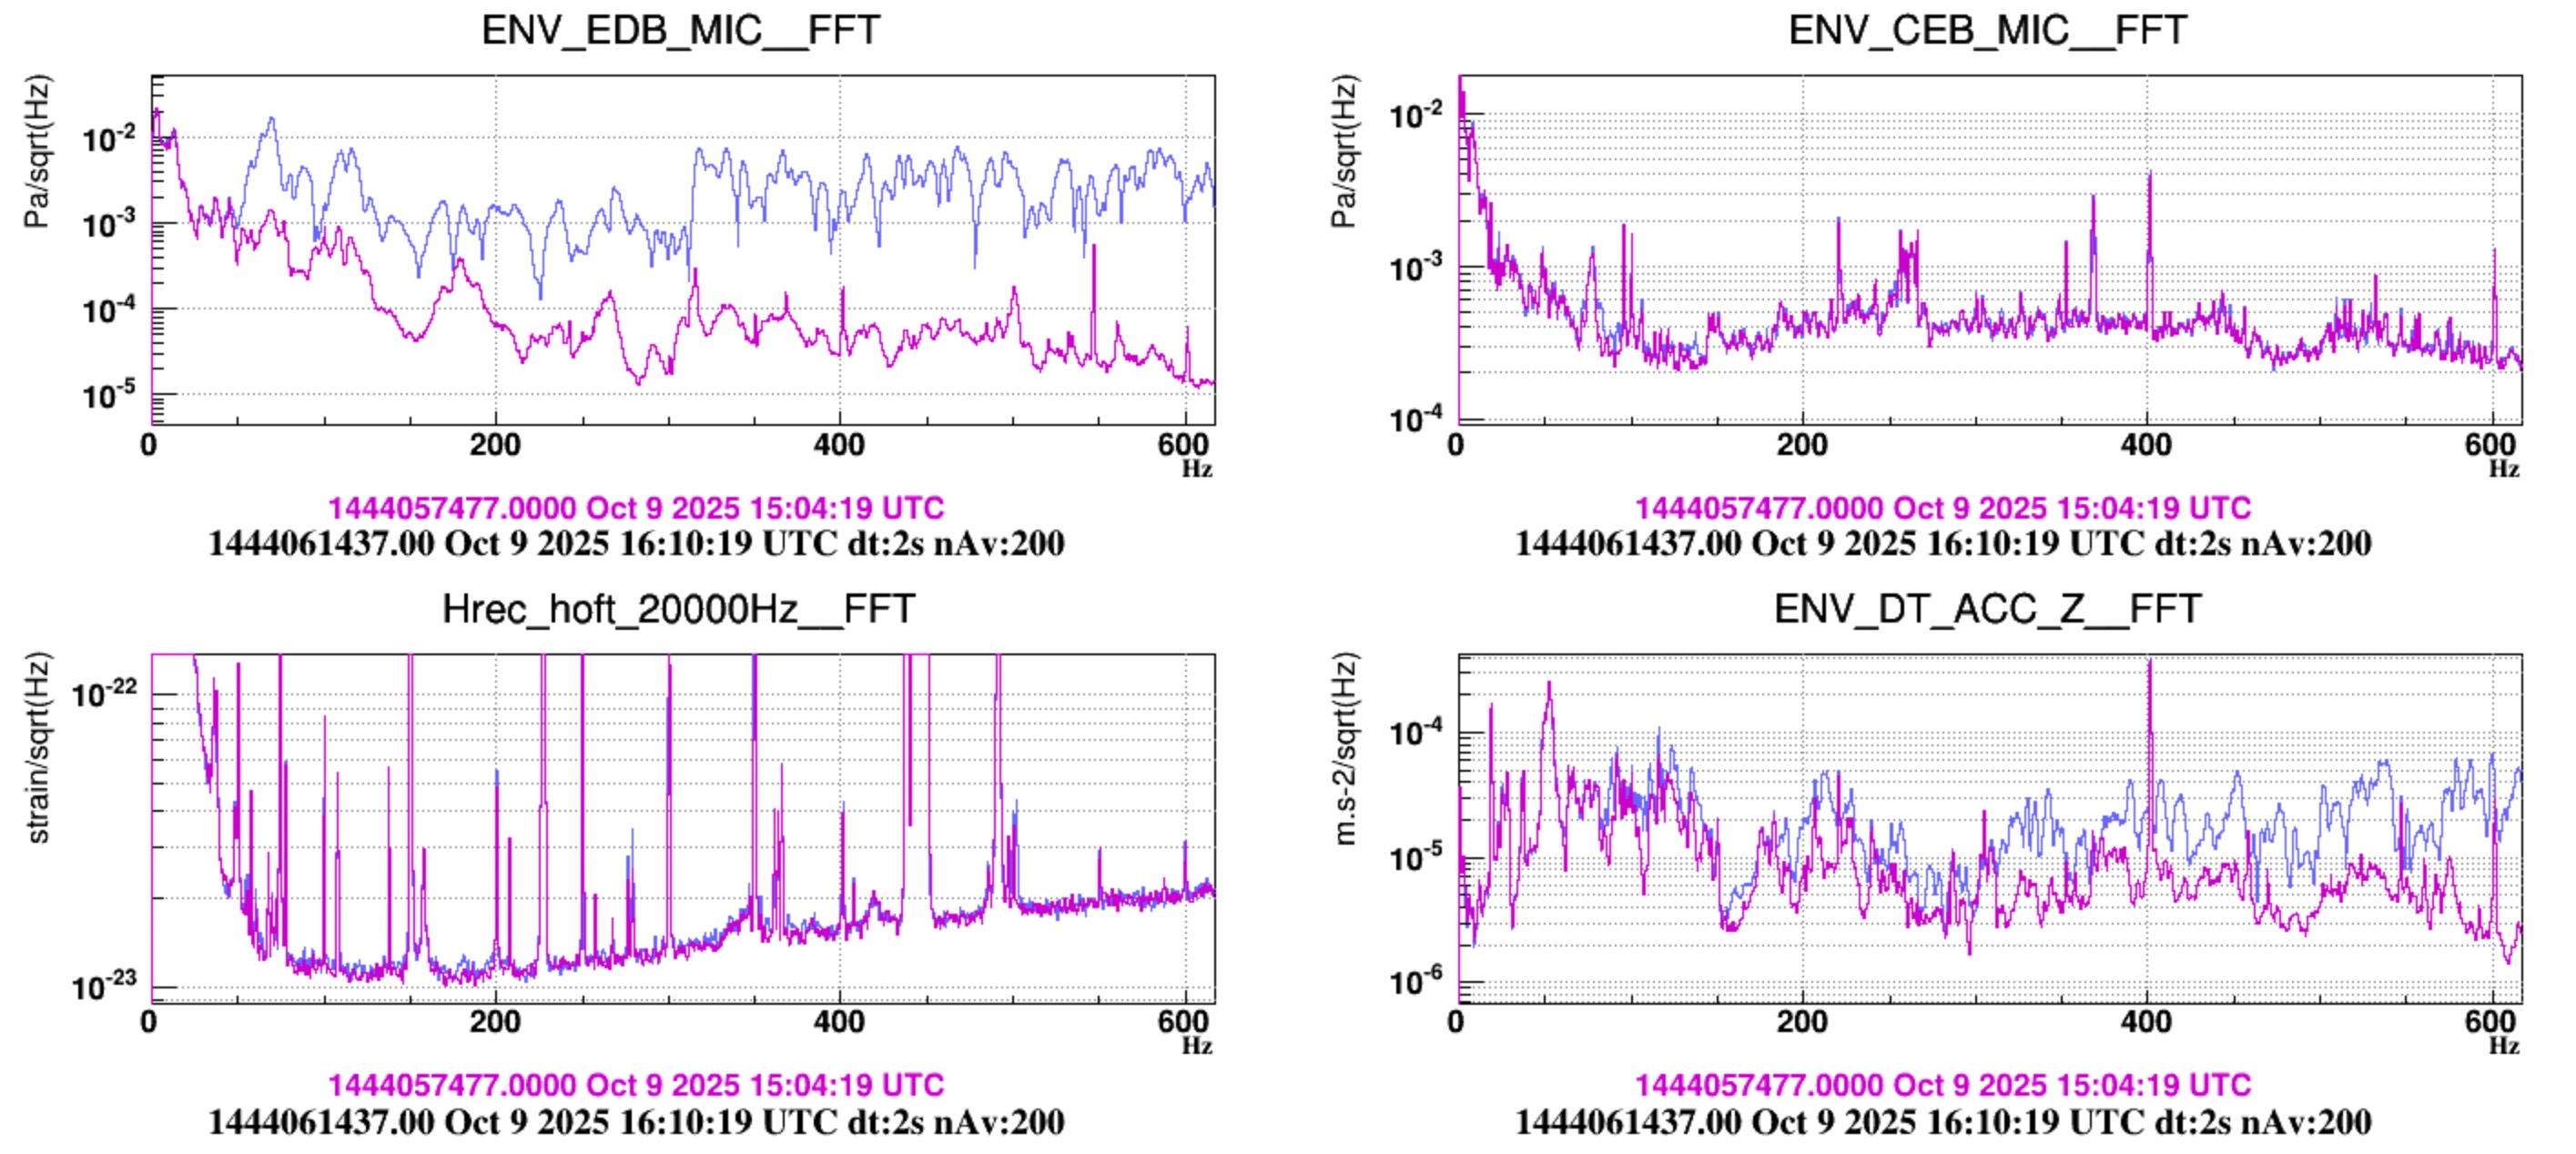
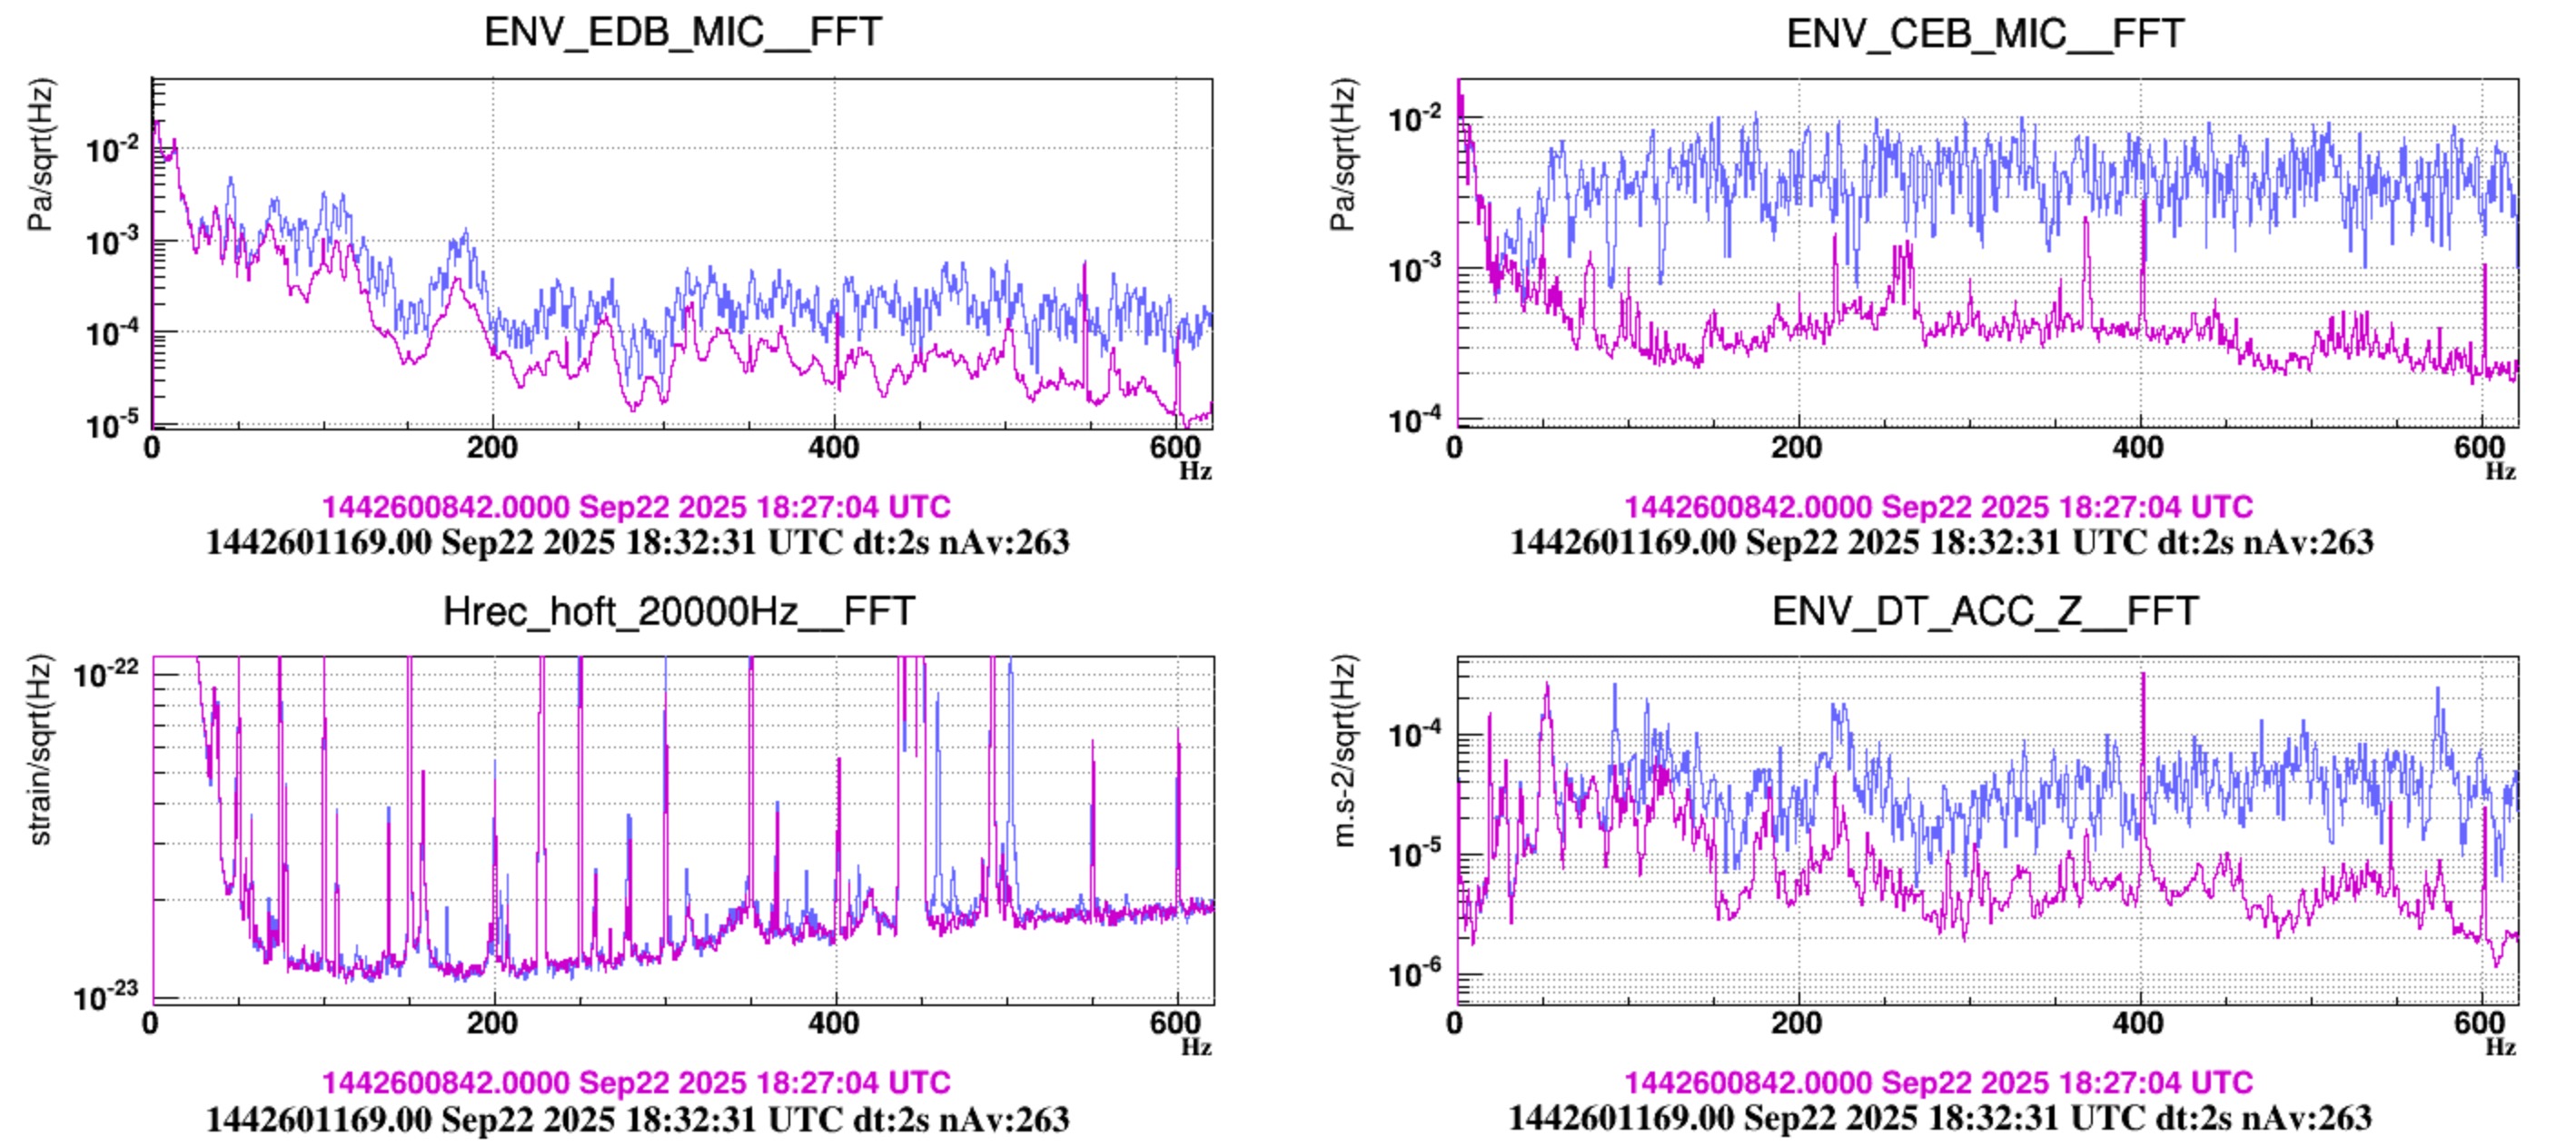
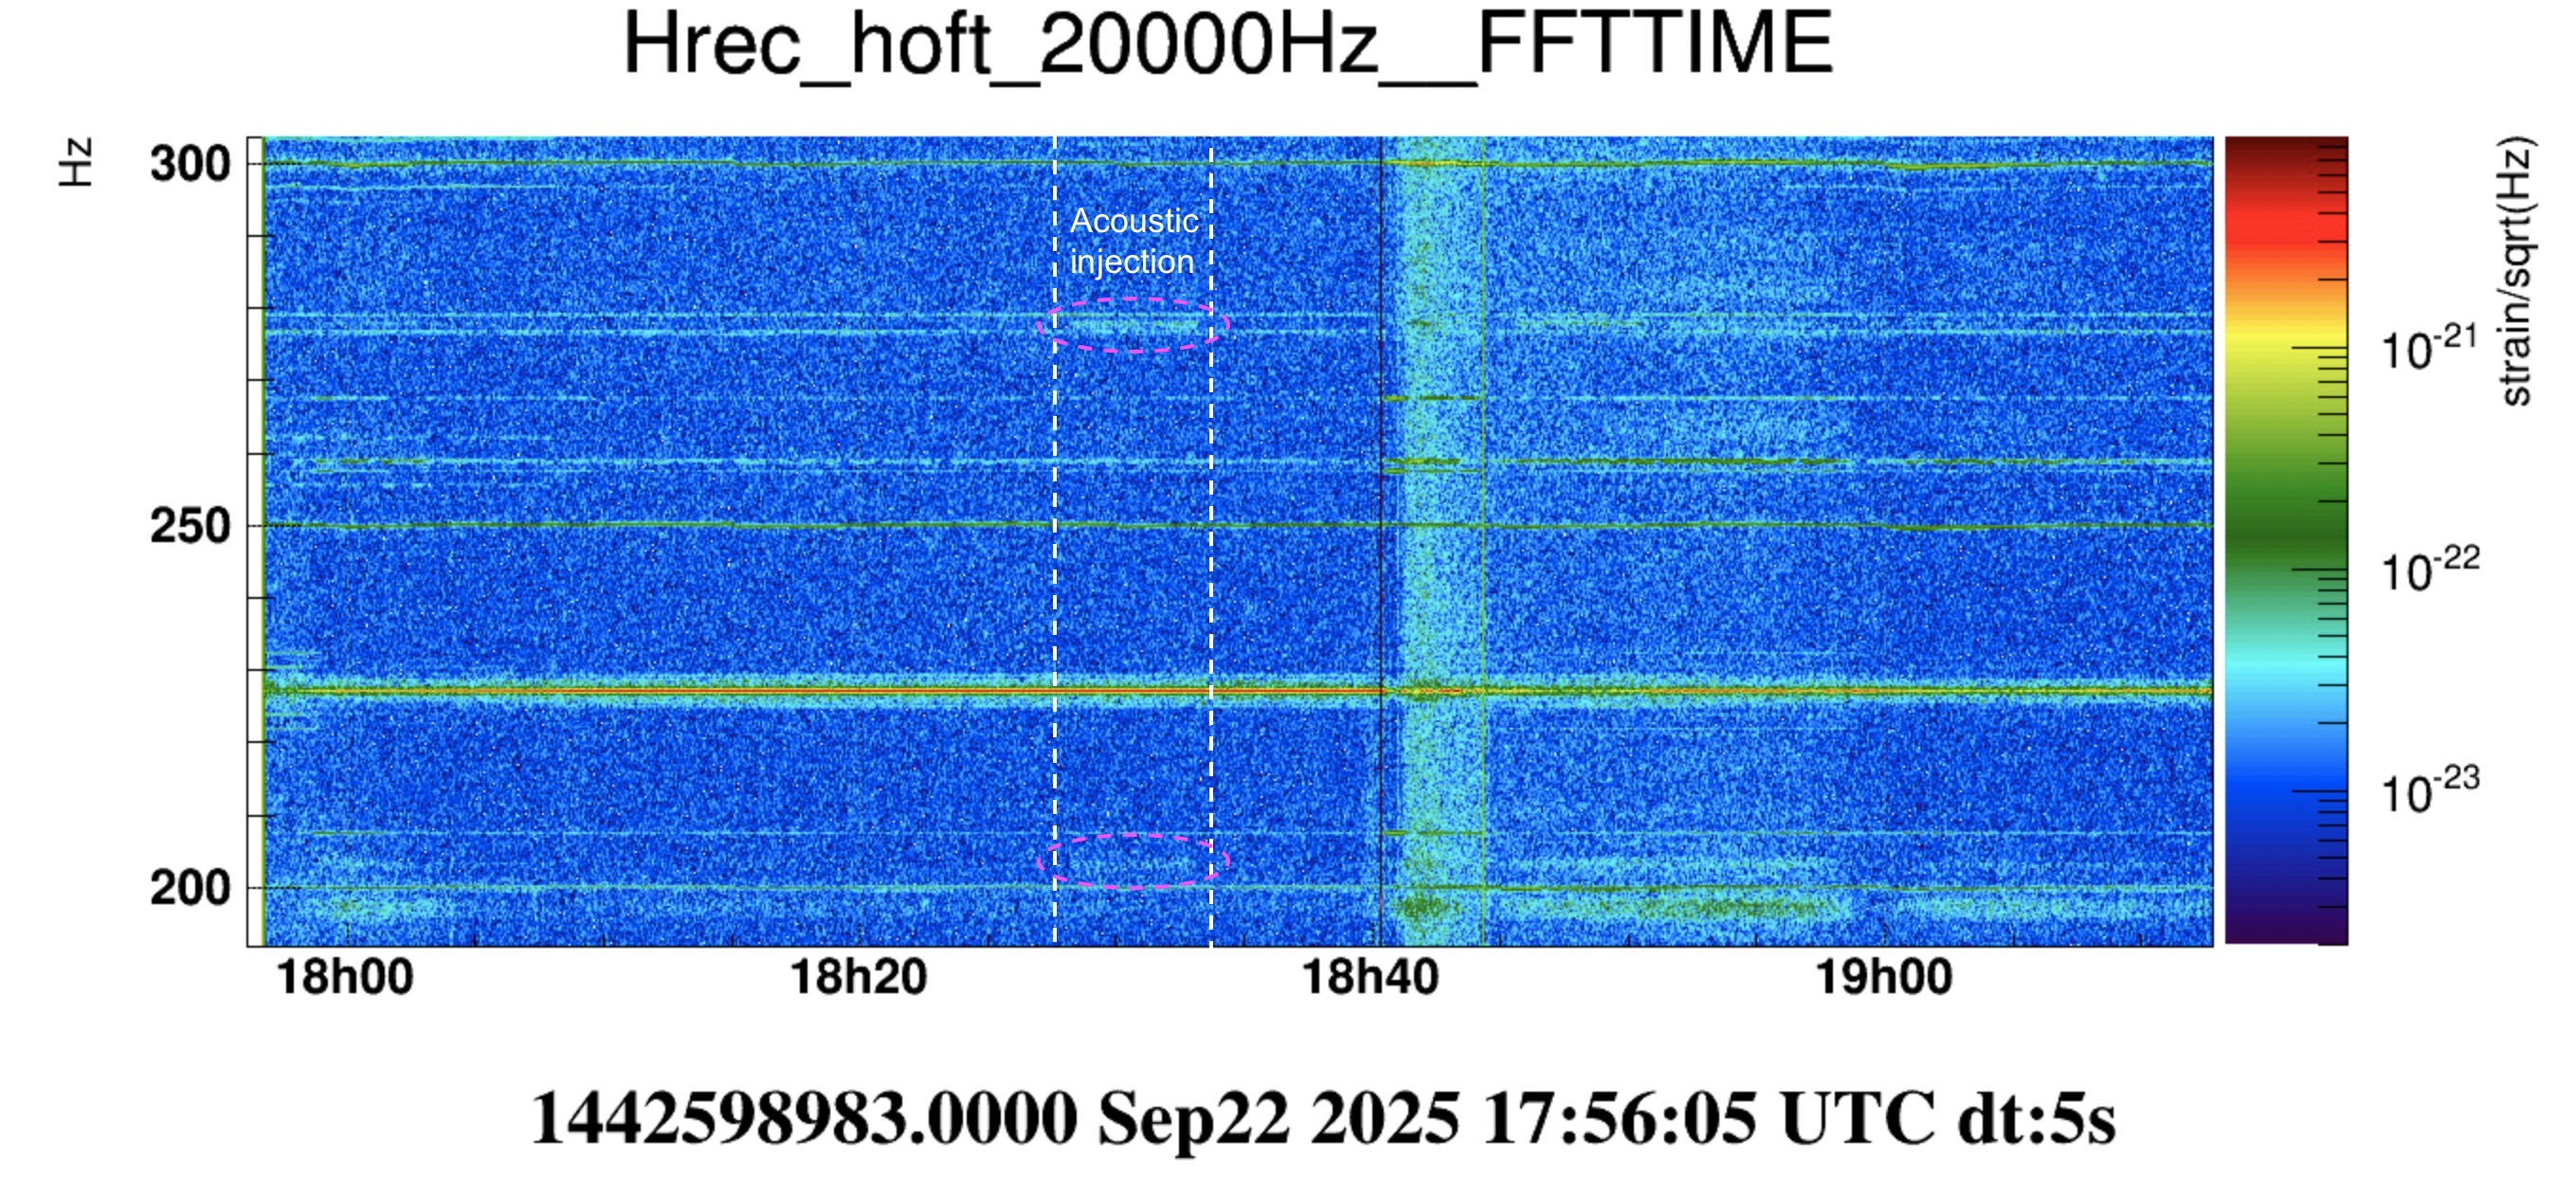
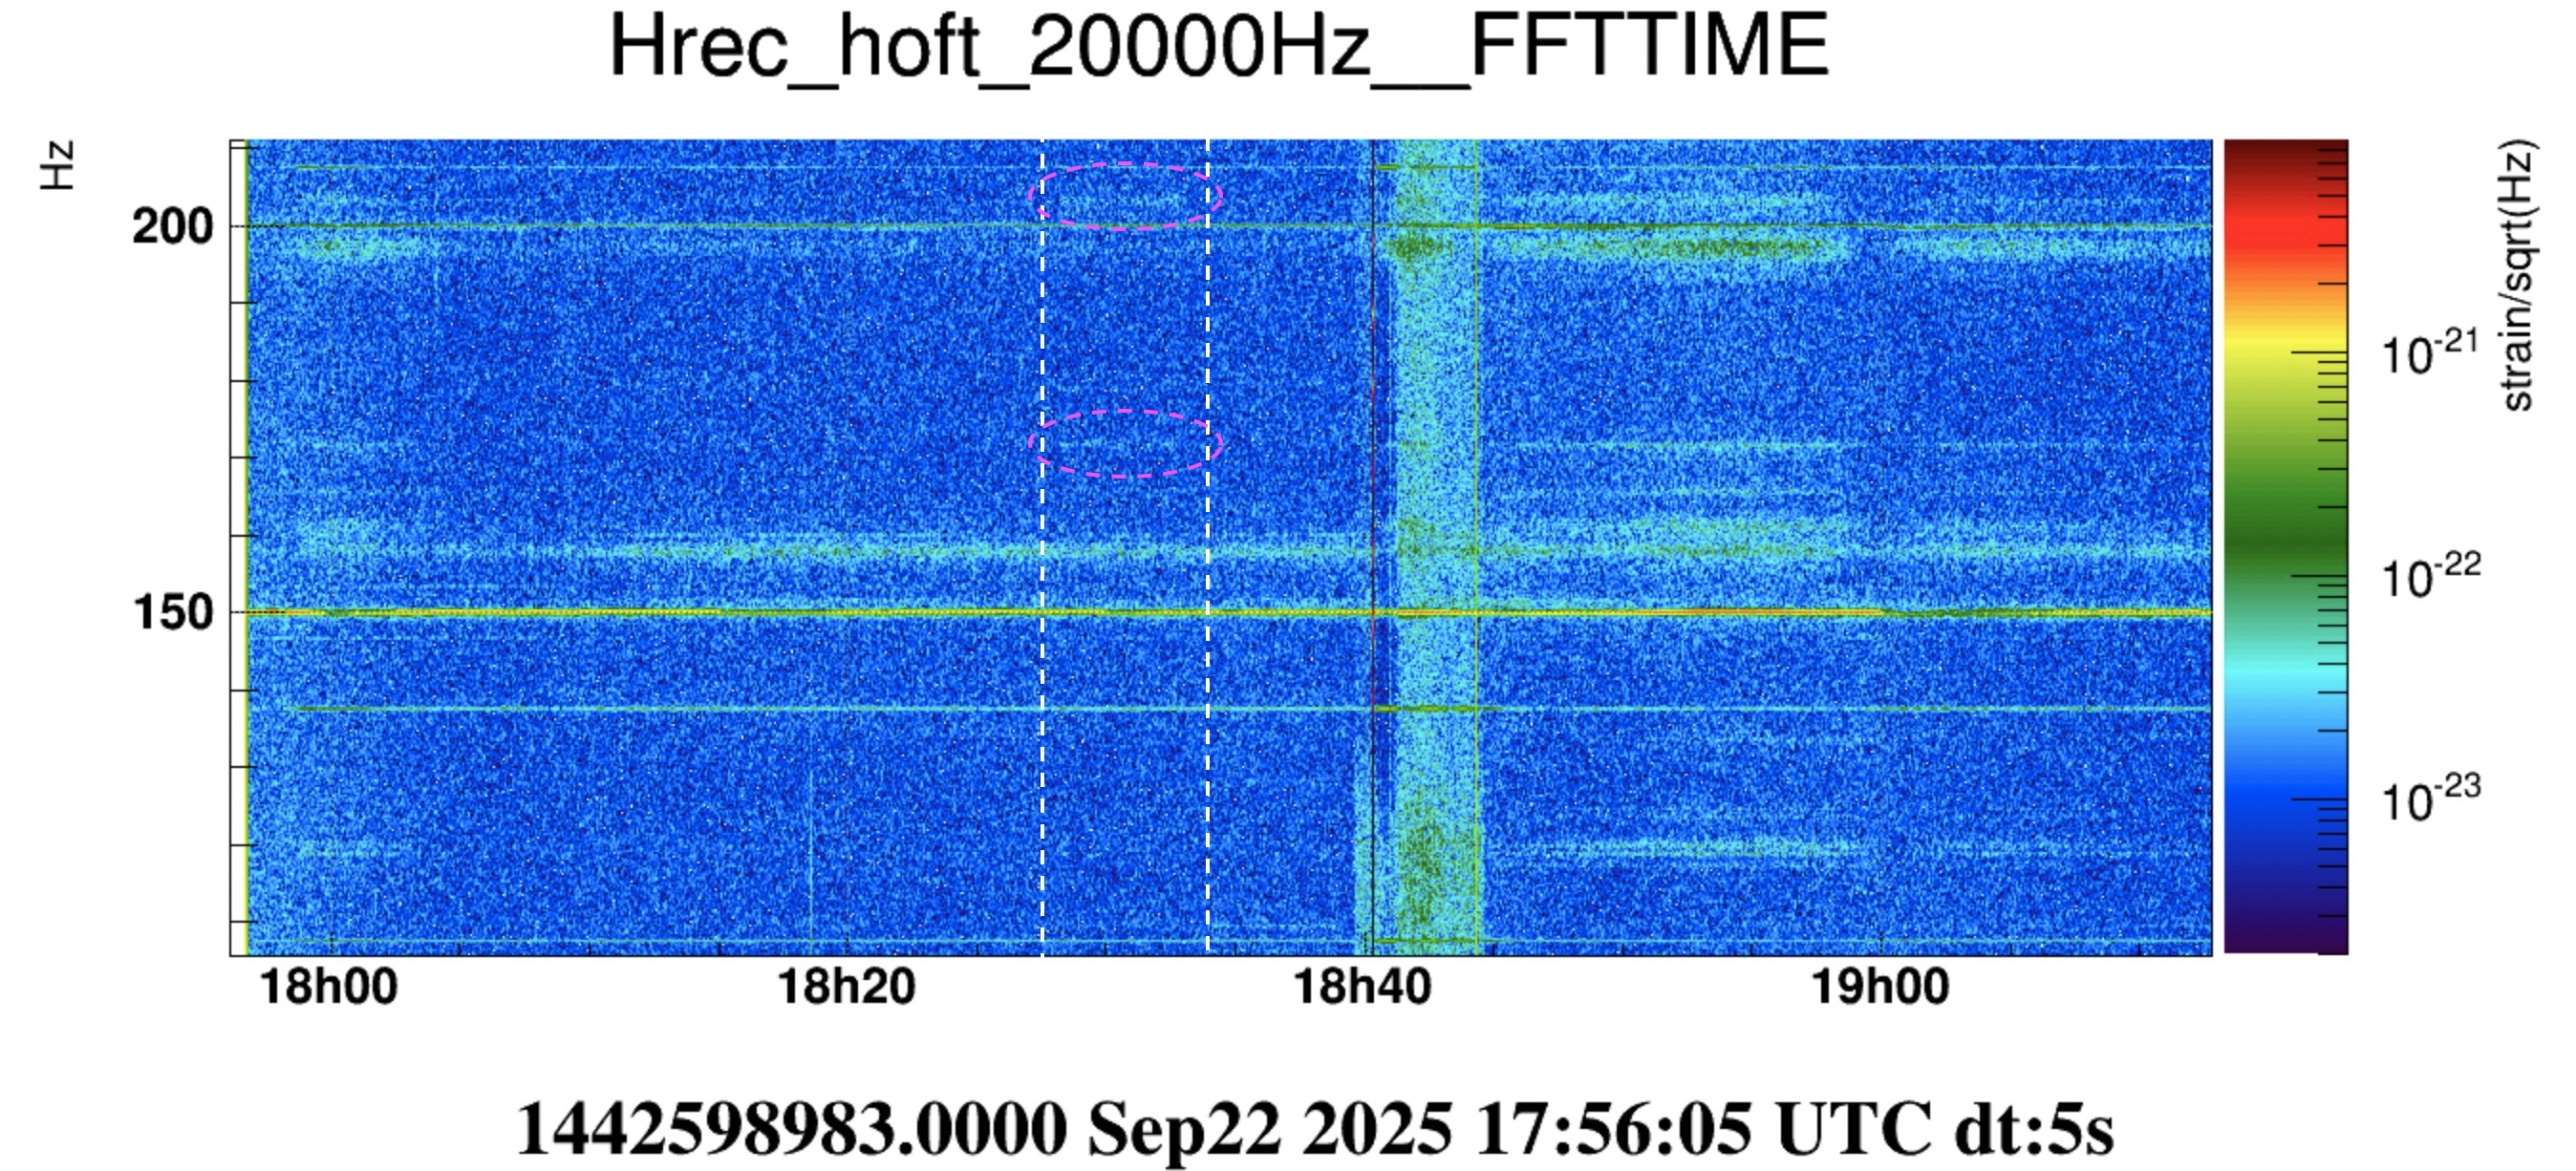
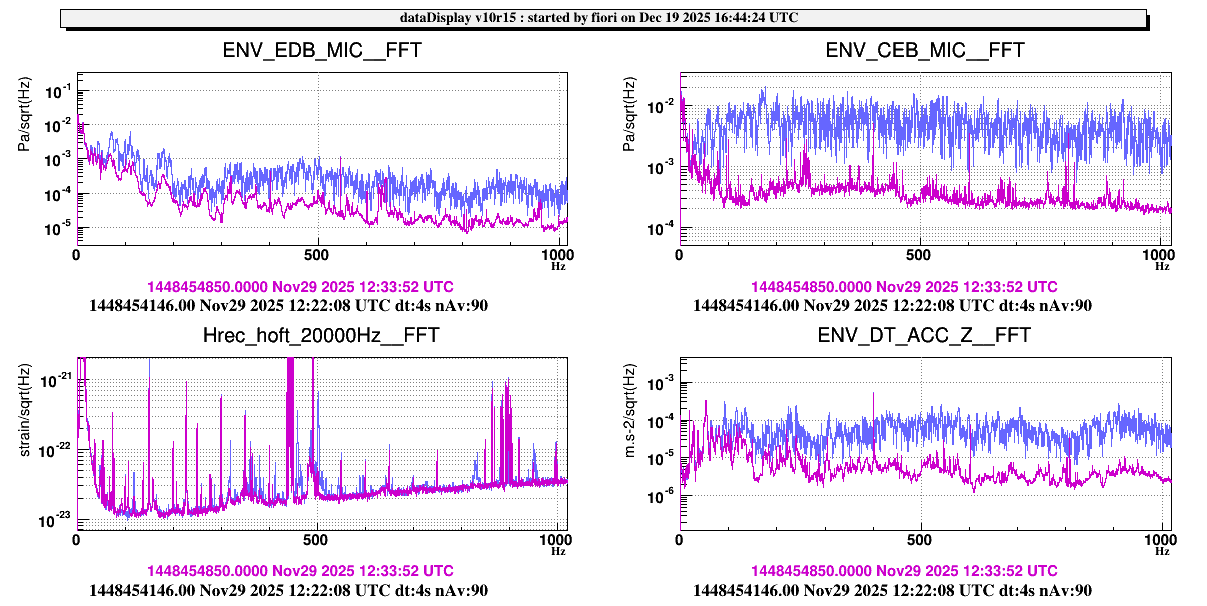
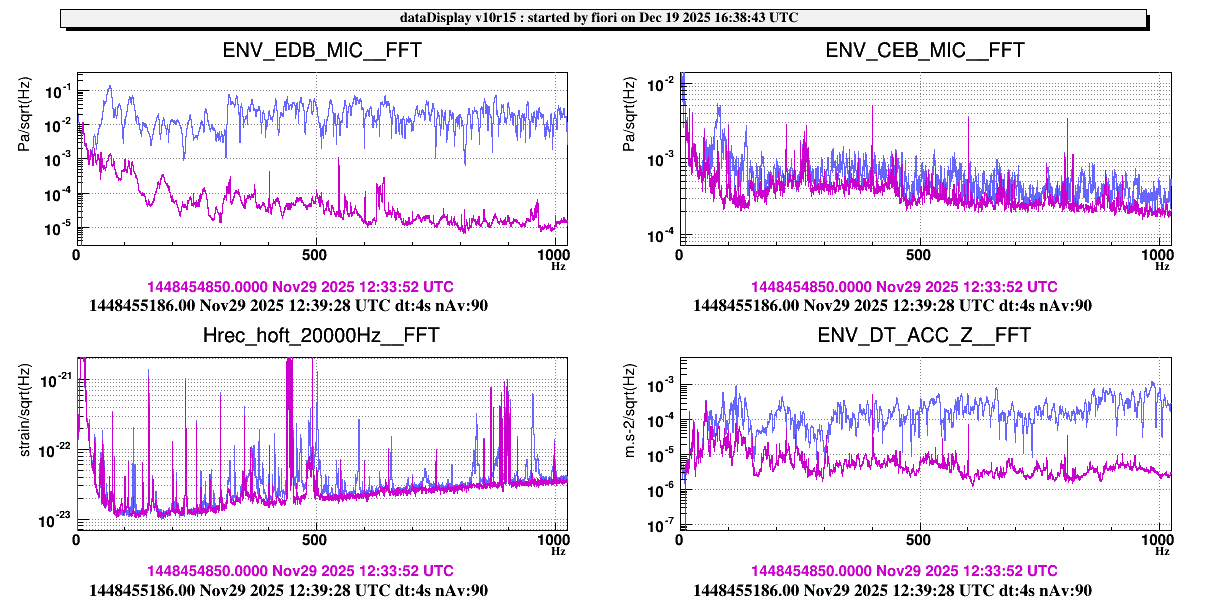
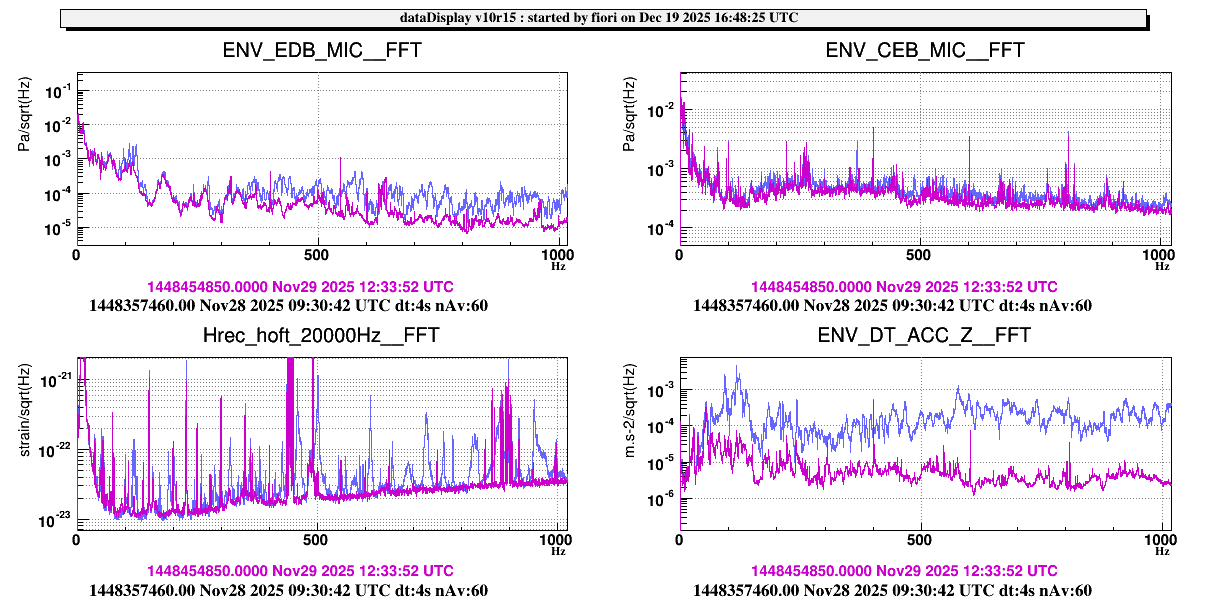
We performed two colored noise injections via ENVnoise process. The first one showed a “strange” behavior, reminiscent of the old-type injection with a spike at the beginning. It is not clear why the first injection did not work properly while the second one did, despite no changes being applied to the setup, see Figure 4. 

Next steps:

  • upgrade the METRATON code for the DET Lab acoustic injection;

  • define the value to be sent to the DAC;

  • power the loudspeaker through a smart PDU.

Images attached to this report
Comments to this report:
Tringali, Fiori, Paoletti - 14:36 Thursday 18 September 2025 (67731) Print this report

During the maintenance (Sept 16), two sets of values were sent to the DAC channel ENV_Noise_CEB_DetLab_speaker_1:

  • First set: 0.1 to 0.5 (step 0.1)

  • Second set: 0.01, 0.03, 0.04, 0.05

Figures 1 and 2 show the injections performed. During the test with the first set, the microphone ENV_EDB_MIC was saturating (see Figure 2). The corresponding acoustic noise generated inside the lab is reported in Figure 3 (mic saturation observed for frequencies < 40 Hz) and Figure 4.

This morning, taking advantage of the ITF in Troubleshooting mode, the DET acoustic injection via the METRATON node was also tested, and it worked properly.

Images attached to this comment
Tringali, Fiori, Paoletti - 14:51 Friday 10 October 2025 (67900) Print this report

The purpose of the shift was to evaluate a set of DAC values without causing an unlock of the interferometer. From the previous measurement #67731, it was observed that for values above 0.1, the microphone started to saturate.
For this reason, yesterday, a series of acoustic injections, each lasting 240 seconds, was performed to test DAC values ranging from 0.01 to 0.1 in steps of 0.01.

Value Time (UTC)
0.01 15:07:02 
0.02 15:17:00
0.03 15:23:54
0.04 15:31:58
0.05 15:38:02
0.06 15:48:56
0.07 15:54:52
0.08 16:00:30
0.09 16:06:46
0.1 16:12:22

The directory path containing the txt files is: /virgoData/NoiseInjections/AcousticInjectionsO4/output/AcousticColored_NOISE_CEB_DetLab_speaker_1-14440*.txt

From a preliminary check, no excited structures are visible in Hrec. A more detailed analysis, including the estimation of the acoustic coupling functions, will follow.

Images attached to this comment
fiori, tringali, paoletti, loche - 18:21 Tuesday 14 October 2025 (67936) Print this report

By comparing the acoustic injection inside the DET lab with that we routinely do inside the CEB hall (loudspeakers on DE Tterrace) it is evident a difference in the excited Hrec peaks: when injecting inside the DET Lab no structure in hrec is excited (just barely a peak at 502Hz) - see Figure 1 - while when injecting with loudspeakers in the Hall a number of peaks arise - see Figure 2. Frequencies are: 502, 460, 469, 412, 383, 371, 278, 203, 172 Hz. 

Figures 1 and 2 compare the injected noise levels of microphone in the hall and inside the DET lab and one accelerometer on SDB1 vacuum chamber. We deduce that acoustic noise inside the DET Lab is not the driver for these peaks. The Vibration noise of the SDB1 is larger (roughly a factor 2 or 3) when injecting from the Hall, so SDB1 chamber vibration might be a suspected path. However, comparing with peaks excited with tappings on SDB1 chamber and viewports/mini-links (done in 2023) we do not find a good match, except for the 502Hz and 172 Hz: https://logbook.virgo-gw.eu/virgo/?r=62759https://logbook.virgo-gw.eu/virgo/?r=62796.

Preliminary conclusion: the excitation path of these peaks is not clear, and would need further investigation.


Images attached to this comment
loche, fiori, tringali, paoletti - 17:19 Wednesday 15 October 2025 (67948) Print this report

To investigate for the possible couplig path, we looked for the coherence of the peaks excited in hrec during the acoustic injection in the hall and several accelerometers within the hall: those on vacuum chambers, TCS benches, and so on.

The first Table concerns the acoustic injection time and it reports in red  shades, for each peak's frequency, the maximum coherence in a +-1.5 Hz window across the peak. The second table, lists the SNR at each peak's frequency, computed as the ratio of the RMS between injection time and quiet time, each RMS is computed over a +-1.5 Hz frequency window across the peak frequency.

The indication is not strong, but some larger coherence is noted for three channels: accelerometers at SDB1 (DT), NI and WI chambers. 

The SNR is a bit larger at SDB1 (DT) and NI which are closer to the loudspeaker (DET terrace). Although not for SR.

Table 3 is the coherence again but computed during a quiet time.   There is no relevant coherence during quiet time.

Figures, one for each peak, illustrate superposed coherences at injection time.

Images attached to this comment
fiori, loche, tringali, paoletti - 17:39 Wednesday 15 October 2025 (67949) Print this report

An insight shows that these peaks are sometimes in hrec, outside of the CEB hall acoustic injection.

Images attached to this comment
Loche, Tringali, Fiori, Paoletti - 14:52 Thursday 16 October 2025 (67957) Print this report

The tables have been updated including additional accelerometers: EIB*, LB*, TCS_NI/WI*, EQB1*, EQB2*, SQZ_PIPE*.  The coherence and SNR values have been recomputed including these channels. Spectra during the acoustic injection and during quiet time have been also added for reference.
The added accelerometers, except those on the EIB and LB, show non-negligible coherence and SNR values.

Images attached to this comment
fiori, tringali - 18:15 Friday 19 December 2025 (68414) Print this report

The conclusion we draw in https://logbook.virgo-gw.eu/virgo/?r=67936 is not correct. Instead, the correct conclusion is that the family of peaks that arise in hrec when injecting acoustic noise in the CEB hall are associated to vibration of SDB1 chamber.

The attached figures show the effect in hrec and noise levels in microphones of CEB hall and inside DT lab (EDB) and vibration of SDB1 chamber during:  one acoustic injection inside the CEB hall (Figure 1), one acoustic injection inside DT lab (Figure 2) and tappings of SDB1 chamber (Figure 3). 

Similar peaks are excited in hrec. Comparing env probes is evident that the driver of the peaks in hrec is the level of vibration of SDB1 chamber.


Images attached to this comment
fiori, tringali - 18:28 Friday 19 December 2025 (68416) Print this report

These figures illustrates details of the peaks that are excited during tappings on SDB1 chamber South flange (data of Nov 28, 9:28:50, 120s - purple curve) and during one acoustic injection in CEB (data of Nov 29, 12:19:10, 180s - green curve).

Note that some of the peaks are also present (small) in the quiet hrec.

In the txt file is a list of the center frequency of these peaks. The "*" indicates that the peak is also seen in quiet hrec, "T" if it is excited by tapping SDB1, "A" if it is excited by acoustic noise in CEB.

Images attached to this comment
Non-image files attached to this comment
Search Help
×

Warning

Error

The present report has been modified outside this window. Please check for its integrity in the main page.

Refreshing this page will move this report into drafts.

×