These are the best noise budget I could achieve for the data of July 24 during the latest IPATSiA test. In each case using the last 10 minutes of data of a given state of IPATSiA, in order to avoid the initial few minute transient from turing the power of IPATSiA on or off. The best shape to fit all the data had a slope of 1/f^0.55.
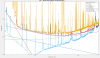
Figure 1 shows the noise budget for the first position (with 40mW of power)
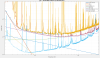
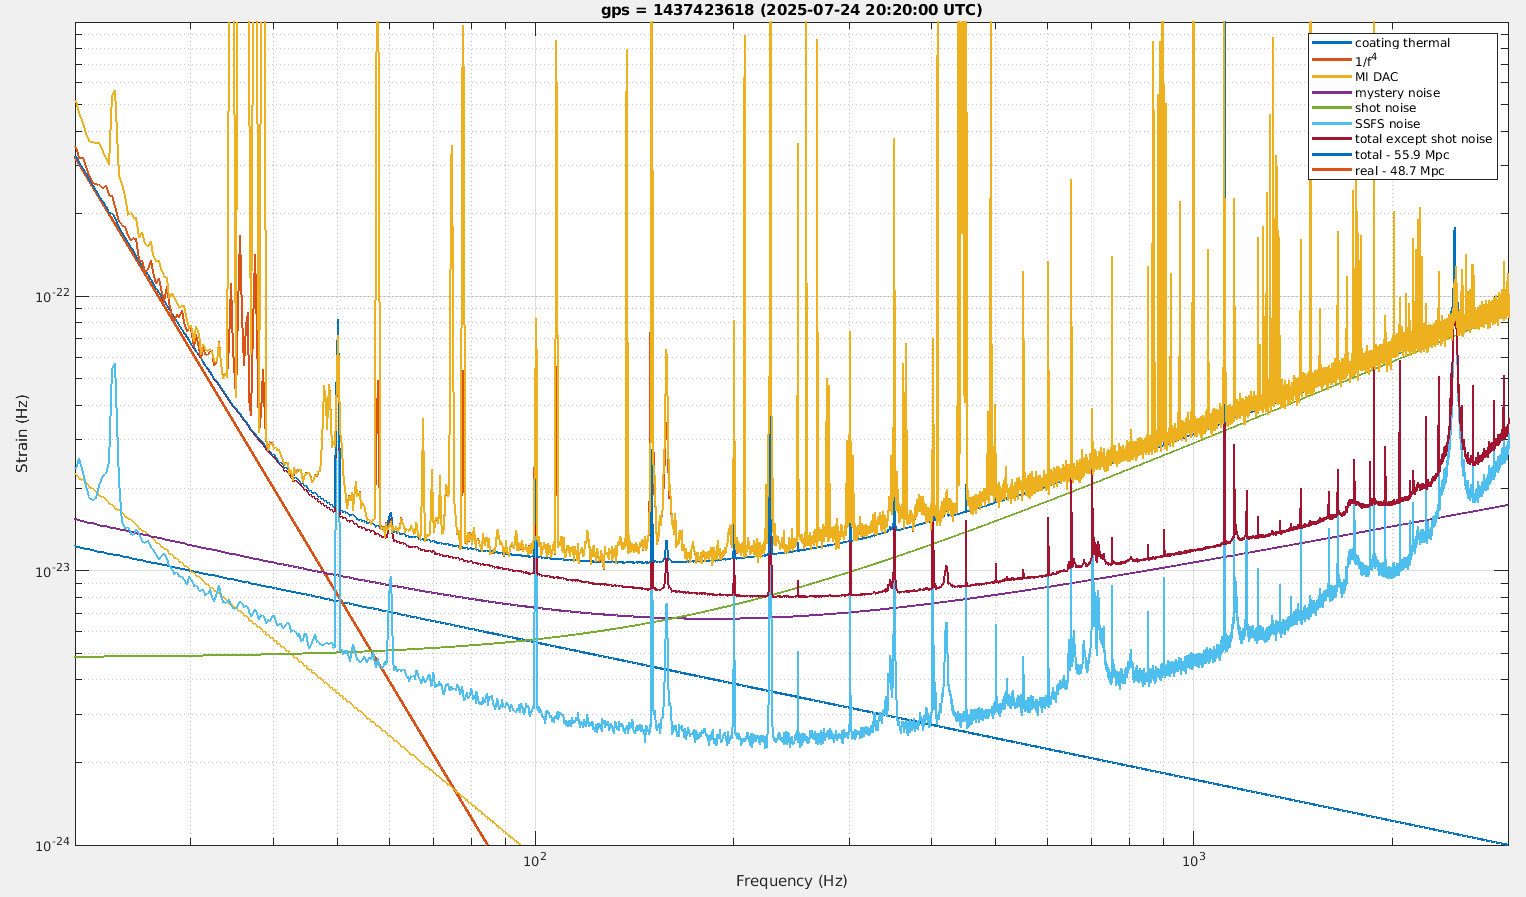
Figure 2 shows the noise budget for the second position.
In both cases the plotted mystery noise level is the same, and it is 10% higher than in the case of LN2 data with IPATSiA off.
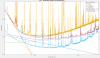
Figure 3 shows the noise budget for IPATSiA that was taken in between the two times shown in figure 1 and 2
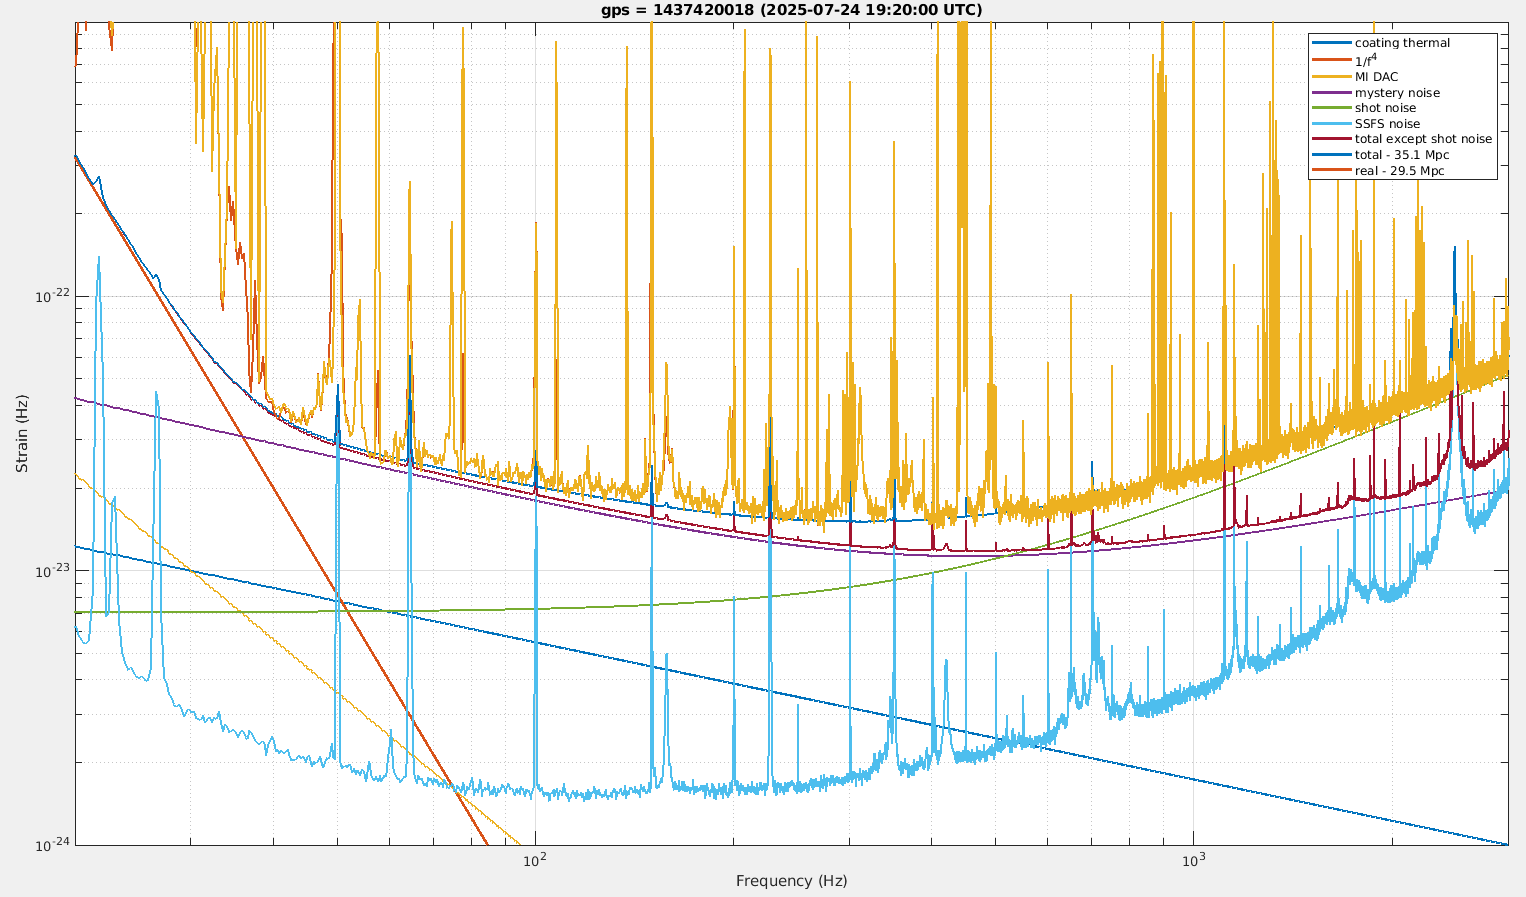
Figure 4 shows the noise budget for one hour after the IPATSiA test, with the interferometer back in LN3. Where the mystery noise is a factor 1.7 lower in terms of mW/rtHz, as expected from the change in HOM signal recycling gain.
