I investigated the glitch waveforms to check if similarities are present that may allow us to identify clusters of similar glitches, also trying to answer the question whether the shape of the new glitches is always the same, there is a random phase, there are multiple families, etc.
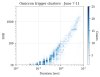
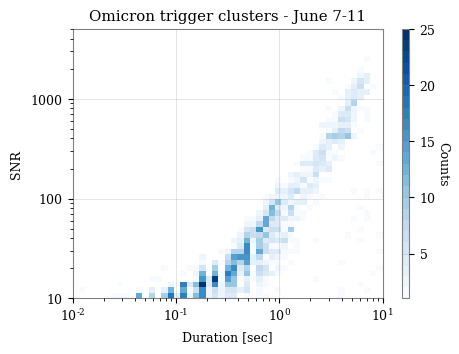
As a first step, I attempted to replicate the clustering approach from entry #66013 using only the Omicron trigger parameters (e.g., SNR, duration, central frequency). This approach did not yield clearly identifiable clusters. The issue is that parameters like SNR and duration seem to span continuous values without forming isolated regions in the Omicron parameter space. For example, Figure 1 shows a 2D histogram of glitch durations and SNRs recorded between June 7 and 11; although the line at SNR ~400 corresponding to the 25-minute glitches is faintly visible, it already does not constitute a distinct, separable group.
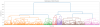
To better capture glitch morphology, I instead performed clustering directly on the whitened time series corresponding to Omicron glitch triggers with SNR > 100, yielding a total of 891 glitches between June 4 and 11 during DQ Studies mode. I applied hierarchical clustering using Pearson correlation as the distance metric (specifically, 1 - Pearson correlation). This method captures waveform shape and phase similarities while being insensitive to amplitude. The clustering procedure followed the method described here and in arXiv:1109.2378v1. The result is shown in Figure 2 as a dendrogram, where each leaf corresponds to a time series and the y-axis indicates dissimilarity. Branches connect waveforms that are more similar, and colors represent the identified clusters.
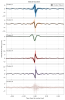
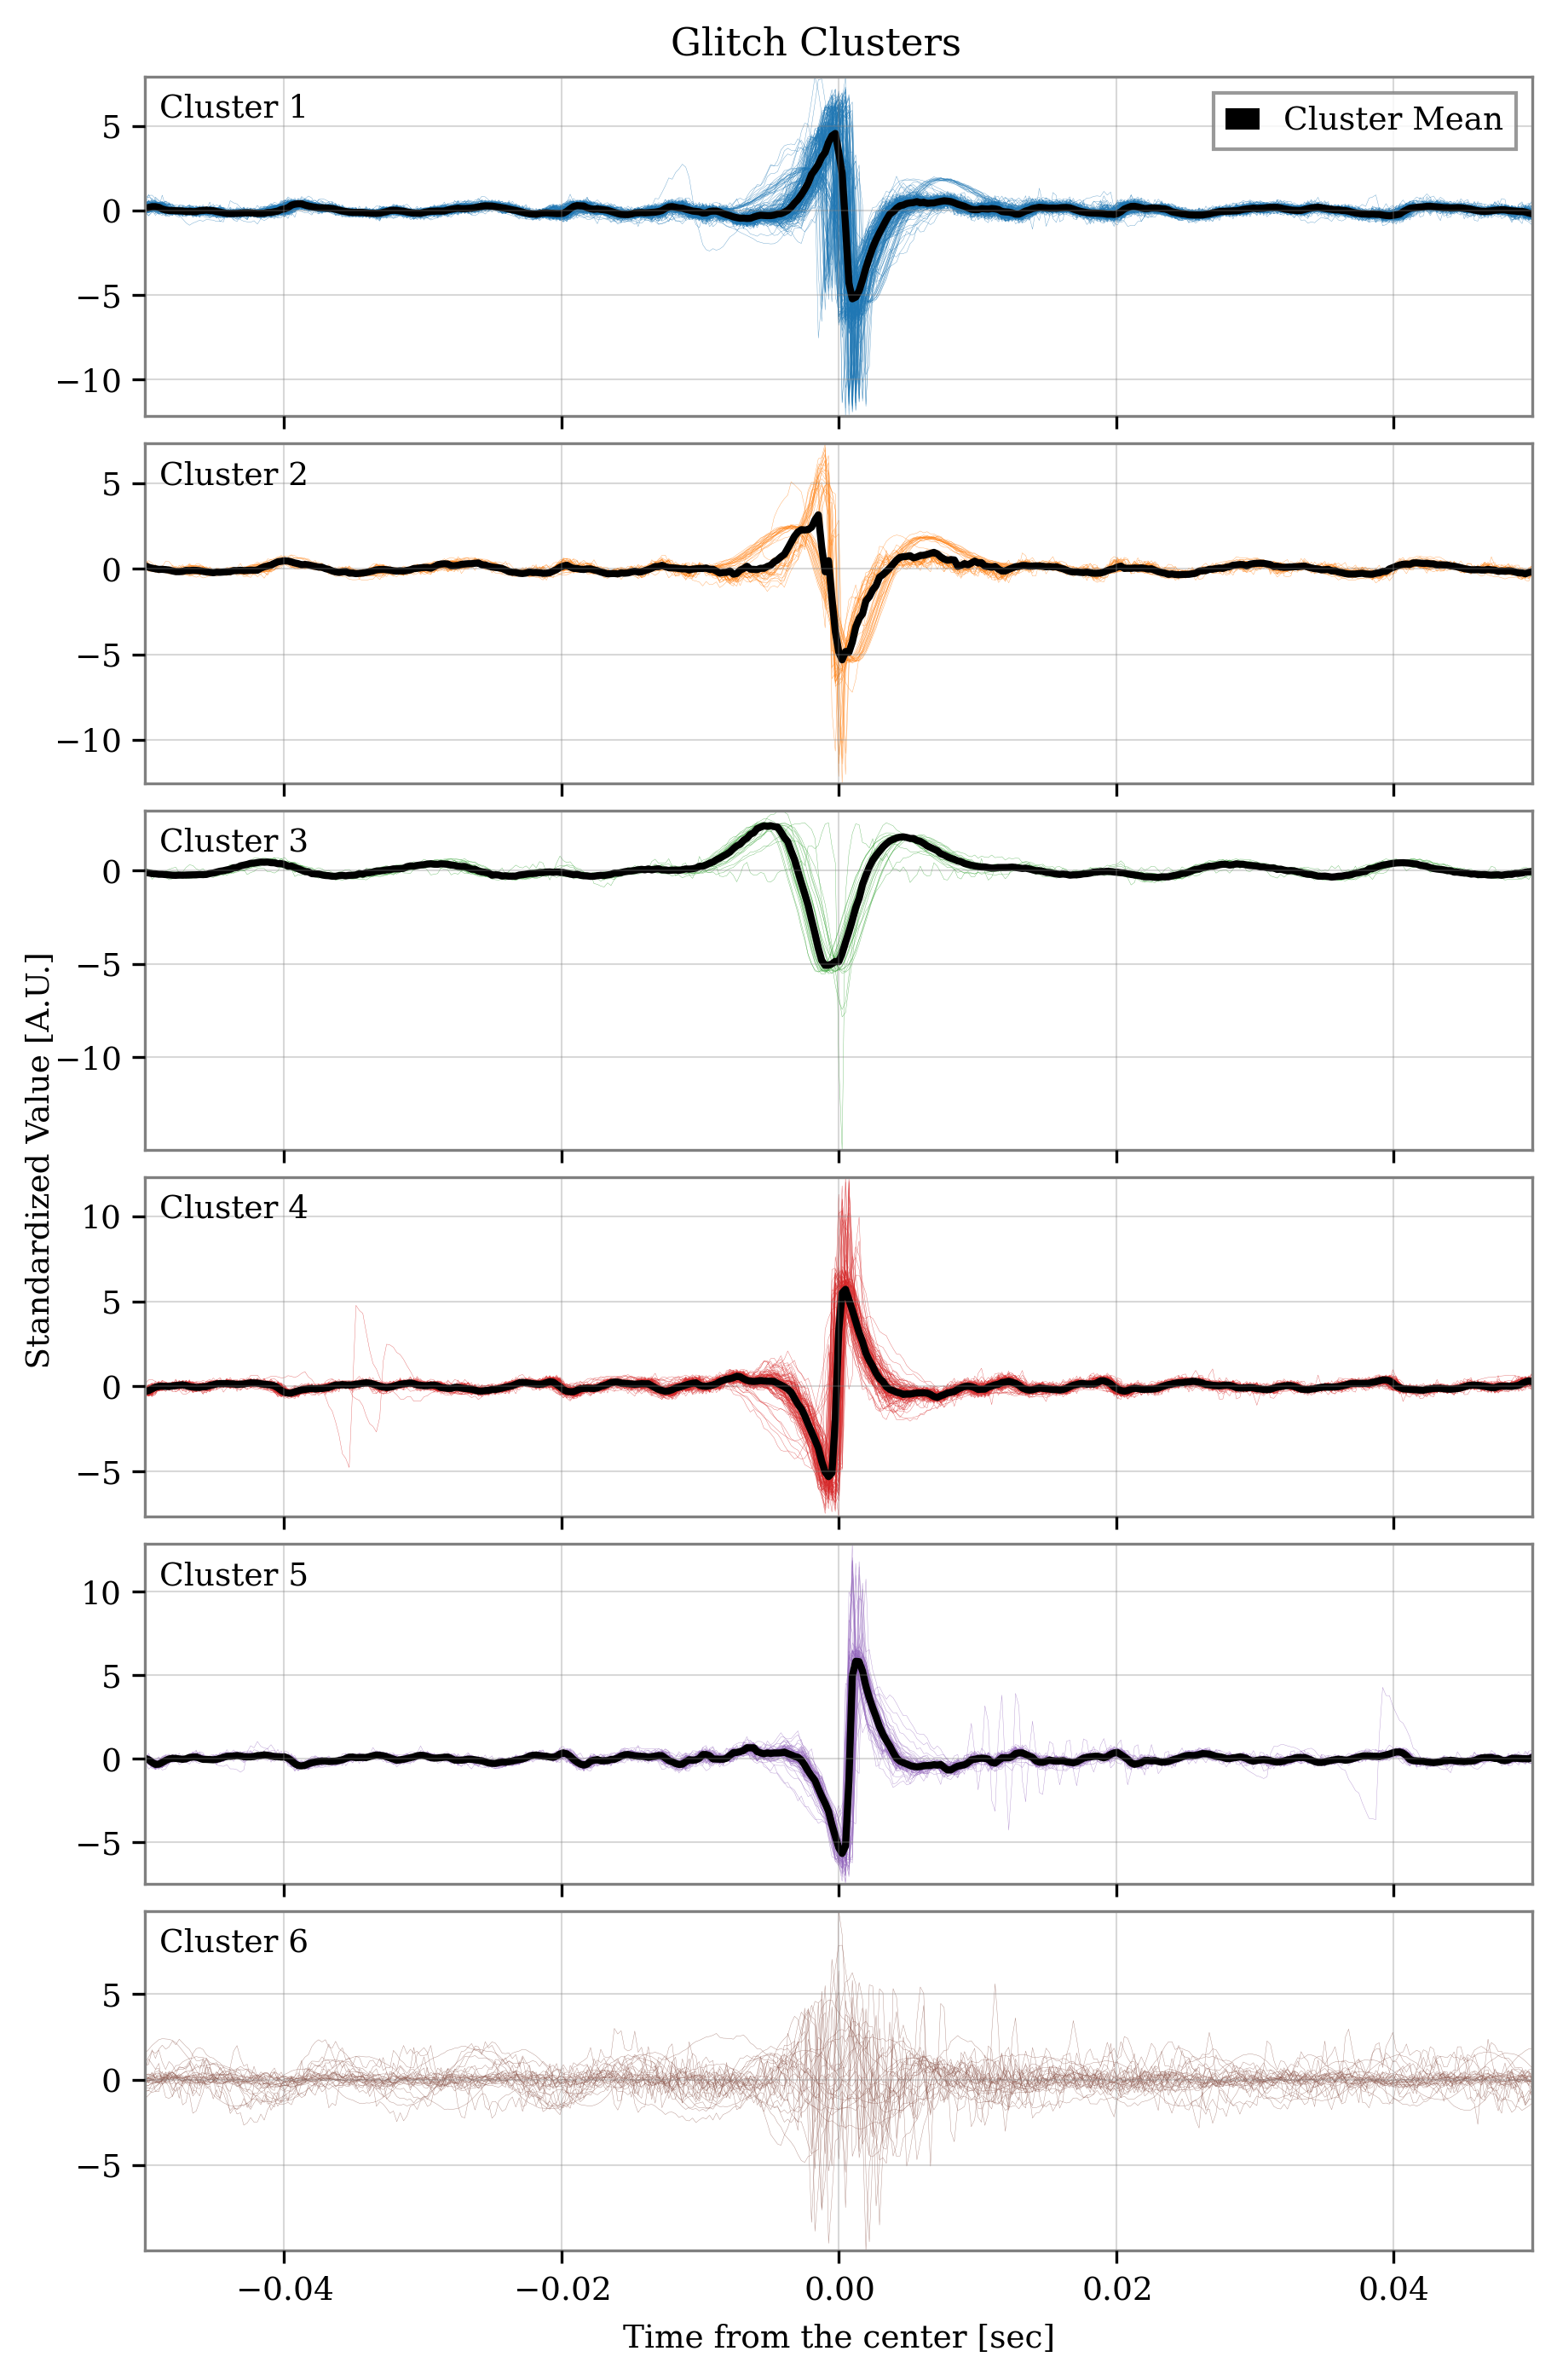
In Figure 3, I show the standardized time series for each cluster. The percentage of glitches across clusters is as follows: 41.44%, 8.95%, 4.86%, 23.74%, 15.37%, and 5.64% respectively. Clusters 1 and 2, and clusters 4 and 5, contain morphologically similar glitches that appear to differ by a phase of approximately Pi. Cluster 3 corresponds to the 25-minute glitches, while Cluster 6 contains a heterogeneous set of waveforms without a clear common structure. This suggests that the majority of glitches can be grouped into two dominant waveform types (each appearing with a phase shift), along with a third, distinct 25-minute glitch class, and a residual miscellaneous group.
I attach a CSV containing the GPS timestamps, center frequencies, and assigned cluster labels for all glitches.
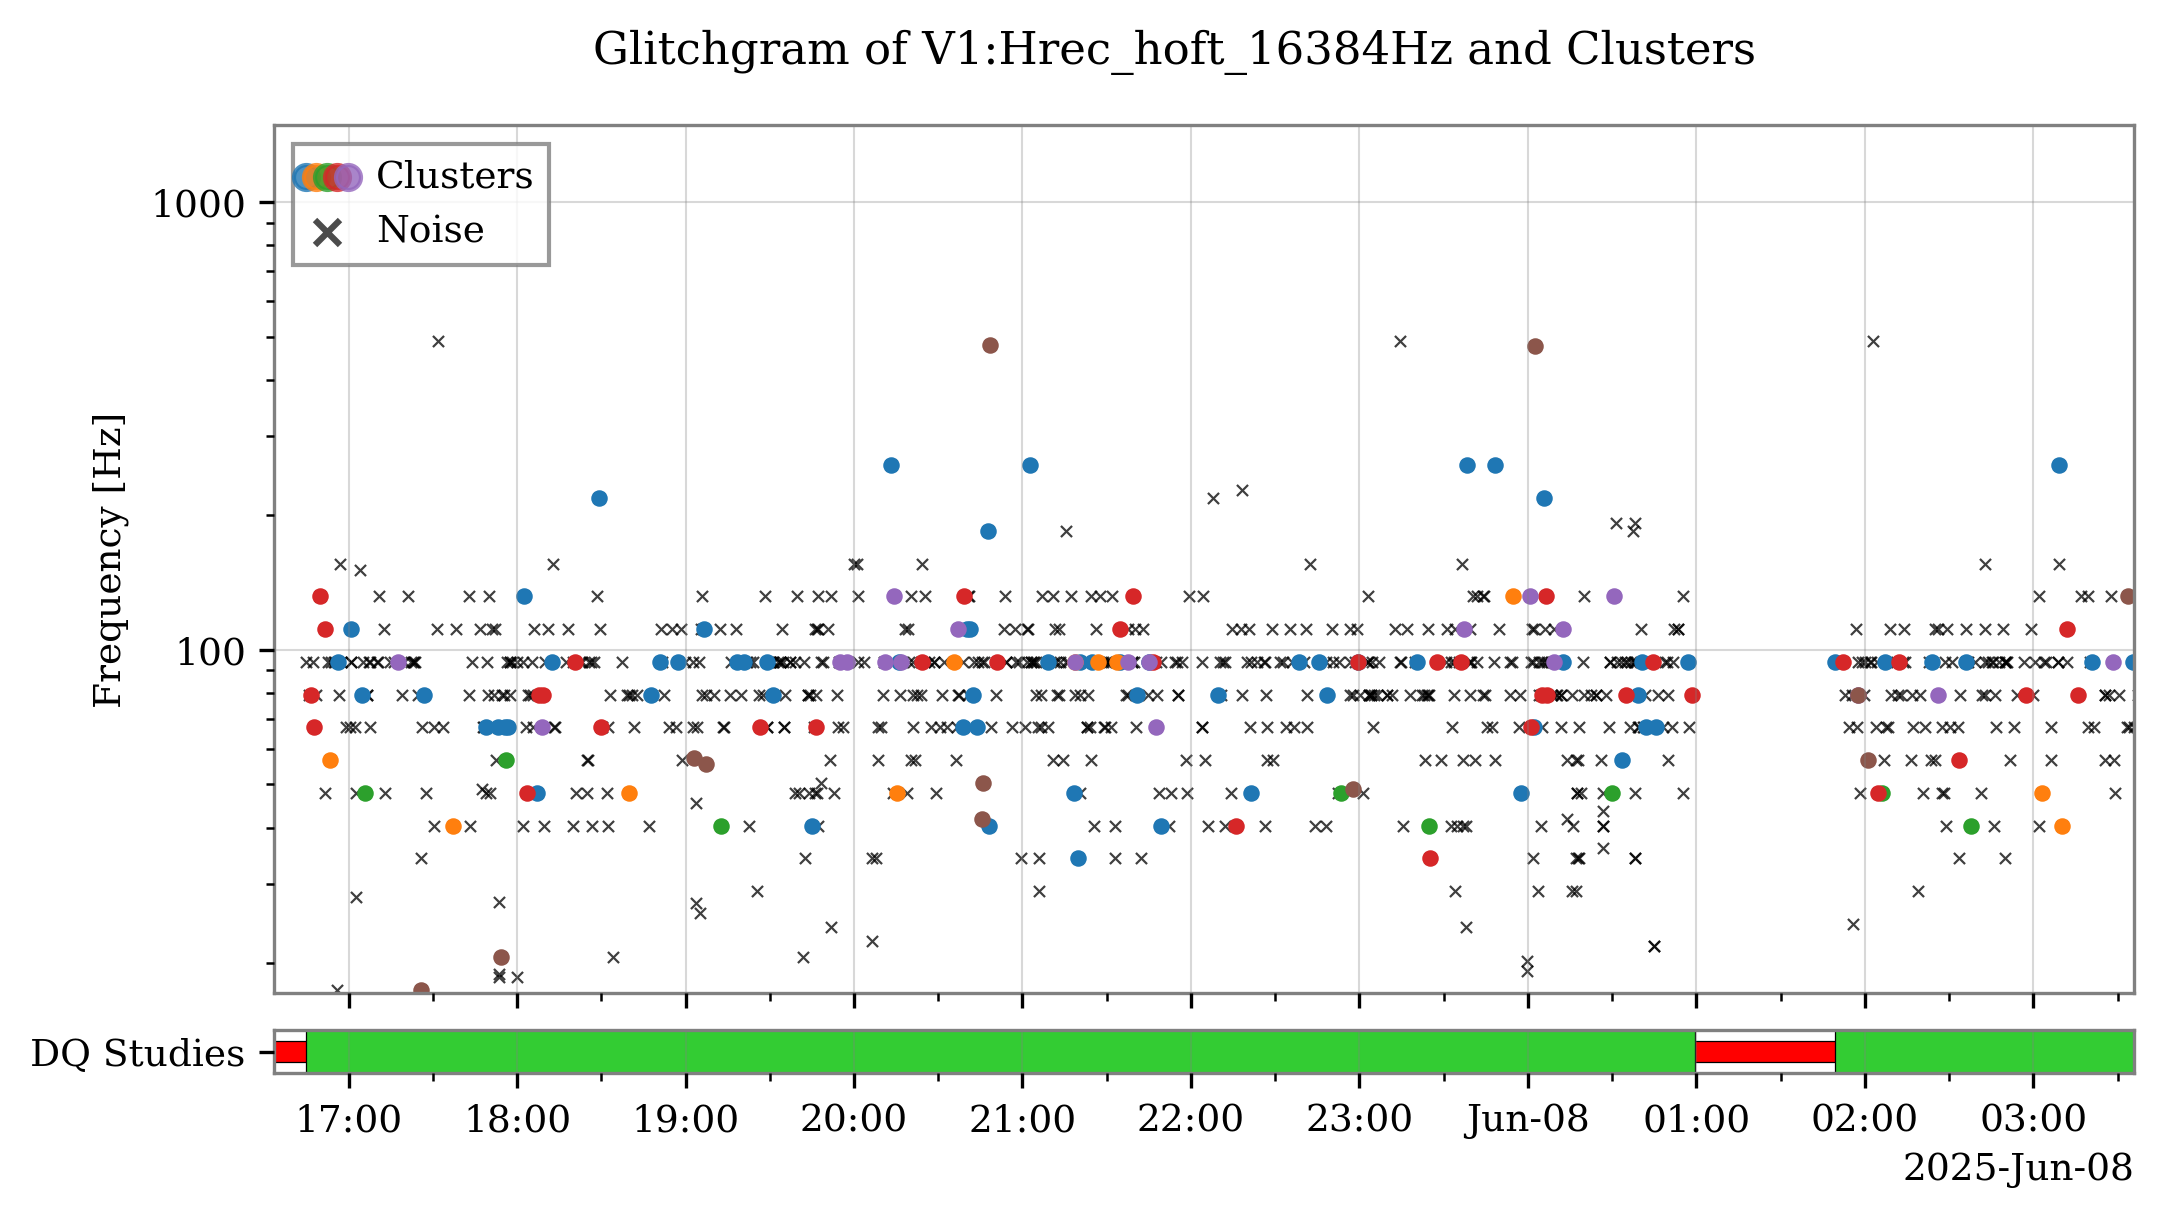
Figure 4 shows a glitchgram for the long segments in the DQ Studies mode between June 7 and 8, with each marker colored by its cluster assignment. As anticipated, the result is visually complex and does not reveal a clearly separable temporal or frequency structure among the classes.
