From the UPV results, I couldn't find correlations with the (safe) SDB2_B1_* channels. The channels tested with UPV+VetoPerf are listed in the attached TXT file. However, I explored this possible relationship using a different approach, which I will describe in detail below.
To complement the primary visual identification of glitch families described in #66010, I applied clustering algorithms to the glitch triggers identified by Omicron during this time frame. Specifically, I used the DBSCAN - Density-based spatial clustering of applications with noise algorithm, an unsupervised clustering method that groups data points based on their density in the parameter space of Omicron triggers.
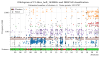
For this analysis, I selected triggers with SNR > 10. The classification results are shown in the glitchgram in Figure 1, where different colors represent the glitch families identified by the algorithm. While the clustering is not perfect, and the choice of glitch features and hyperparameters was not optimized or cared in detail, the results align with the observations described in the original post. In particular:
- The 25-minute glitches are clearly identified (brown markers).
- Scattered light is recognized as distinct families in the correspondence of recent days of bad weather (blue markers).
- THe high-frequency glitches of the last days are identified, whose rate has significantly increased since January 19, as previously reported (orange and, possibly, red markers).
- Other intermediate-frequency glitches are recognized, although less distinctly (purple markers).
- Crosses correspond to triggers not classified by the algorithm and are therefore identified as "noise."
This clustering analysis confirms the visual classifications in the initial post and provides additional insights into the structure and onset of the glitch families.
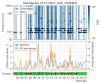
Focussing on the "purple glitch family," these are characterized by very large SNR and frequency at peak in the bucket. Therefore, to study the relation with the B1 saturation, I selected glitch triggers with SNR > 300 (and frequency at peak >90 Hz, although not necessary to further restrict the selection). The selected glitches are shown in the gitchgram in Figure 2. I compared the GPS times of these glitches with the times where the B1 saturation flag was active, represented by the vertical lines. Blue vertical lines correspond to times when this flag was active and fell within a delta_t of 2 seconds from the selected high-SNR glitches. Gray lines correspond to B1 saturations not corresponding to the previous glitches. The result doesn't change significantly by increasing the delta_t up to some tens of seconds (the lower limit is given by the resolution of trend channels).
Comparing blue and grey lines, using a minimum SNR threshold of 300, 68.59% of the high-SNR glitches have a flag nearby. These are the percentages obtained by changing the threshold:
| SNR threshold | Coincidence [%] |
| 100 | 57.60 |
| 300 | 68.59 |
| 500 | 74.9 |
| 1000 | 70.32 |
In the central panel of the same image, I reported the hourly rate of high-SNR glitches and B1 saturations. There seems to be a clear correspondence between the two curves. These results support the hypothesis by Michal that high-SNR glitches are associated with saturations of the B1 photodiode.
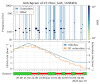
In Figure 3 I report the detail of a day with many high-SNR glitches and many B1 saturations.