Reports 1-1 of 1 Clear search Modify search
Detector Characterisation (Glitches)
direnzo - 0:15 Tuesday 04 March 2025 (66288) Print this report
Further Investigation of Loud Glitches in the Bucket

Previous studies have identified a population of very loud, broadband glitches with peak frequencies in the bucket region (50-200 Hz):  #66013, #66072, and #66152.
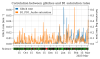
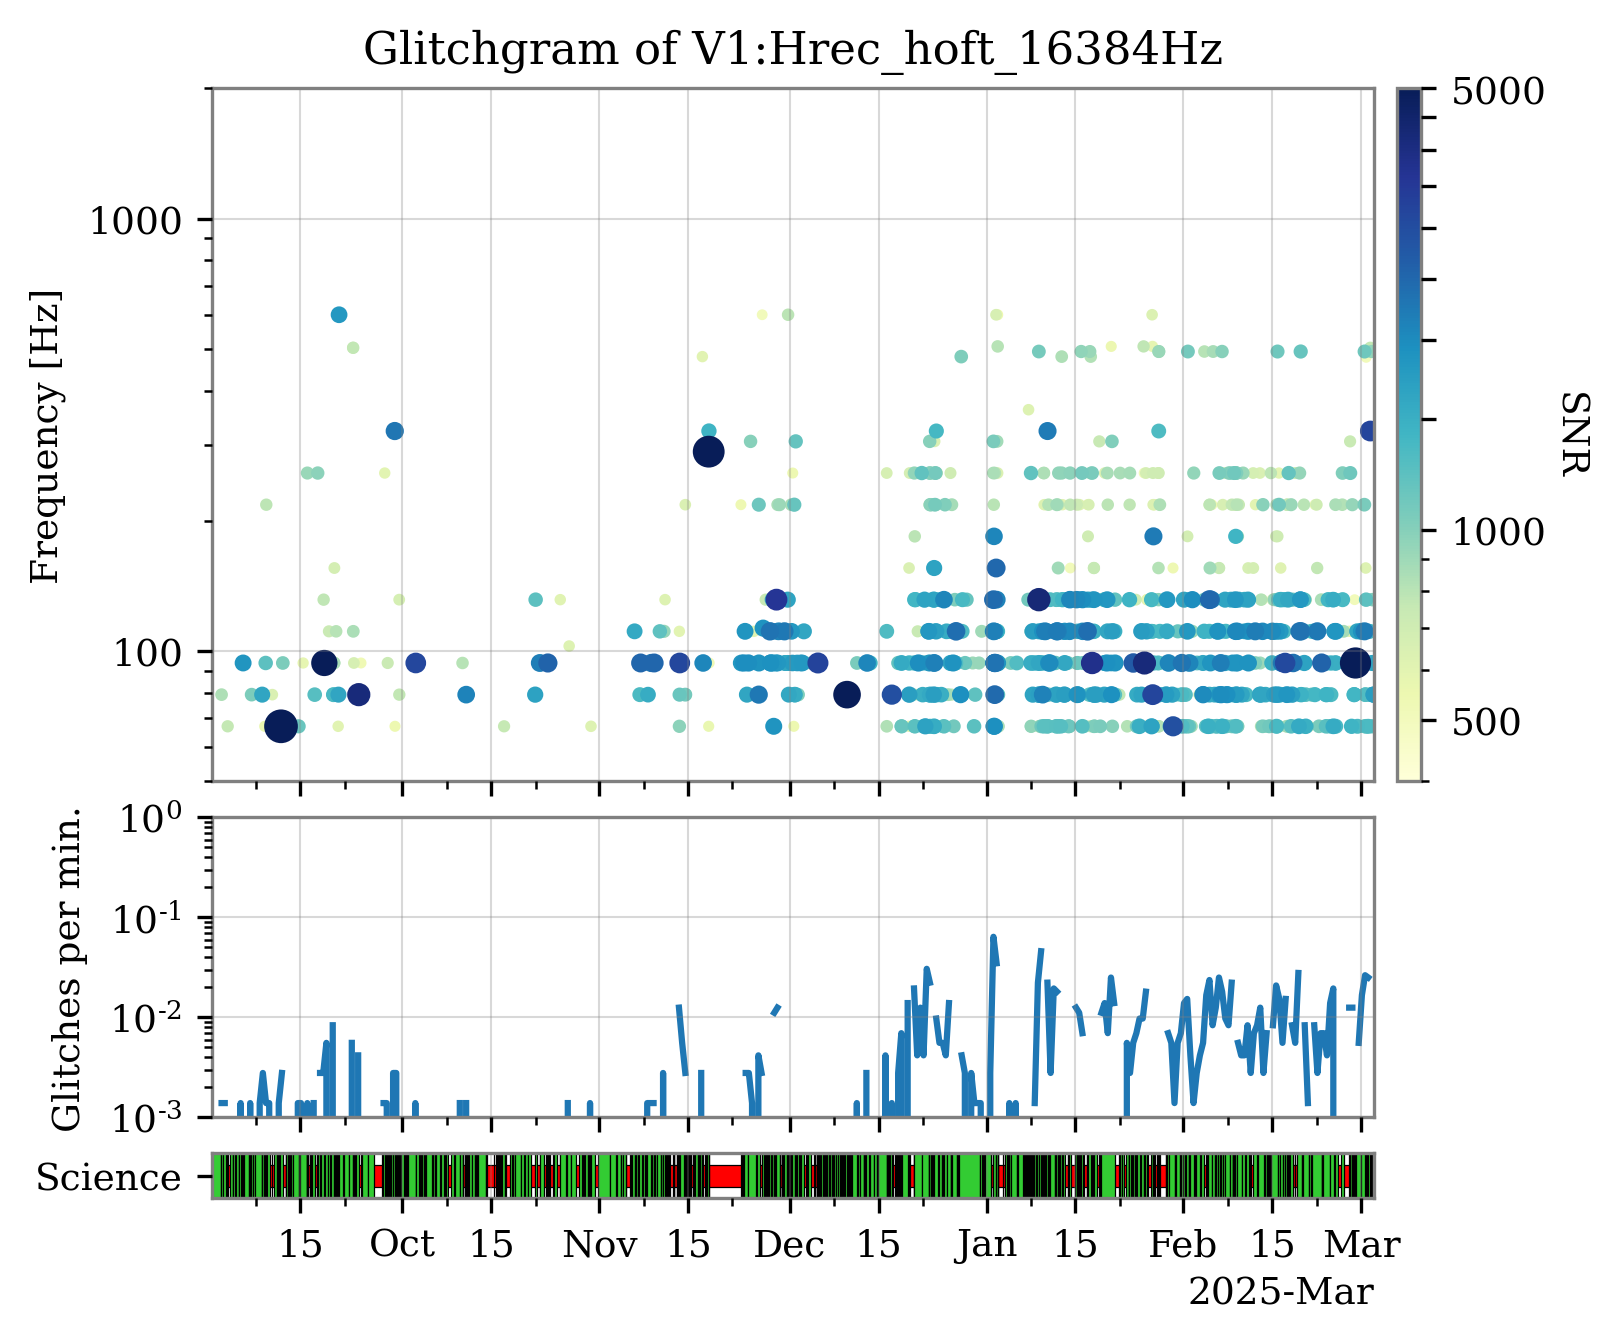
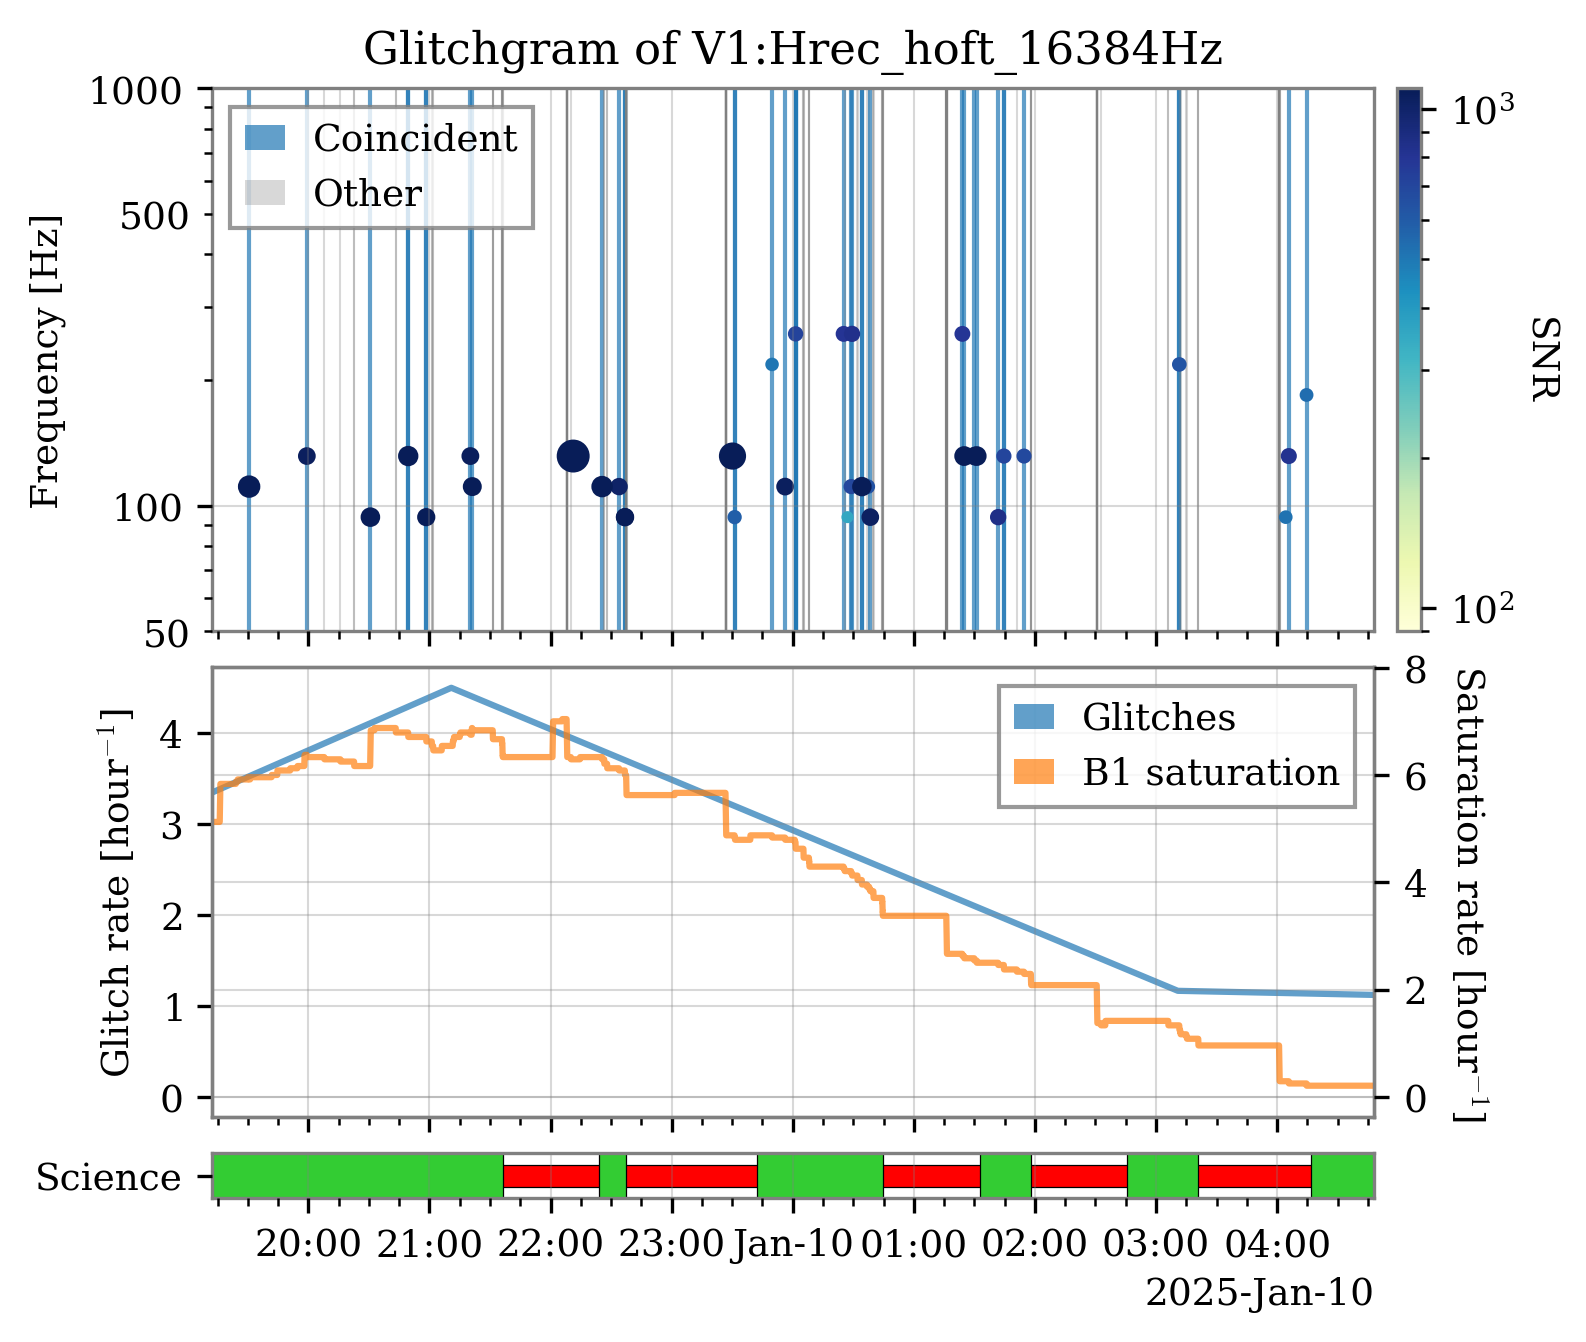
To determine when these glitches first appeared, I filtered Hrec Omicron triggers from September using the following criteria: SNR > 500 (as already discussed in #66013), bandwidth > 200 Hz, and peak frequency above 60 Hz.

Figure 1 presents a glitchgram of the above triggers since September 1 2024, showing a clear concentration of high-SNR glitches starting in December. The bottom plot shows their occurrence rate.

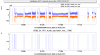
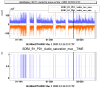
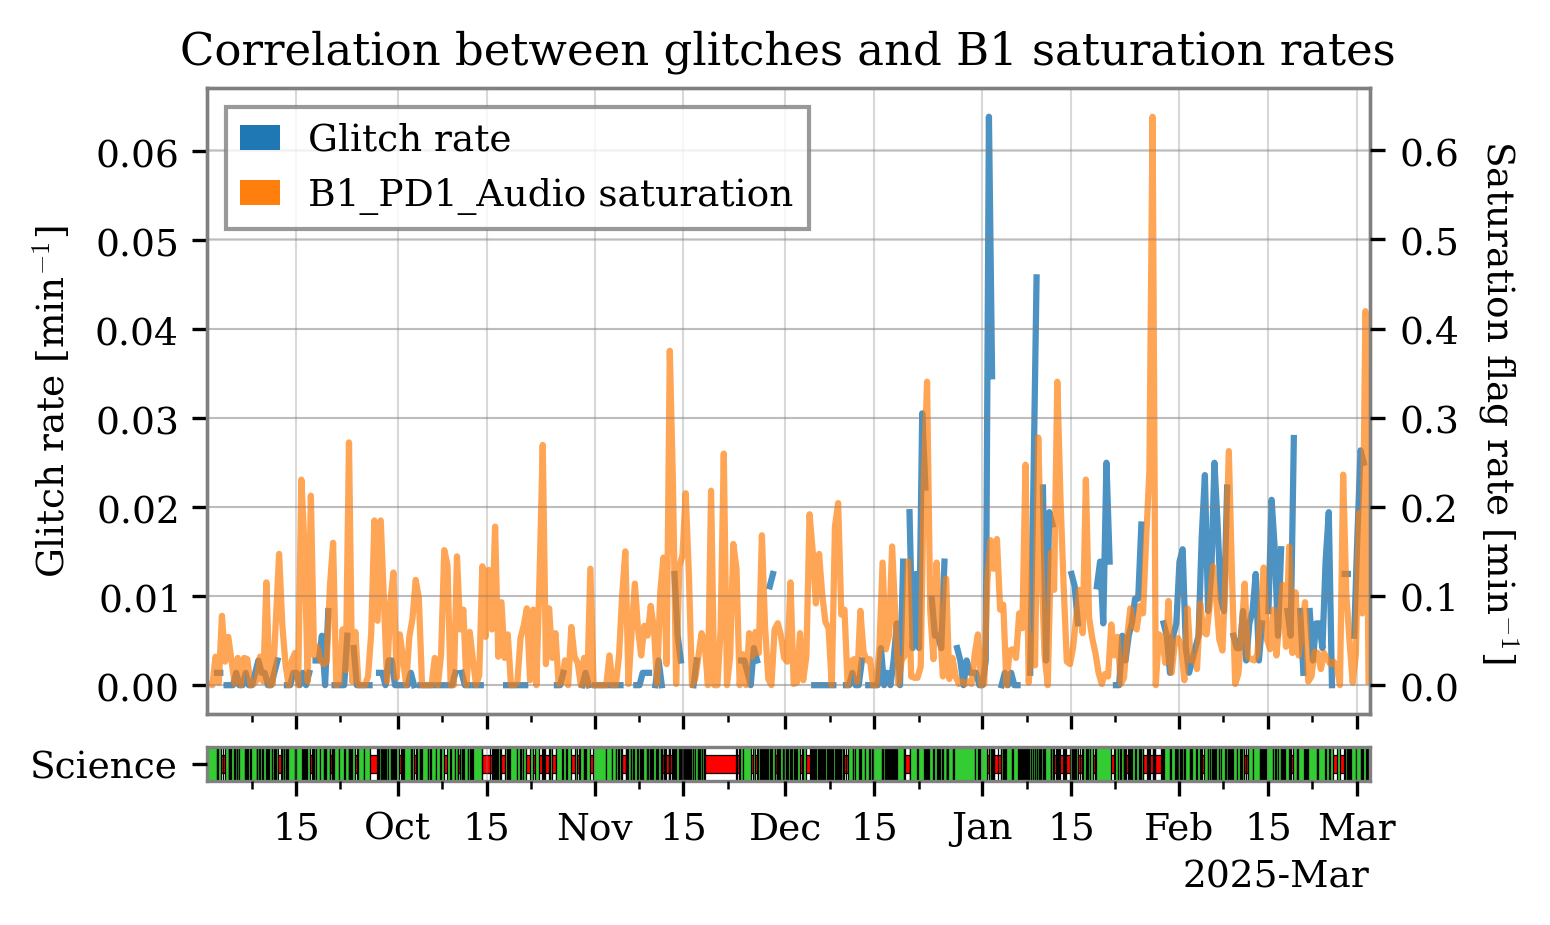
Figure 2: These glitches were found to correlate with the saturation of B1 photodiode PD1, as represented by the channel V1:SDB2_B1_PD1_Audio_saturation_max. To investigate this further, I estimated the rate of such saturation over the analyzed period as represented by the orange curve in the figure. We can notice that photodiode saturation has been consistently present, with similar rates, even during periods when the loud glitches were absent. However, the correlation between the two becomes more pronounced from mid-December onward.

Some unresolved questions remain to be investigated:

  • The exact source of these glitches remains unclear.
  • It is still unknown what caused the increase in their rate starting in (mid-)December.
Images attached to this report
Comments to this report:
mwas - 14:07 Tuesday 04 March 2025 (66293) Print this report

Is there a filtering done on the figures to include only science time, and exclude the last few seconds of each segment where saturation may occur due to an unlock?

Figure 1 shows data from Oct 15 - Oct 17 last year, almost all the saturation I can see correspond to a lock loss

Figure 2 shows data from Mar 1 this year, there are many saturation while the interferometer remains locked

Confusing saturation during the lock and at the unlock may make the correlation with the glitches less obvious.

Another explanation can be that the saturation channel is triggered before the saturation actually occurs, this channel is used to switch what data from B1 is being used, to stop using the Audio channel and use only the higher noise level DC channel that doesn't saturate. To detector actual saturation of the ADC one needs to look at the SDB2_B1_PD1_Audio_raw_min/max channel. The saturation occurs at +131071 counts and at -131072 counts of the ADC.


Images attached to this comment
narnaud - 14:38 Tuesday 04 March 2025 (66294) Print this report

The DQ flags  V1:DQ_SATURATION_FLAG_a suspended bench_a photodiode  (ex:  V1:DQ_SATURATION_FLAG_SDB2_B1_PD1; logical OR of all these flags:  V1:DQ_SATURATION_FLAG_PD_OR) aim at capturing the saturation logic for each relevant photodiode. They were designed for O3 and have been reviewed by DET before the start of O4b.

direnzo - 17:28 Tuesday 04 March 2025 (66299) Print this report

Is there a filtering done on the figures to include only science time, and exclude the last few seconds of each segment where saturation may occur due to an unlock?

Yes. Glitch triggers are all in science mode segments to avoid the rate analysis getting biased by artificial noise injections. However, I didn't cut on the saturation channel. Looking at its rate, often above 0.1/min, it seems unlikely that these are mostly preceding an unlock. See also this figure from entry #66013. However, I can repeat the rate calculation cutting also on this channel and removing a few tens of seconds before exiting Science mode.

Search Help
×

Warning

×