Reports 1-1 of 1 Clear search Modify search
Detector Characterisation (Glitches)
direnzo - 15:04 Monday 20 January 2025 (66010) Print this report
Overview of glitch populations in the first half of January

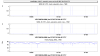
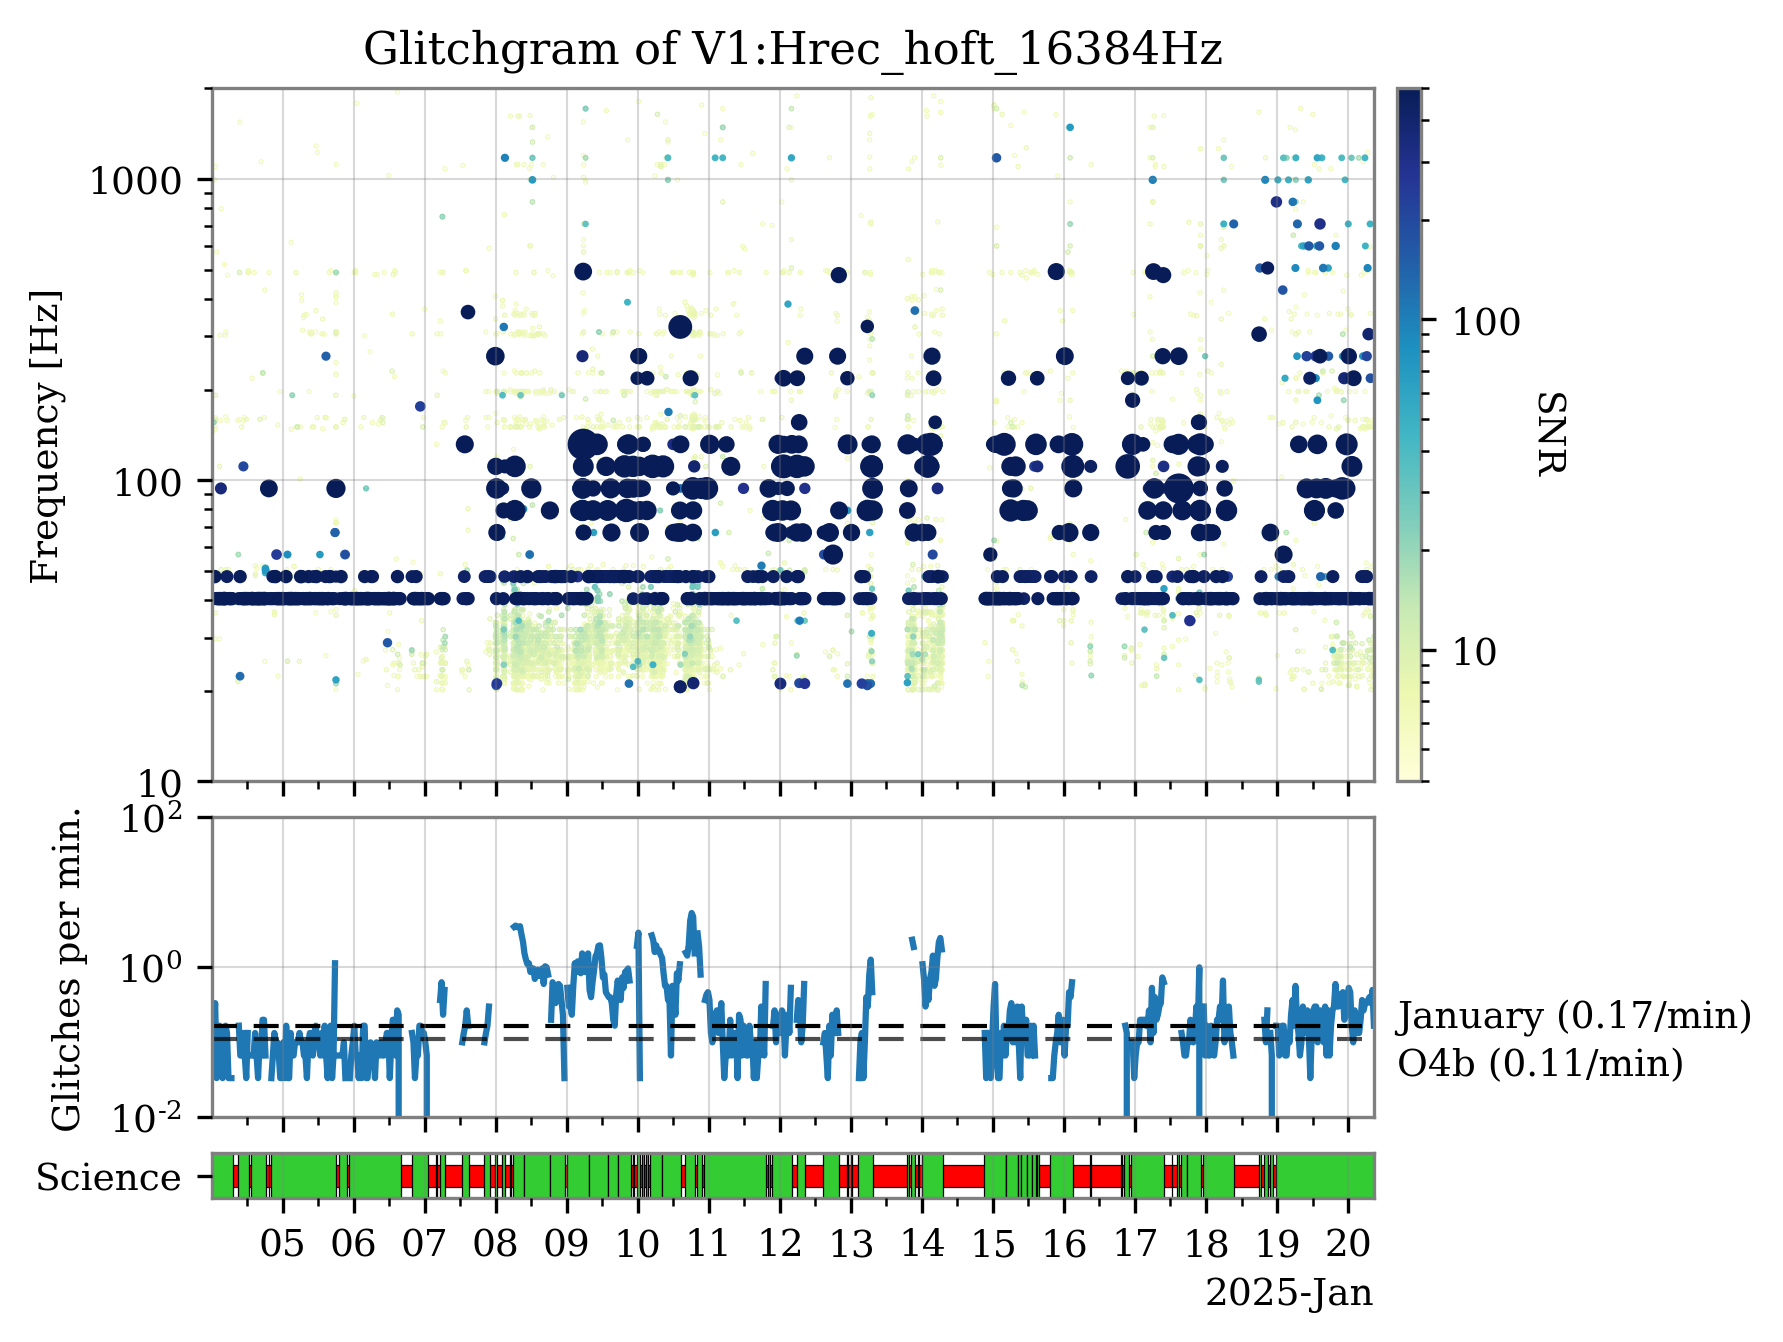
I did a survey of the glitch populations present in the Virgo strain data, starting from the end of January 3, after the injection problems were resolved: #65902. In Figure 1 I report the glitchgram (GPS time vs. frequency at the peak of the glitch trigger, with colorscale and markersize representing the SNR) of the triggers in the analyzed period.

Besides the usual 25-minute glitches, visible as continuous triggers between 40 and 50 Hz, the other glitch families are:

  • Scatterd Light glitches from bad weather and high microseismic noise, visible as low-frequency trigger clusters on Jan 8-11 (as reported by the operators in entries #65945, #65954, and #65964) Jan 13-14 (#65970).
  • A family of glitches very loud (SNR > 200) and very fast glitches, with central frequencies in the bucket 60-400 Hz, has appeared since January 8.
  • At a higher frequency, a third family of glitches, weaker than the previous one, seems to have appeared starting from January 19 (and possibly after the injection system failure: #66002 and #66004).

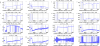
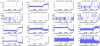
I tried to investigate the origin of these glitches by repeating the correlation analysis via UPV+VetoPerf reported by Nicolas' in #65906.

At this link the complete result of VetoPerf, which I summarize:

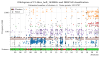
  • V1:SDB1_OMC1_Peltier_cmd_0 and V1:SDB1_B1_f1_i_DCn_0 seem to act as a veto for a fraction of the glitches with SNR ~1000 in the bucket. However, most glitches in this region did not report any useful channels as vetoes, with the channel list used. More detailed investigations are needed, especially if this very loud family of glitches persists.

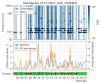
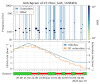
  • The fainter glitch family started yesterday appears similar to, but significantly less severe than, that identified on January 2: #65902. The resulting correlated channels are the same as found by Nicolas in #65906, specifically INJ_* and SIB2_* channels. In the attached gif the glitchgram before and after applying the veto: note that the majority of triggers after January 19 disappear. We will continue to monitor these glitches but they will likely go away once the INJ issues are fully resolved, as happened earlier inJanuary.

Images attached to this report
Comments to this report:
mwas - 20:57 Monday 20 January 2025 (66012) Print this report

Figure 1. There are lots of glitches that are related to B1 photodiode saturations. Are these channels related to one of the family of glitches?

Images attached to this comment
spinicelli - 13:22 Tuesday 21 January 2025 (66025) Print this report

Concerning the PSL/INJ side, since the last SL Temp controller failure, the PSTAB corrections increased more then the usual trend of the last days (see fig.1).

This morning, we brought back the temperature of the amp head at its nominal one (since the beginning of the year), however, this didn't recover completely the AMP power (see fig. 2).

However, the PSTAB noise has been improved, the related glitches in Hrec should be reduced now.

Images attached to this comment
direnzo - 14:57 Tuesday 21 January 2025 (66013) Print this report

From the UPV results, I couldn't find correlations with the (safe) SDB2_B1_* channels. The channels tested with UPV+VetoPerf are listed in the attached TXT file. However, I explored this possible relationship using a different approach, which I will describe in detail below.

To complement the primary visual identification of glitch families described in #66010, I applied clustering algorithms to the glitch triggers identified by Omicron during this time frame. Specifically, I used the DBSCAN - Density-based spatial clustering of applications with noise algorithm, an unsupervised clustering method that groups data points based on their density in the parameter space of Omicron triggers.

For this analysis, I selected triggers with SNR > 10. The classification results are shown in the glitchgram in Figure 1, where different colors represent the glitch families identified by the algorithm. While the clustering is not perfect, and the choice of glitch features and hyperparameters was not optimized or cared in detail, the results align with the observations described in the original post. In particular:

  • The 25-minute glitches are clearly identified (brown markers).
  • Scattered light is recognized as distinct families in the correspondence of recent days of bad weather (blue markers).
  • THe high-frequency glitches of the last days are identified, whose rate has significantly increased since January 19, as previously reported (orange and, possibly, red markers).
  • Other intermediate-frequency glitches are recognized, although less distinctly (purple markers).
  • Crosses correspond to triggers not classified by the algorithm and are therefore identified as "noise."

This clustering analysis confirms the visual classifications in the initial post and provides additional insights into the structure and onset of the glitch families.

Focussing on the "purple glitch family," these are characterized by very large SNR and frequency at peak in the bucket. Therefore, to study the relation with the B1 saturation, I selected glitch triggers with SNR > 300 (and frequency at peak >90 Hz, although not necessary to further restrict the selection). The selected glitches are shown in the gitchgram in Figure 2. I compared the GPS times of these glitches with the times where the B1 saturation flag was active, represented by the vertical lines. Blue vertical lines correspond to times when this flag was active and fell within a delta_t of 2 seconds from the selected high-SNR glitches. Gray lines correspond to B1 saturations not corresponding to the previous glitches. The result doesn't change significantly by increasing the delta_t up to some tens of seconds (the lower limit is given by the resolution of trend channels).

Comparing blue and grey lines, using a minimum SNR threshold of 300, 68.59% of the high-SNR glitches have a flag nearby. These are the percentages obtained by changing the threshold:

SNR threshold Coincidence [%]
100 57.60
300 68.59
500 74.9
1000 70.32


In the central panel of the same image, I reported the hourly rate of high-SNR glitches and B1 saturations. There seems to be a clear correspondence between the two curves. These results support the hypothesis by Michal that high-SNR glitches are associated with saturations of the B1 photodiode.

In Figure 3 I report the detail of a day with many high-SNR glitches and many B1 saturations.


Images attached to this comment
Non-image files attached to this comment
narnaud - 10:20 Monday 27 January 2025 (66072) Print this report

The strong glitches have been there all week, with varying intensity/frequency over time. See for instance https://scientists.virgo-gw.eu/DataAnalysis/UPV/2025/20250126/last_week_1421276422-1421881222/V1:Hrec_hoft_16384Hz/perf/V1-Hrec_hoft_16384Hz-all_freqtime.png (Omicron glitchgram over a week) and https://scientists.virgo-gw.eu/DataAnalysis/UPV/2025/20250126/last_week_1421276422-1421881222/V1:Hrec_hoft_16384Hz/perf/V1-Hrec_hoft_16384Hz-veto6_freqtime.png (after an UPV veto based on V1:INJ_IMC_TRA_DC, representative of many related INJ channels).

Search Help
×

Warning

×