Reports 1-1 of 1 Clear search Modify search
Detector Characterisation (General)
direnzo - 13:21 Saturday 03 August 2024 (64853) Print this report
Data quality overview after re-engaging Science mode

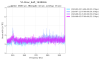
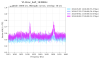
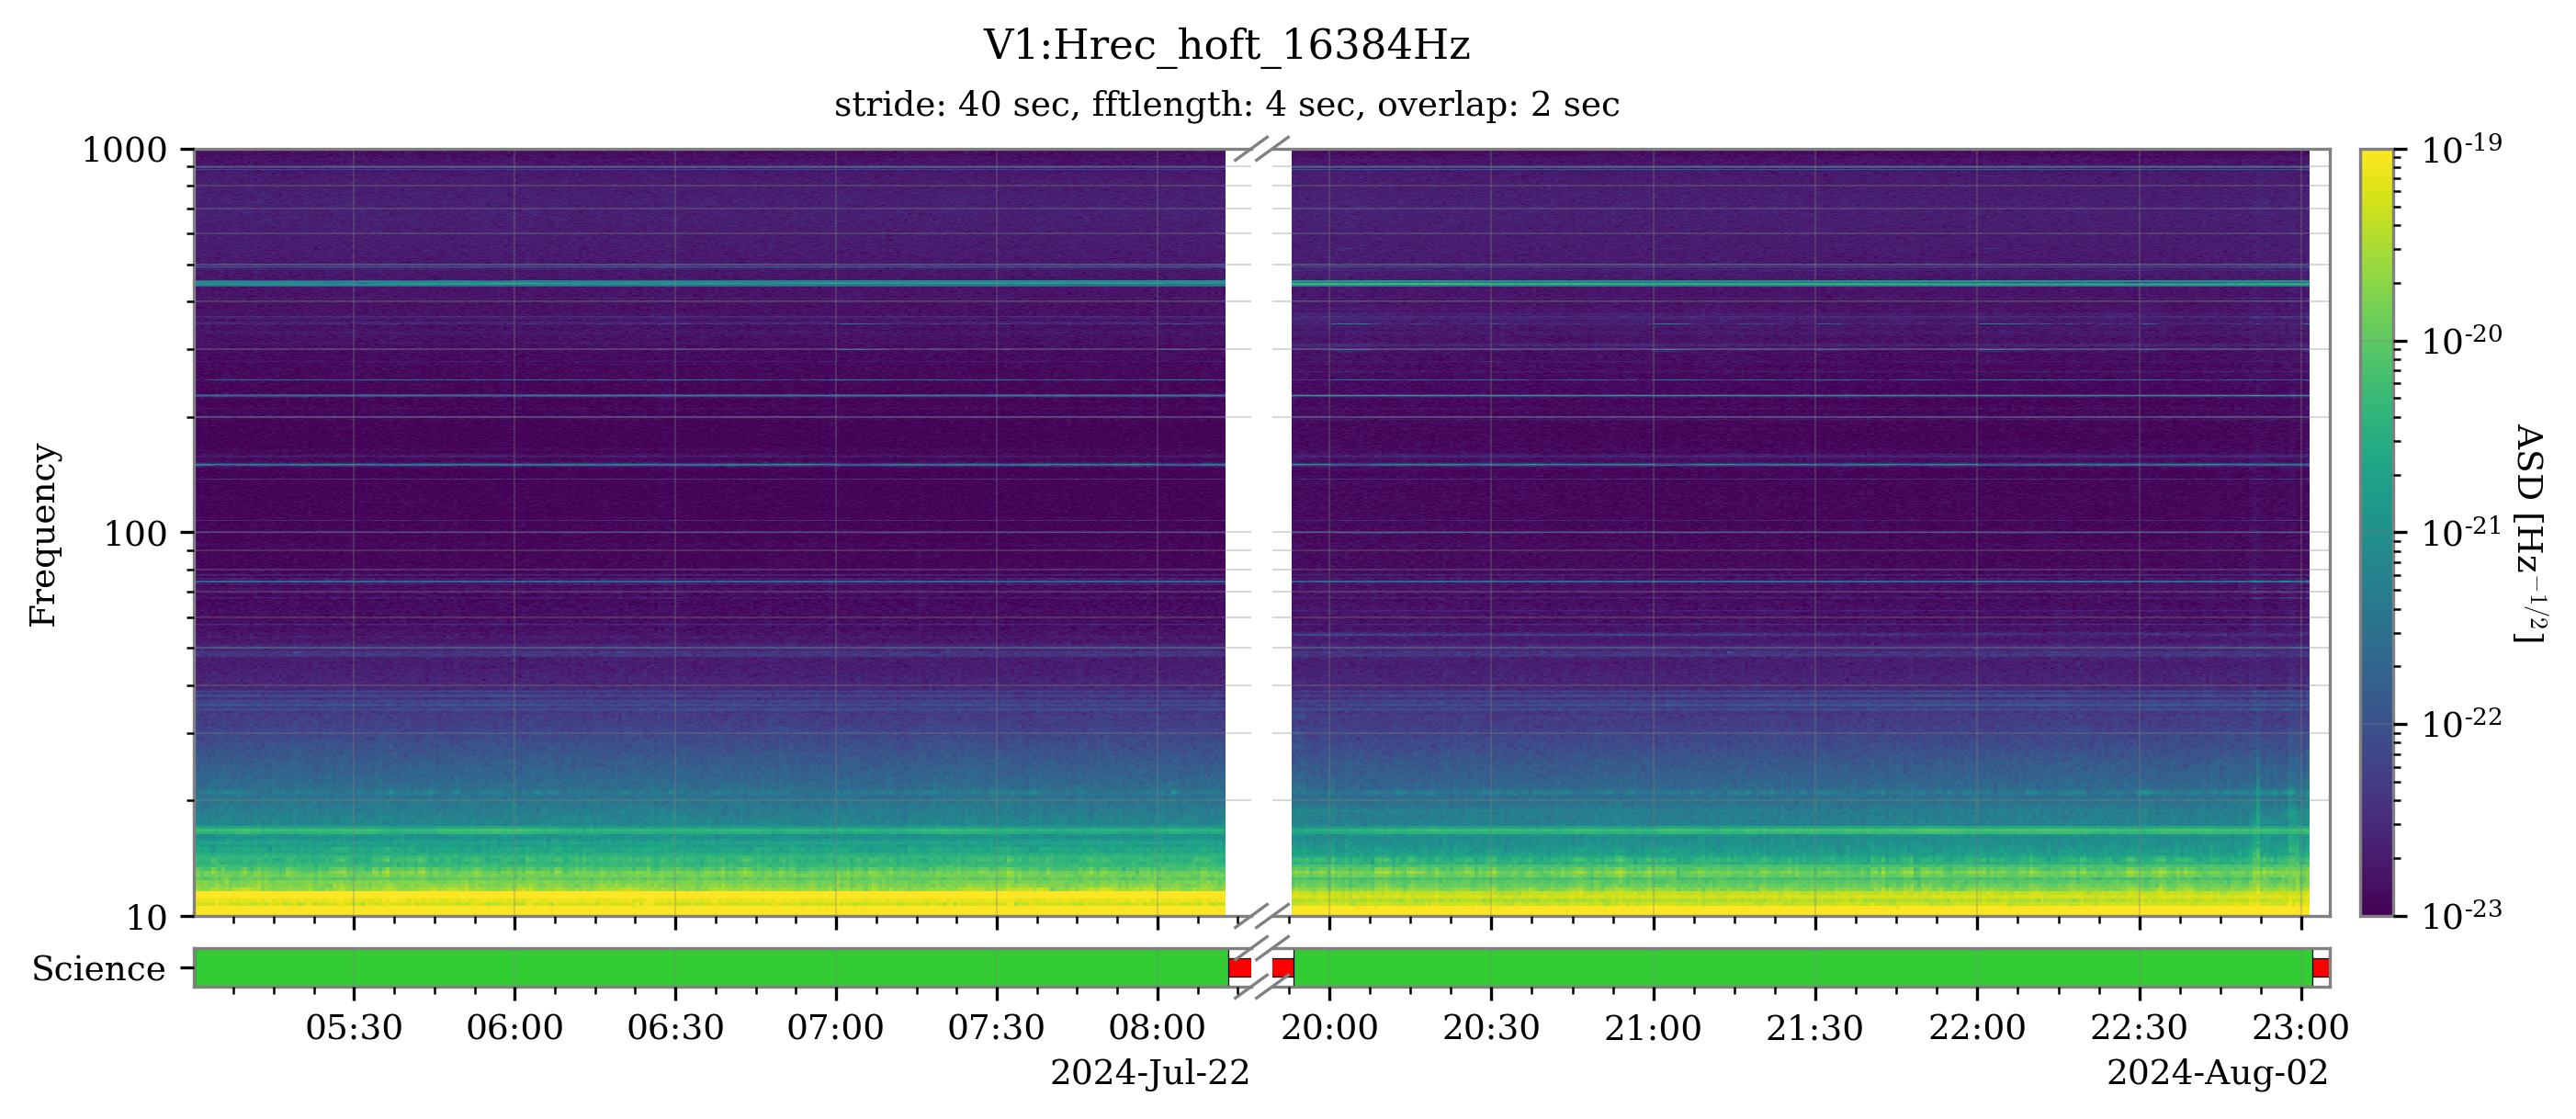
I report an overview of data quality in the about three hours of Science mode (Low Noise 3 state) following the interventions of the past weeks. Overall, the noise is consistent with that before the intervention. I have attached some plots below to analyze stationarity, glitch rate and spectral noise.

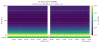
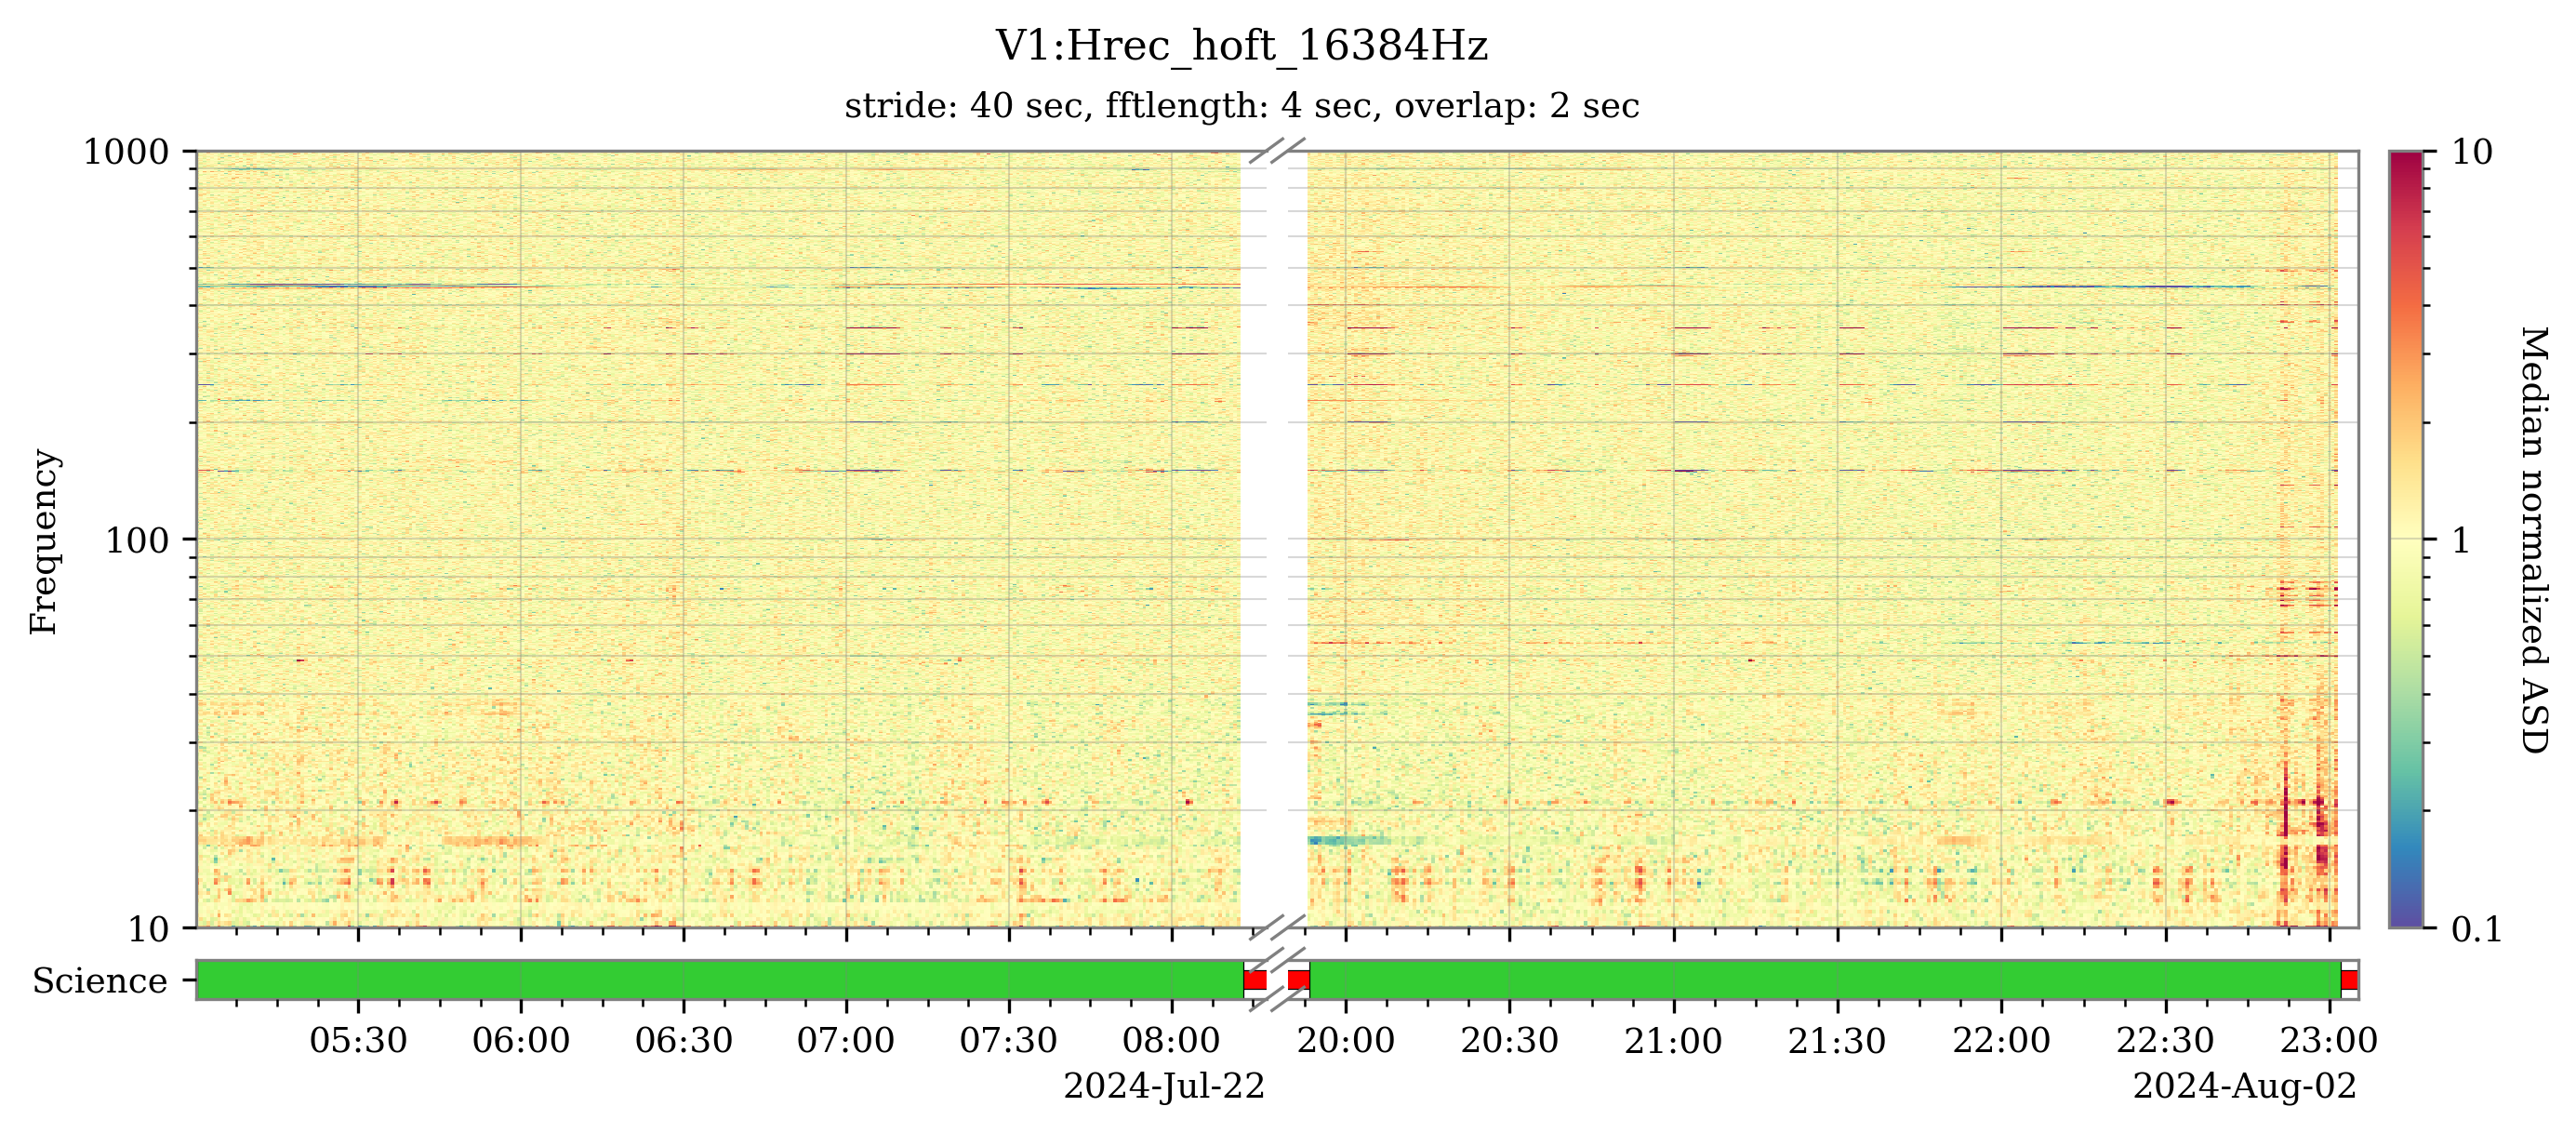
Figure 1: Side-by-side spectrograms of the strain in the last three hours of Science mode pre-intervention and in the post-intervention Science mode segment.

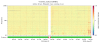
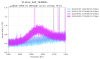
Figure 2: Same spectrogram but where the two parts are normalized frequency-wise by the median. On the left-hand side, you can see some color variation, indicating excess noise, in the 50-60 and 300-400 Hz bands. I will analyze the detail in the following plots.

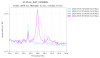
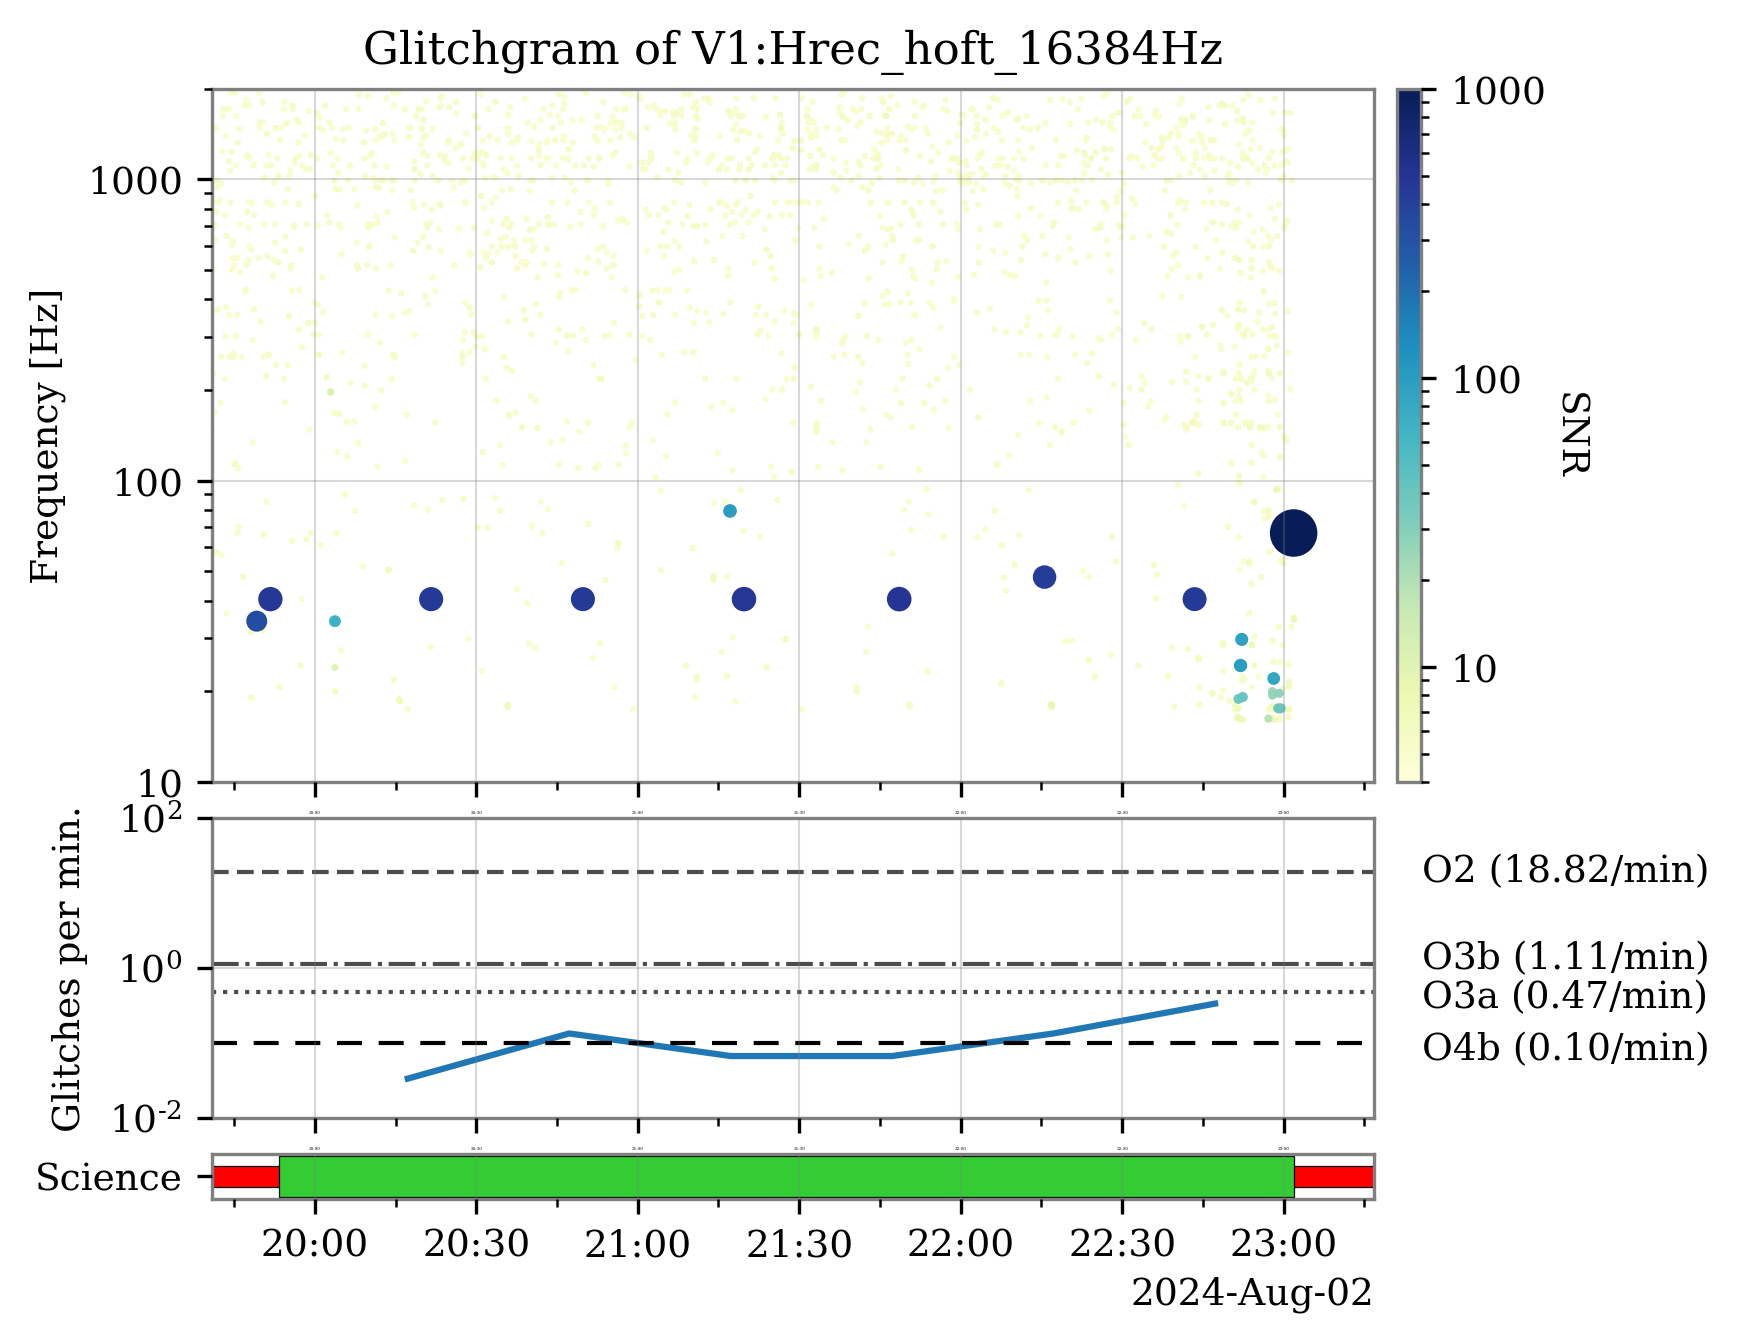
Figure 3: Glitchgram and glitch rate timeseries, perfectly consistent with what we already saw during O4b: 25-minute glitches are the main family of glitches visible. The rate is still 0.1 glitches/minute. The latest burst of glitches appears to be associated with the earthquake reported by Beatrice from 22:51 UTC: #64849.

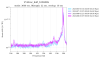
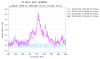
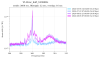
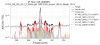
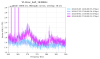
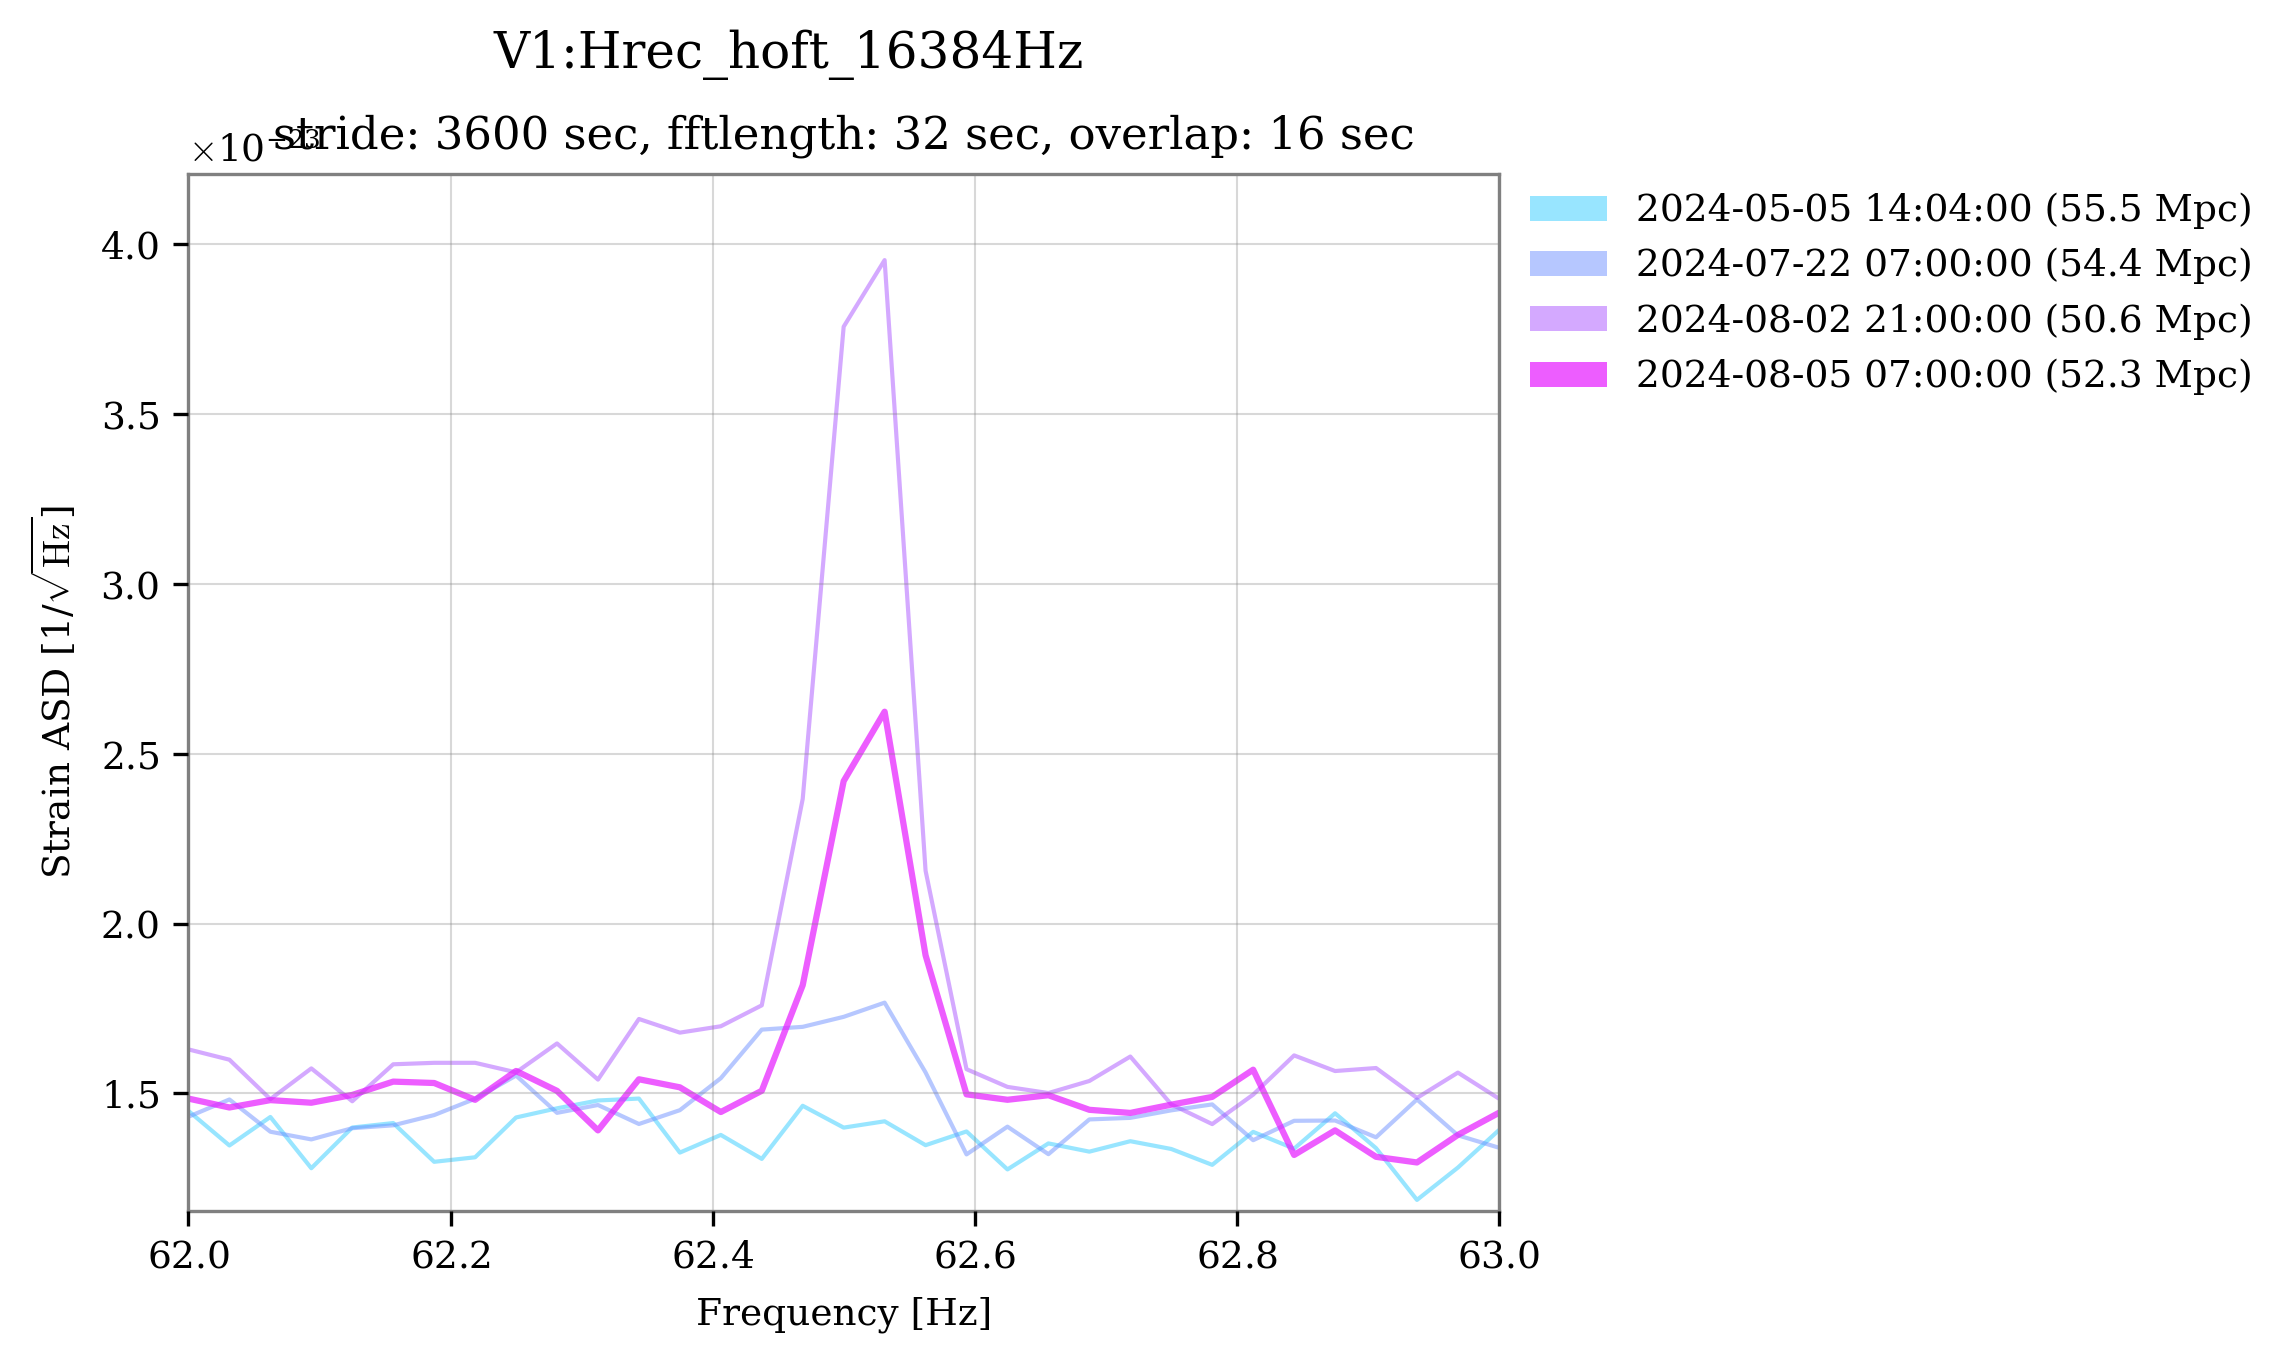
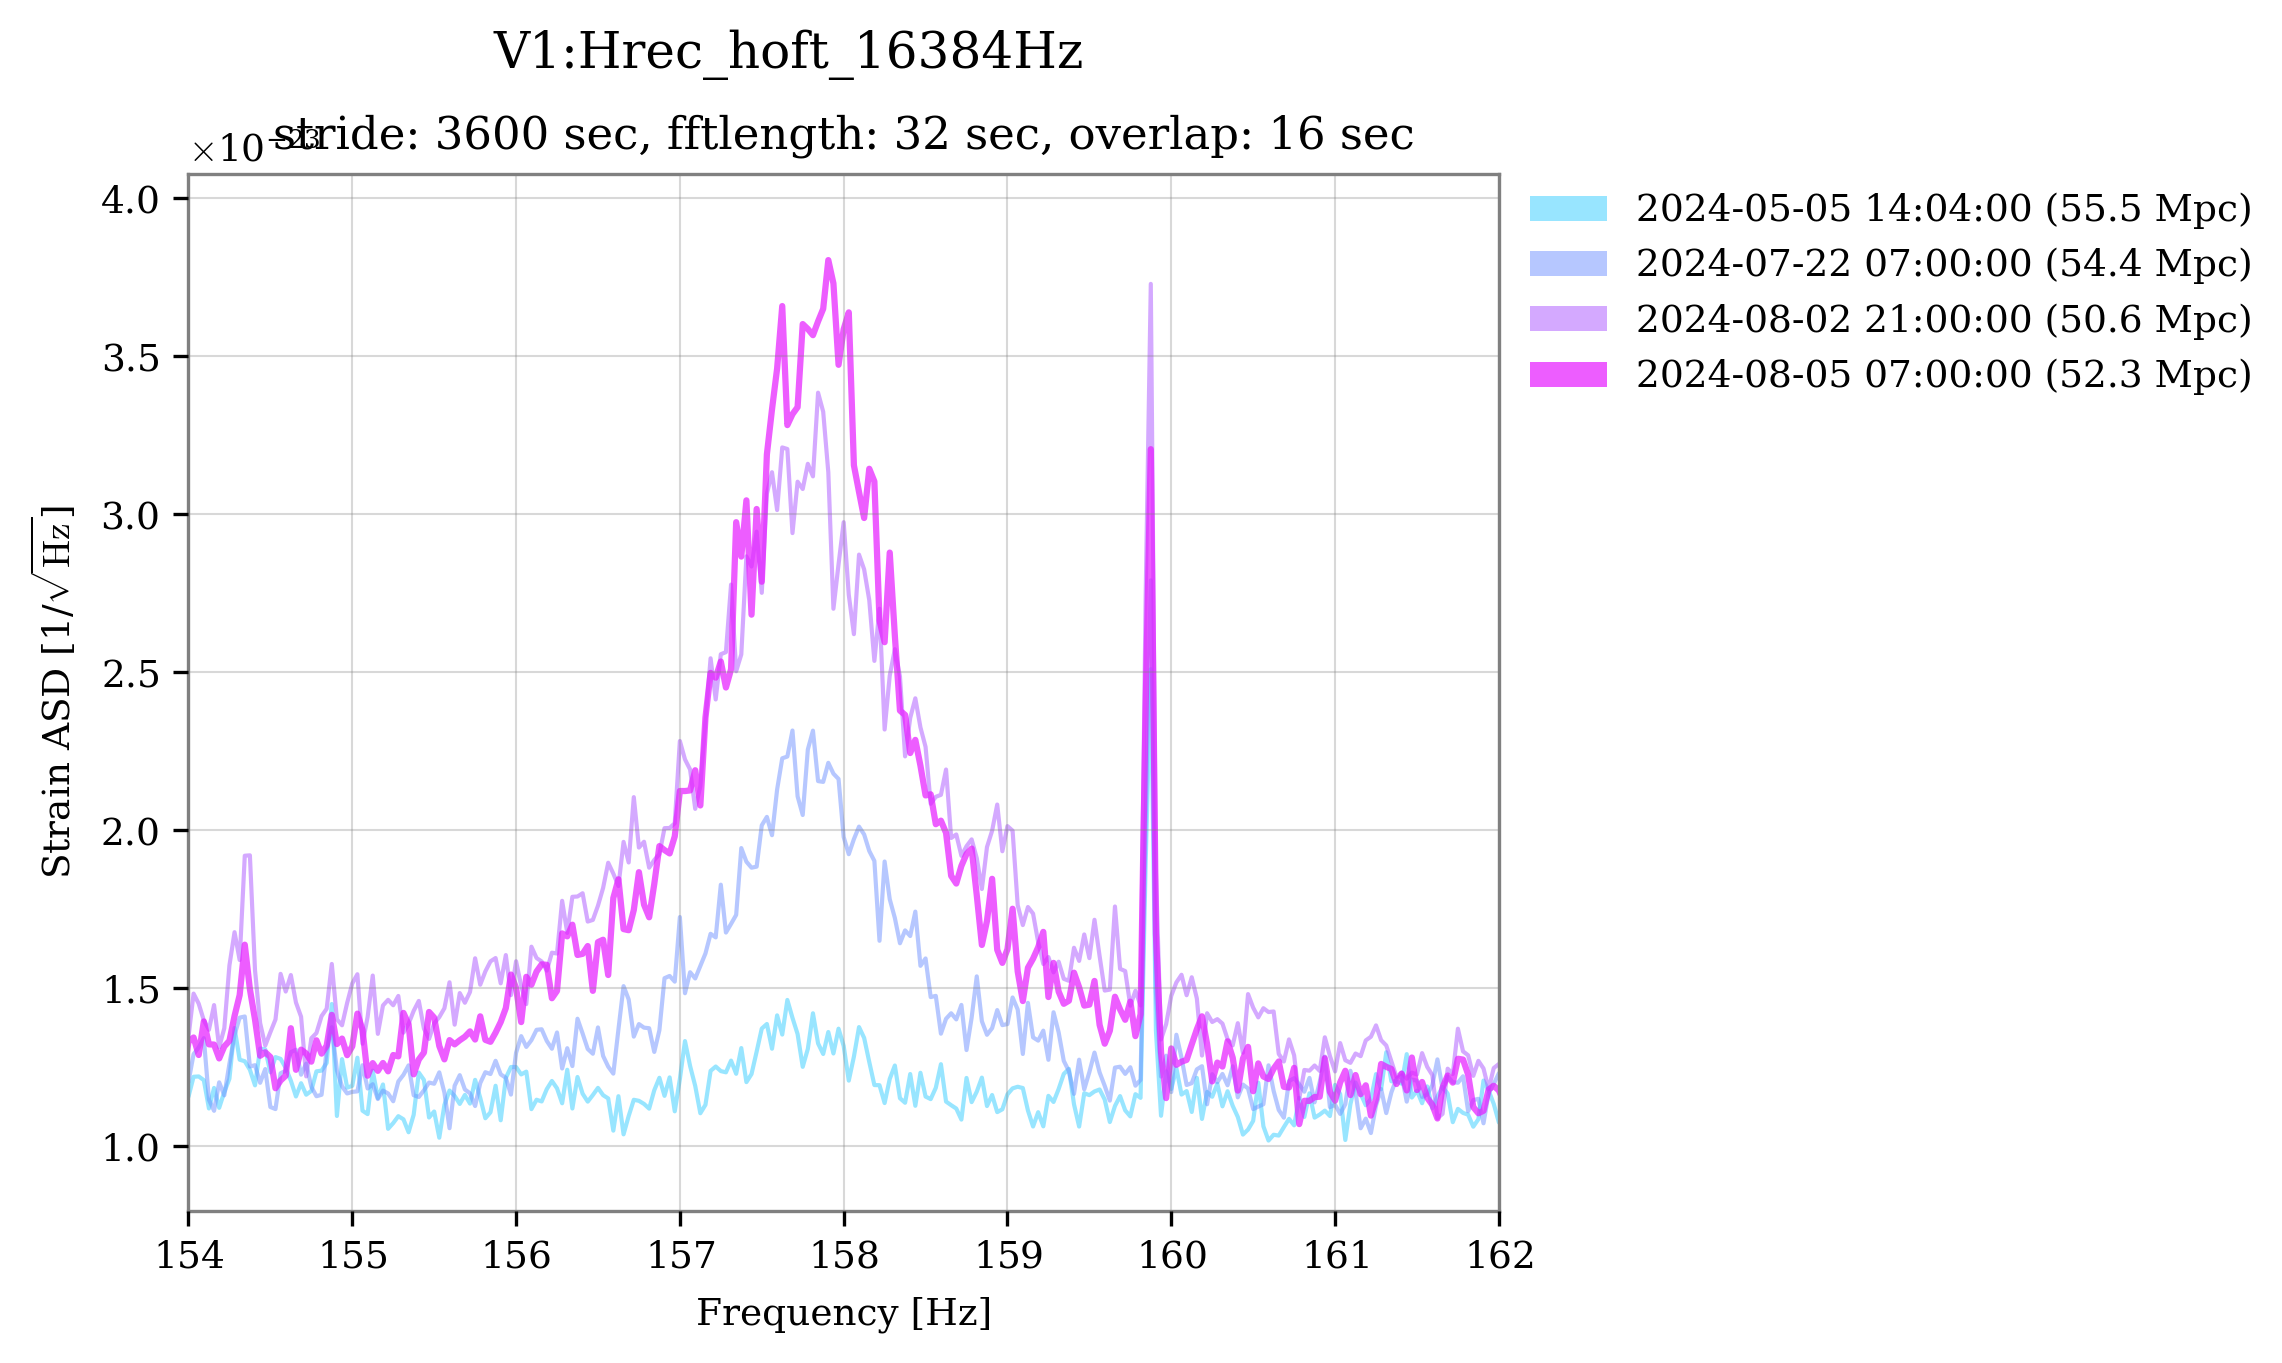
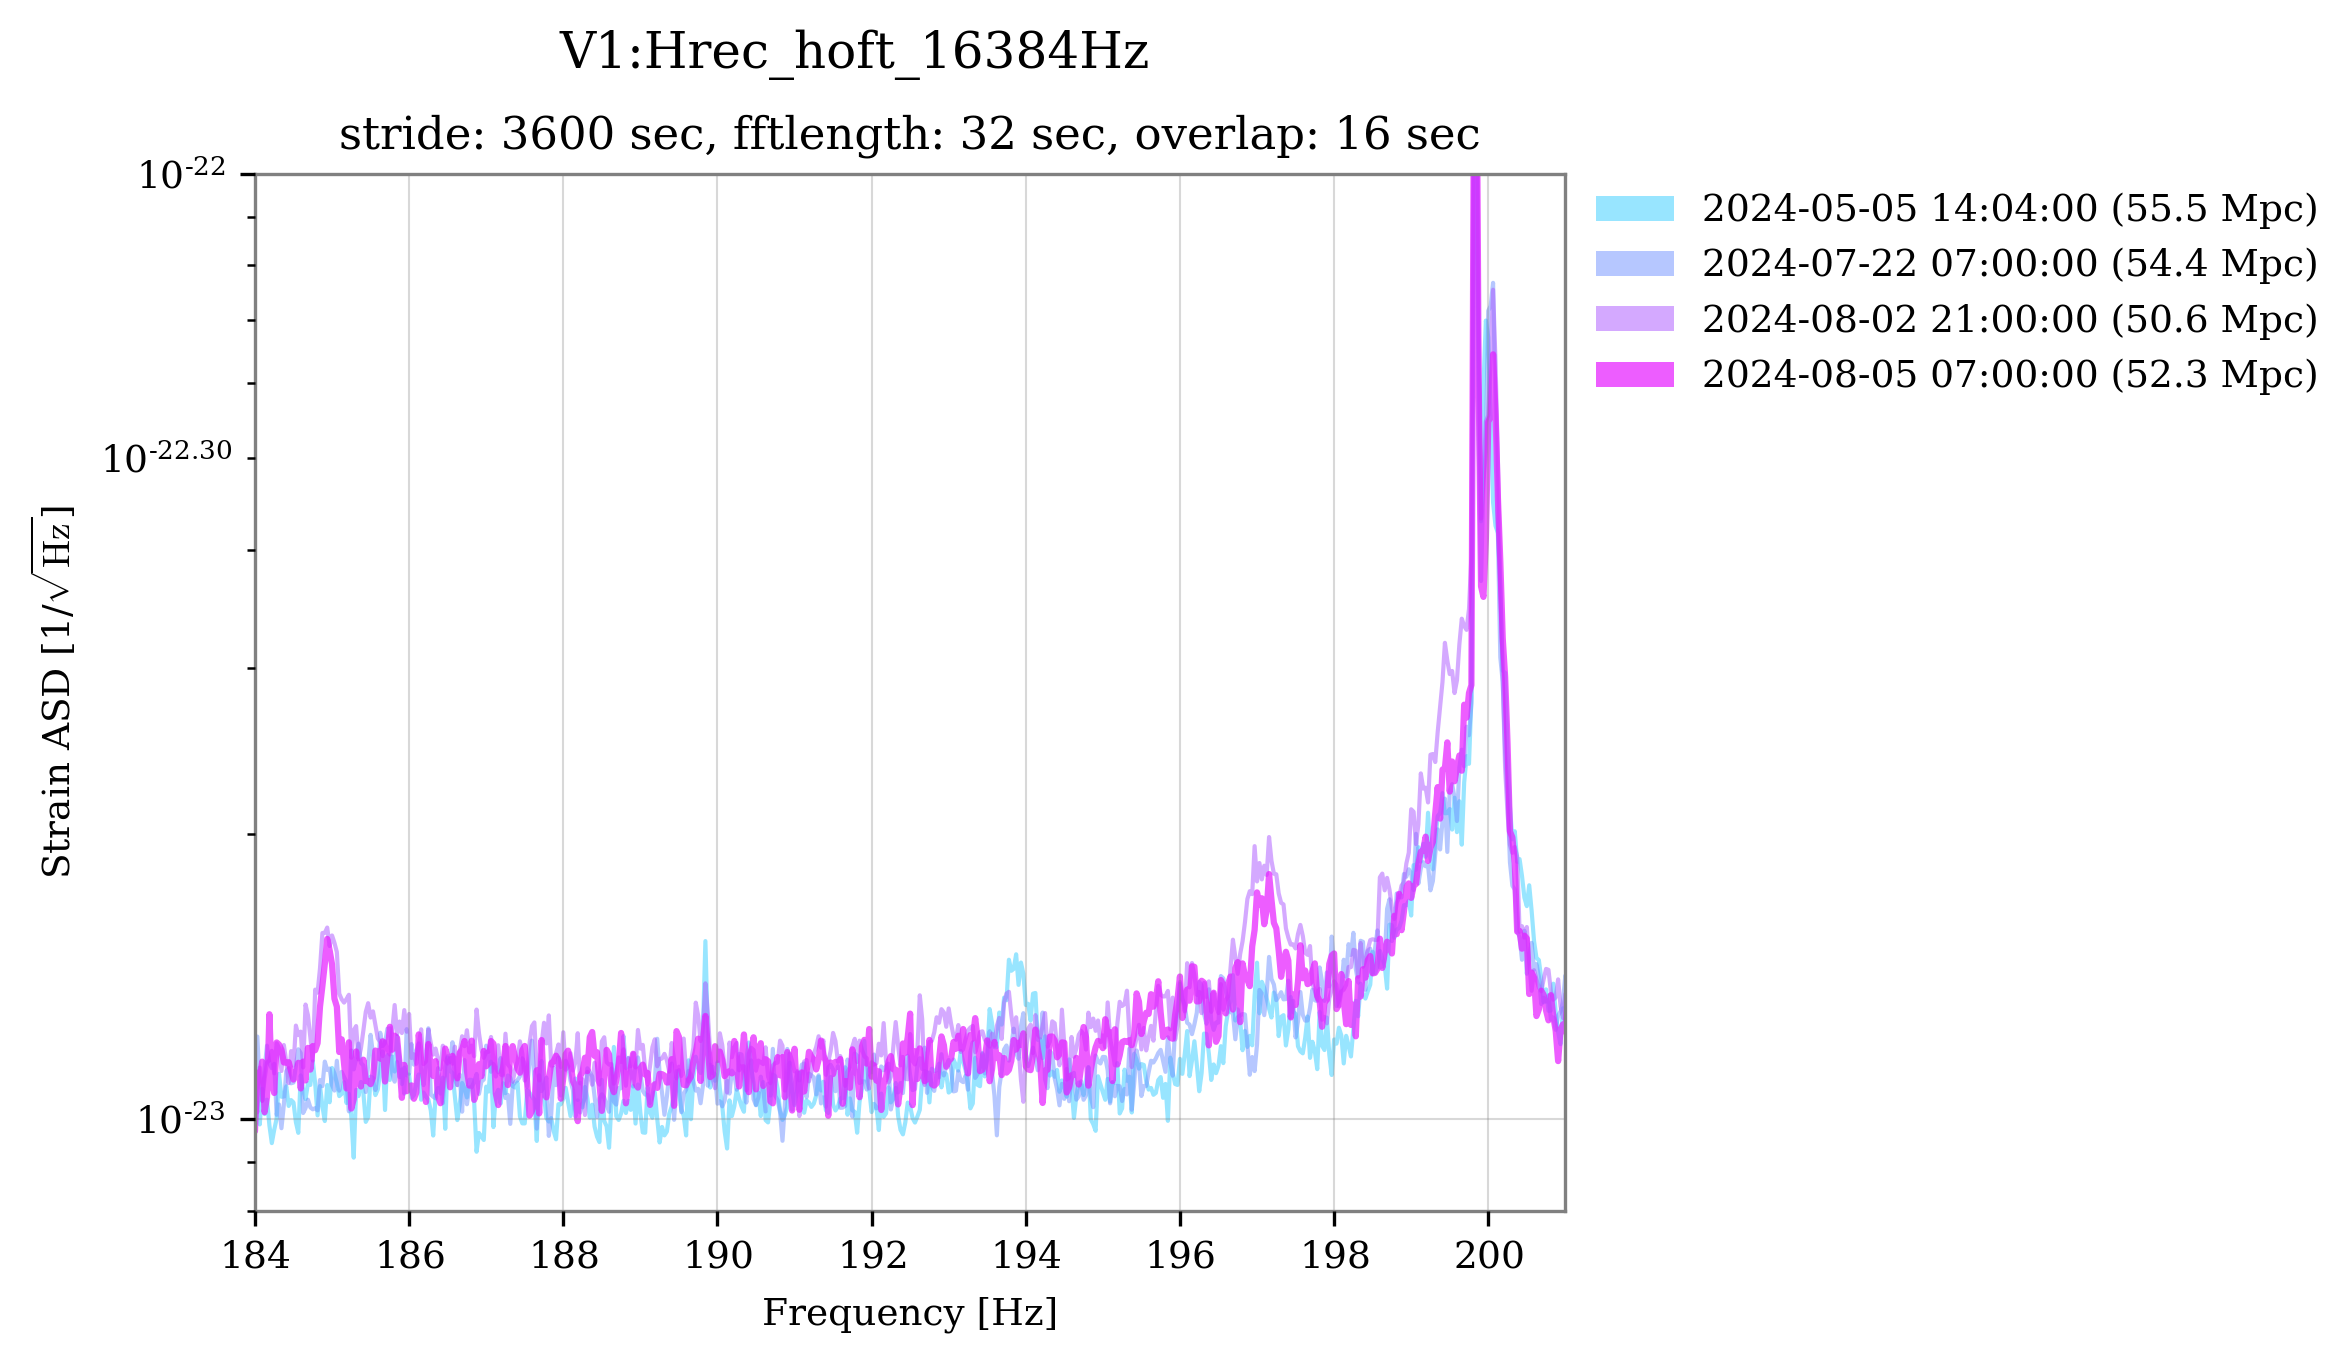
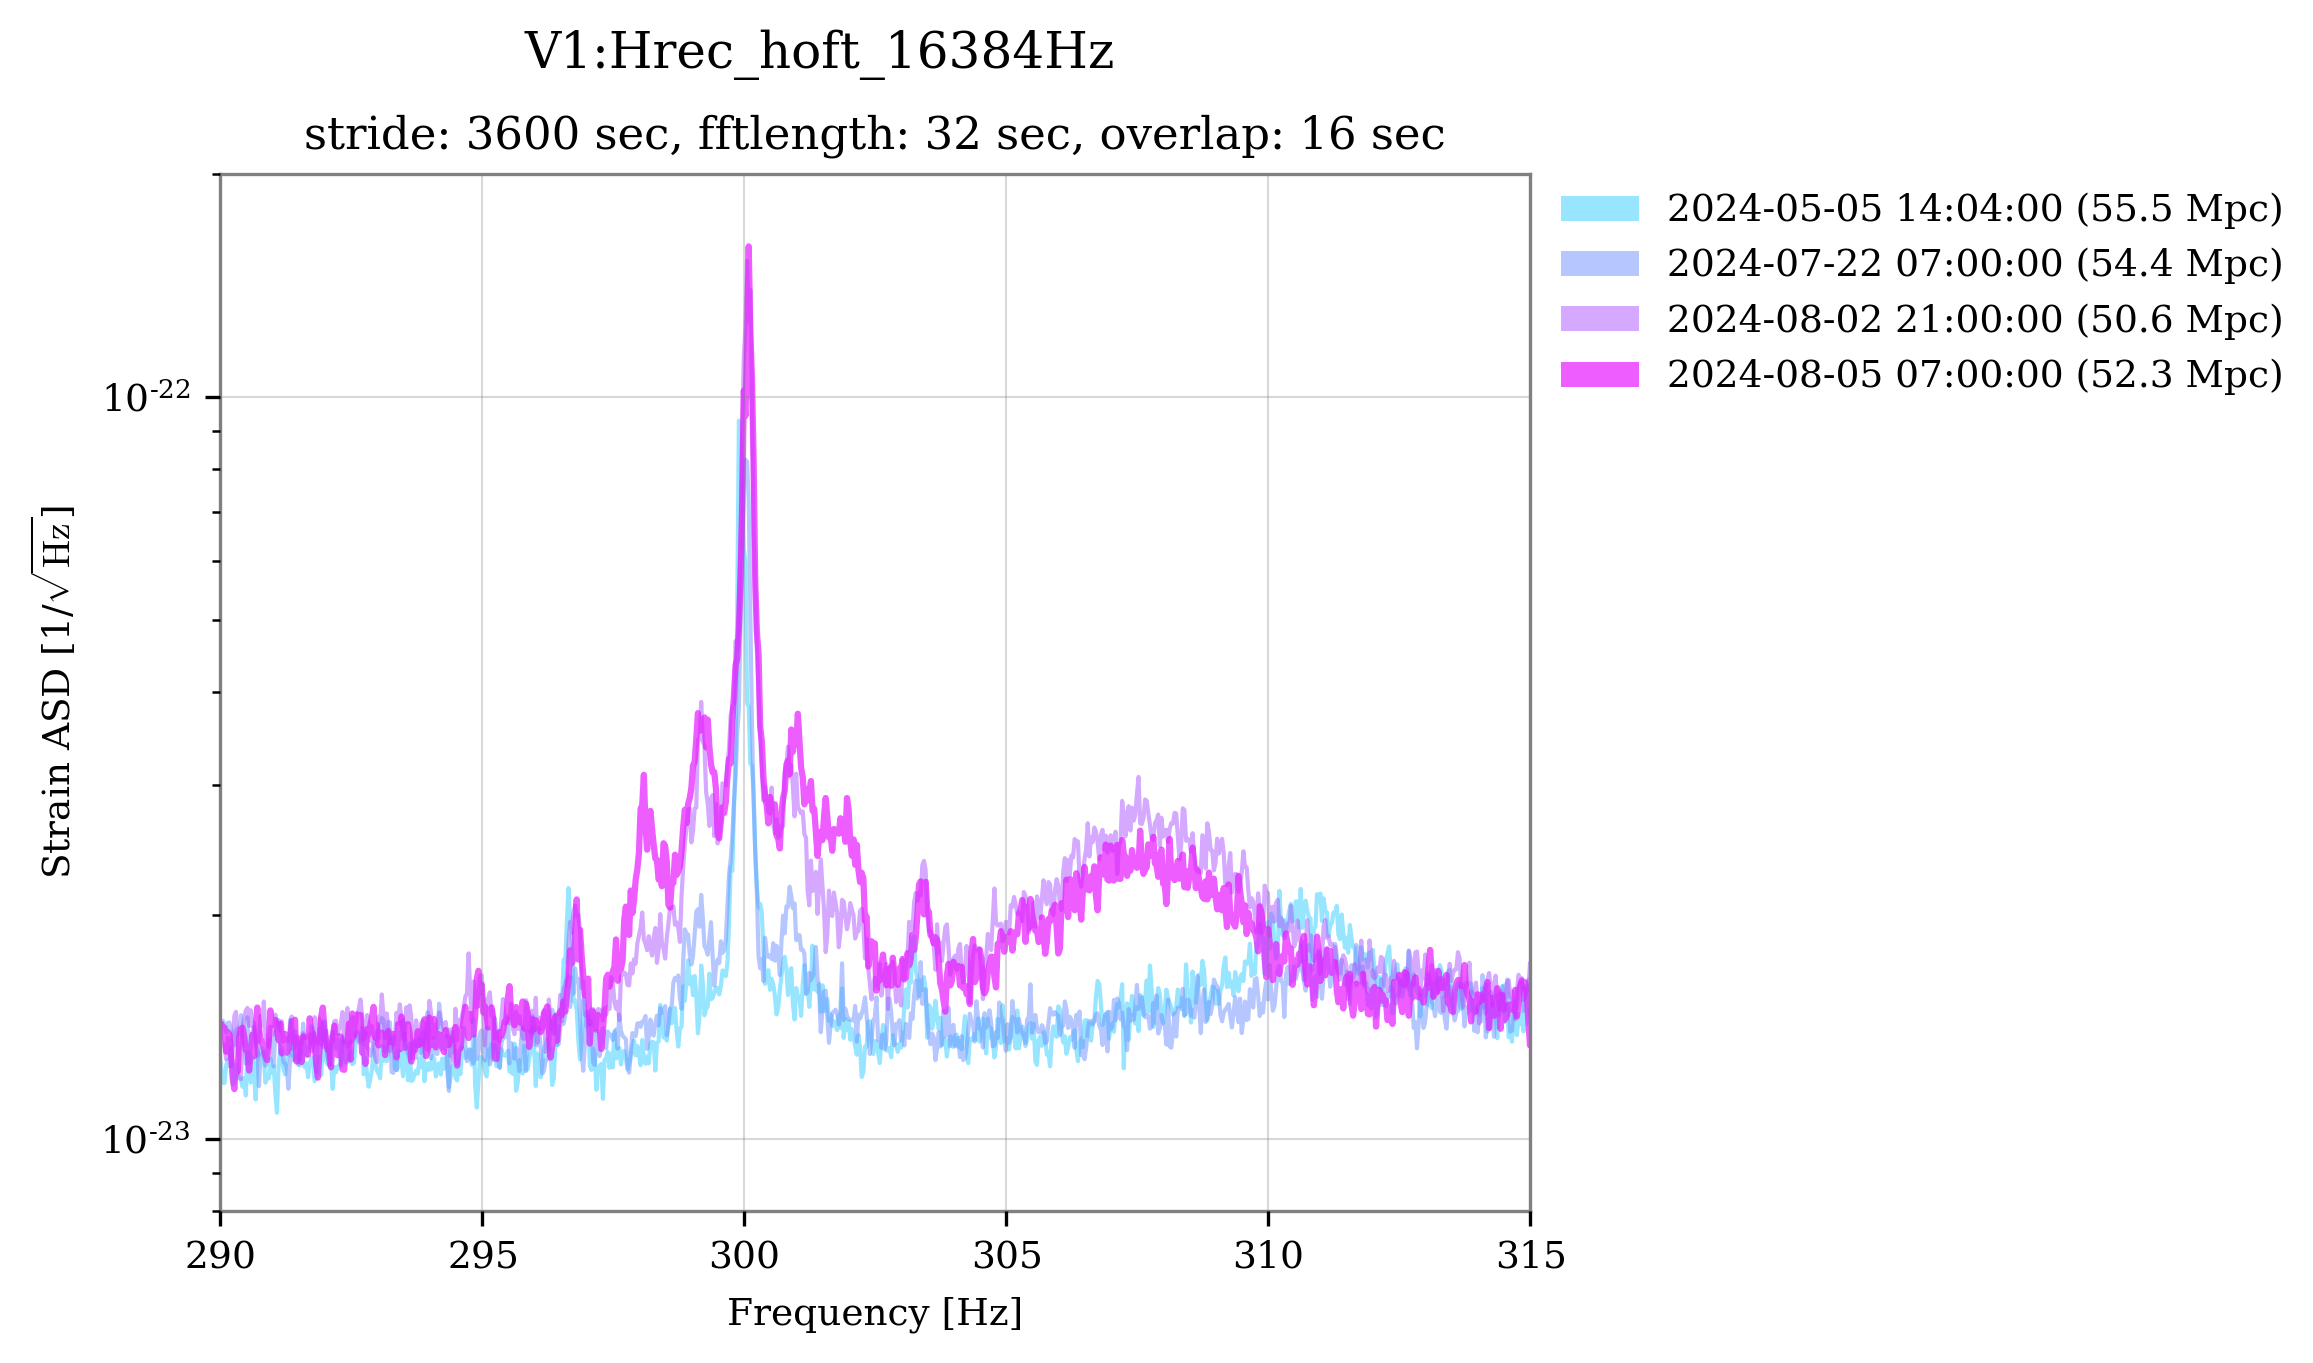
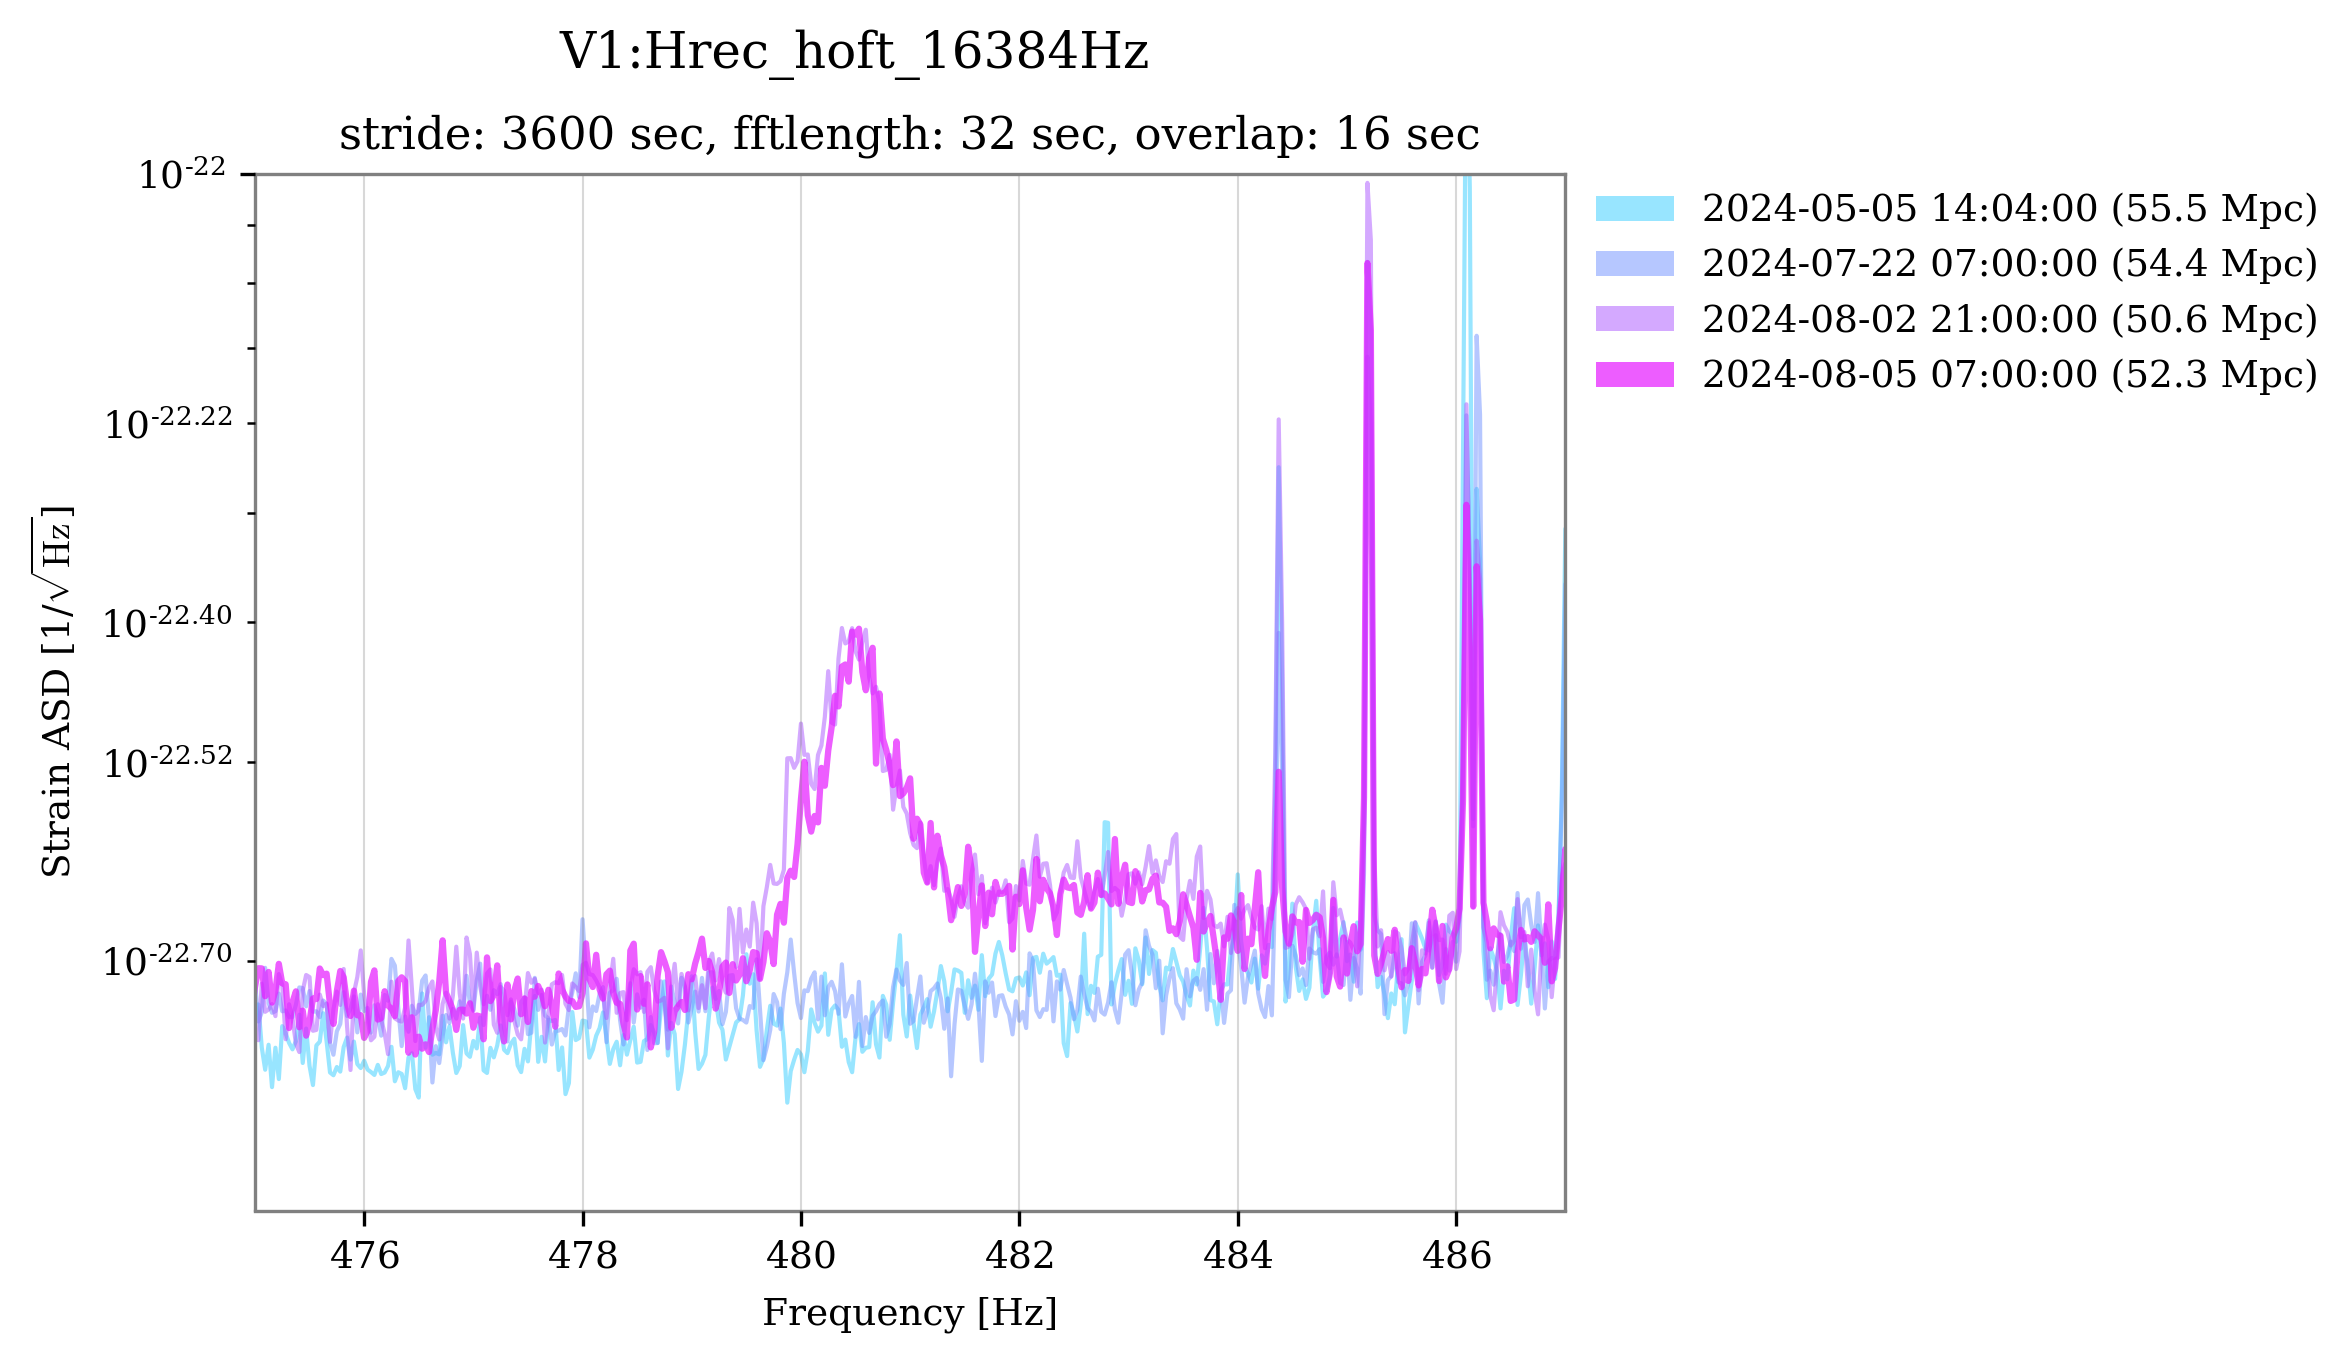
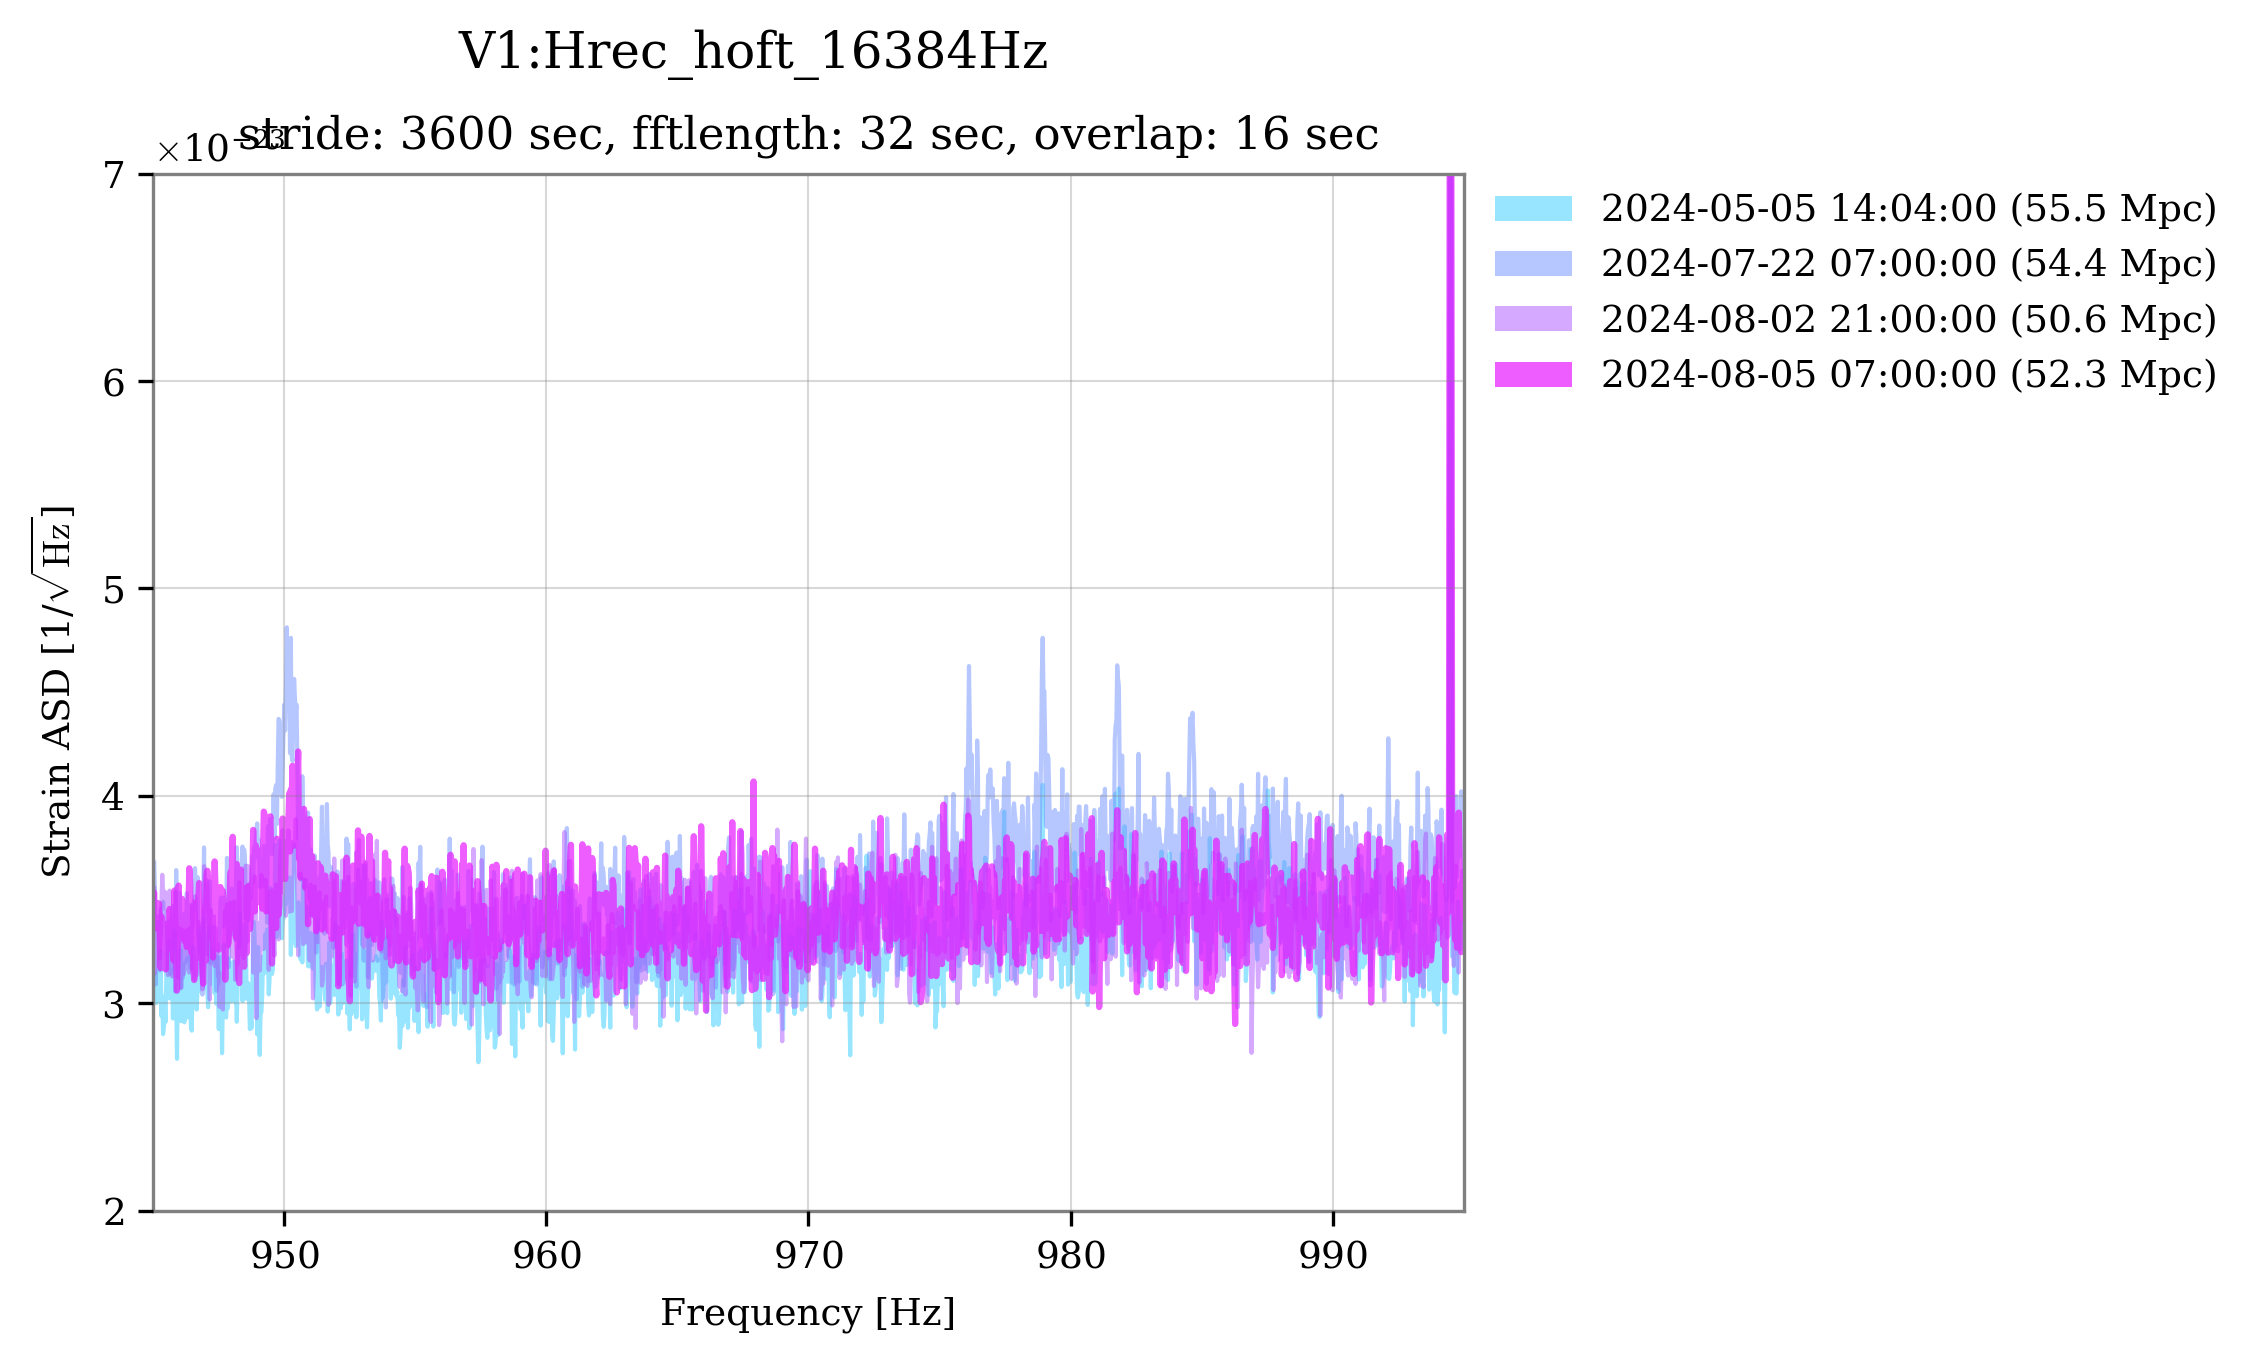
File: In this PDF file I report the comparison between the reference sensitivity curves for O4b (as reported on the VIM), in the last segment of Science mode before the intervention, in an hour of DQ studies at 9:15 on August 2, and during the Science mode on August 2. The various frequency windows detail some regions with more marked differences between the current sensitivity curve and those before the intervention. A few of them have been already highlighted in #64838. As shown in the normalized spectrogram (Figure 2), some of these structures are non-stationary, and it is likely that they will disappear after the detector will stabilize after a few hours of unperturbed Science mode, and especially once the squeezing is reinjected. It is however important to keep an eye on these frequency bands and structures in the coming days and longer data segments.

So far, everything is OK, overall, from a data quality perspective.


Images attached to this report
Non-image files attached to this report
Comments to this report:
direnzo - 20:01 Monday 05 August 2024 (64873) Print this report

I repeated the analysis of the previous entry, and here I report the comparison with the noise curve in the first segment of Science mode after recovery (violet) and today's one (fuchsia), after several hours stably in Science mode. The detector in both cases is in Low Noise 3 state, while the other curves reported are, as in the previous entry, the reference curve of O4b (cyan) and the one in the last segment of Science mode before the intervention (blue).

Below I analyze the various structures that appeared in the spectrum after the intervention:

Broad peak at 54 Hz (Figure 1): new broad peak at ~54 Hz, not present before the intervention, and with non-stationary central frequency, as shown by the difference in the peak between Friday (violet) and today (fuchsia). BruCo highlighted coherence of this with the accelerometer on the detection tower and with various other accelerometers of the OB suspension filter 0.

Line at 62.5 Hz (Figure 2): New line quite narrow, with slightly variable amplitude. Coherence found with V1:INJ_IMC_QD_FF_DC_V.

Peak at 157.8 Hz (Figure 3): broad structure 157.8 Hz enhanced compared to before the intervention (blue) and especially to the reference curve for O4b (cyan), where it looked almost absent. BruCo highlights a large number of channels coherent with this structure, linked to the control of the SSFS, such as V1:SSFS_Err_post.

Small bumps at 185 and 197 Hz (Figure 4): Two new small peaks at 185 and 197 Hz. Only a slight coherence for the first peak with the accelerometer of the detection tower, ENV_DT_ACC_Z. Nothing evident for the second one.

Bump at 262 Hz (Figure 5): New wide bump at 262Hz, identified first in this entry #64838. Once again, BruCo reports some coherence, albeit modest, with the accelerometers on the detection tower: ENV_DT_ACC_Z  and ENV_DT_CT_ACC_Z.

Line at 300 Hz and bump at 307 Hz (Figure 6): Noise in this region appears amplified after the intervention. The 300 Hz line seems higher, and with it the whole sideband structure. The bilinear contributions to the noise are however the usual ones, as highlighted by the MONET results: Figure 7. No significant coherence is found with the bump at 307 Hz.

Bump at 370 Hz and structure at 381 Hz (Figure 8): No evident coherence has been found with BruCo for the 370 bump, while for the other structure there is again a slight coherence with the detection tower accelerometers: ENV_DT_ACC_Z.

Peak at 480.5 Hz (Figure 9): New wide peak at around 480Hz, not present before the intervention. Still  ENV_DT_ACC_Z among the most coherent channels, though with quite low value.

Disappeared comb and bump at 980 Hz (Figure 10):   A comb of lines spaced about 2.85 Hz at 980 Hz was present and known for some time (see #63996). After the intervention, and with the detector in Low Noise 3 without squeezing, this structure seems no longer present. Action item: to be understood if this is actually related to the injected squeezing state, comparing other sufficiently long periods in Low Noise 3.

Small peaks at 1632 and 1650 Hz (Figure 11): Compared to before the intervention, two peaks appeared at 1632 and 1650 Hz. Also in other cases, the frequencies corresponding to harmonics of 50 Hz have higher noise than before: see Figure 6 and Figure 10. Unfortunately, BruCo daily runs don't get that high in frequency. Action item: Re-run BruCo with a larger sampling rate configuration.

Bump at 2030 Hz (Figure 12): New large bump between 1950 and 2100 Hz. Same action as above.

In general, after the intervention, a slight increase in noise is evident at a few frequencies, related to the vibrations of the detection tower. The origin of these vibrations needs to be further investigated.


Images attached to this comment
direnzo - 11:15 Wednesday 07 August 2024 (64893) Print this report

I have re-run BruCo with a sample rate of 5 kHz to investigate the coherence of the structures identified in the previous entry. Link to the full results.

The structure at 1632 Hz has been found coherent with some channels related to the squeezing (the external squeezing bench EQB1): EQB1_CC_PLL_STATUS and EQB1_MAIN_PLL_STATUS.

The bump at 1650 Hz has coherence with the quadrant photodiode signals for the B1s beam on the external detection bench, EDB_B1s_QD4_DC1 (same for DC2, 3 and 4), and with the magnetometers in the W direction in the central building, ENV_CEB_MAG_W , and other buildings. The latter could be just a contamination coming from the harmonics of the mains frequency.

No evident coherence for the broad bump at about 2 kHz. The values for the coherence reported by BruCo are all below 0.1, except for a few narrow lines.

Search Help
×

Warning

×