In the framework of the ongoing investigations for the study of spectral noise, I repeated the analysis done for the mini-Engineering Run, with the estimate of a high-resolution sensitivity curve and the rough identification of the main spectral lines, as described in this logbook entry: #63221. The result can be used as a reference and for comparison with the output of more refined tools, such as NoEMi.
As a remark, the frequency resolution of 1mHz is obtained with 1000 second-long FFTs. This duration is constrained by the 25-minute glitches; estimating the ASD with median averages is robust to these glitches if most of the FFTs are not affected by their presence. This requires using FFTs shorter than 25 minutes (1500 sec).
The data segment to be analyzed was the one with the longest duration in Science mode, weighted by the lowest coefficient of variation. The choice fell on the segment: 2024-04-13 01:53:18 to 2024-04-13 18:30:04 (59806.0 sec).
I attach to this entry the pdf with the details of the various frequency regions of the spectrum and the CSV with the identified lines. I plan to repeat this analysis for the next weeks, and attach the results in this git issue and its sub-tasks, for reference.
I'm adding also the following images:
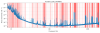
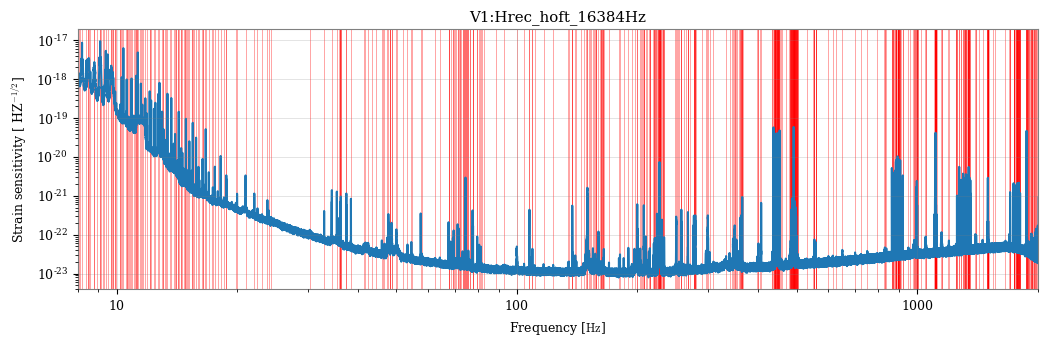
Figure 1: high-resolution sensitivity curve with red lines corresponding to the identified spectral lines. Refer to the PDF file for the details.
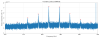
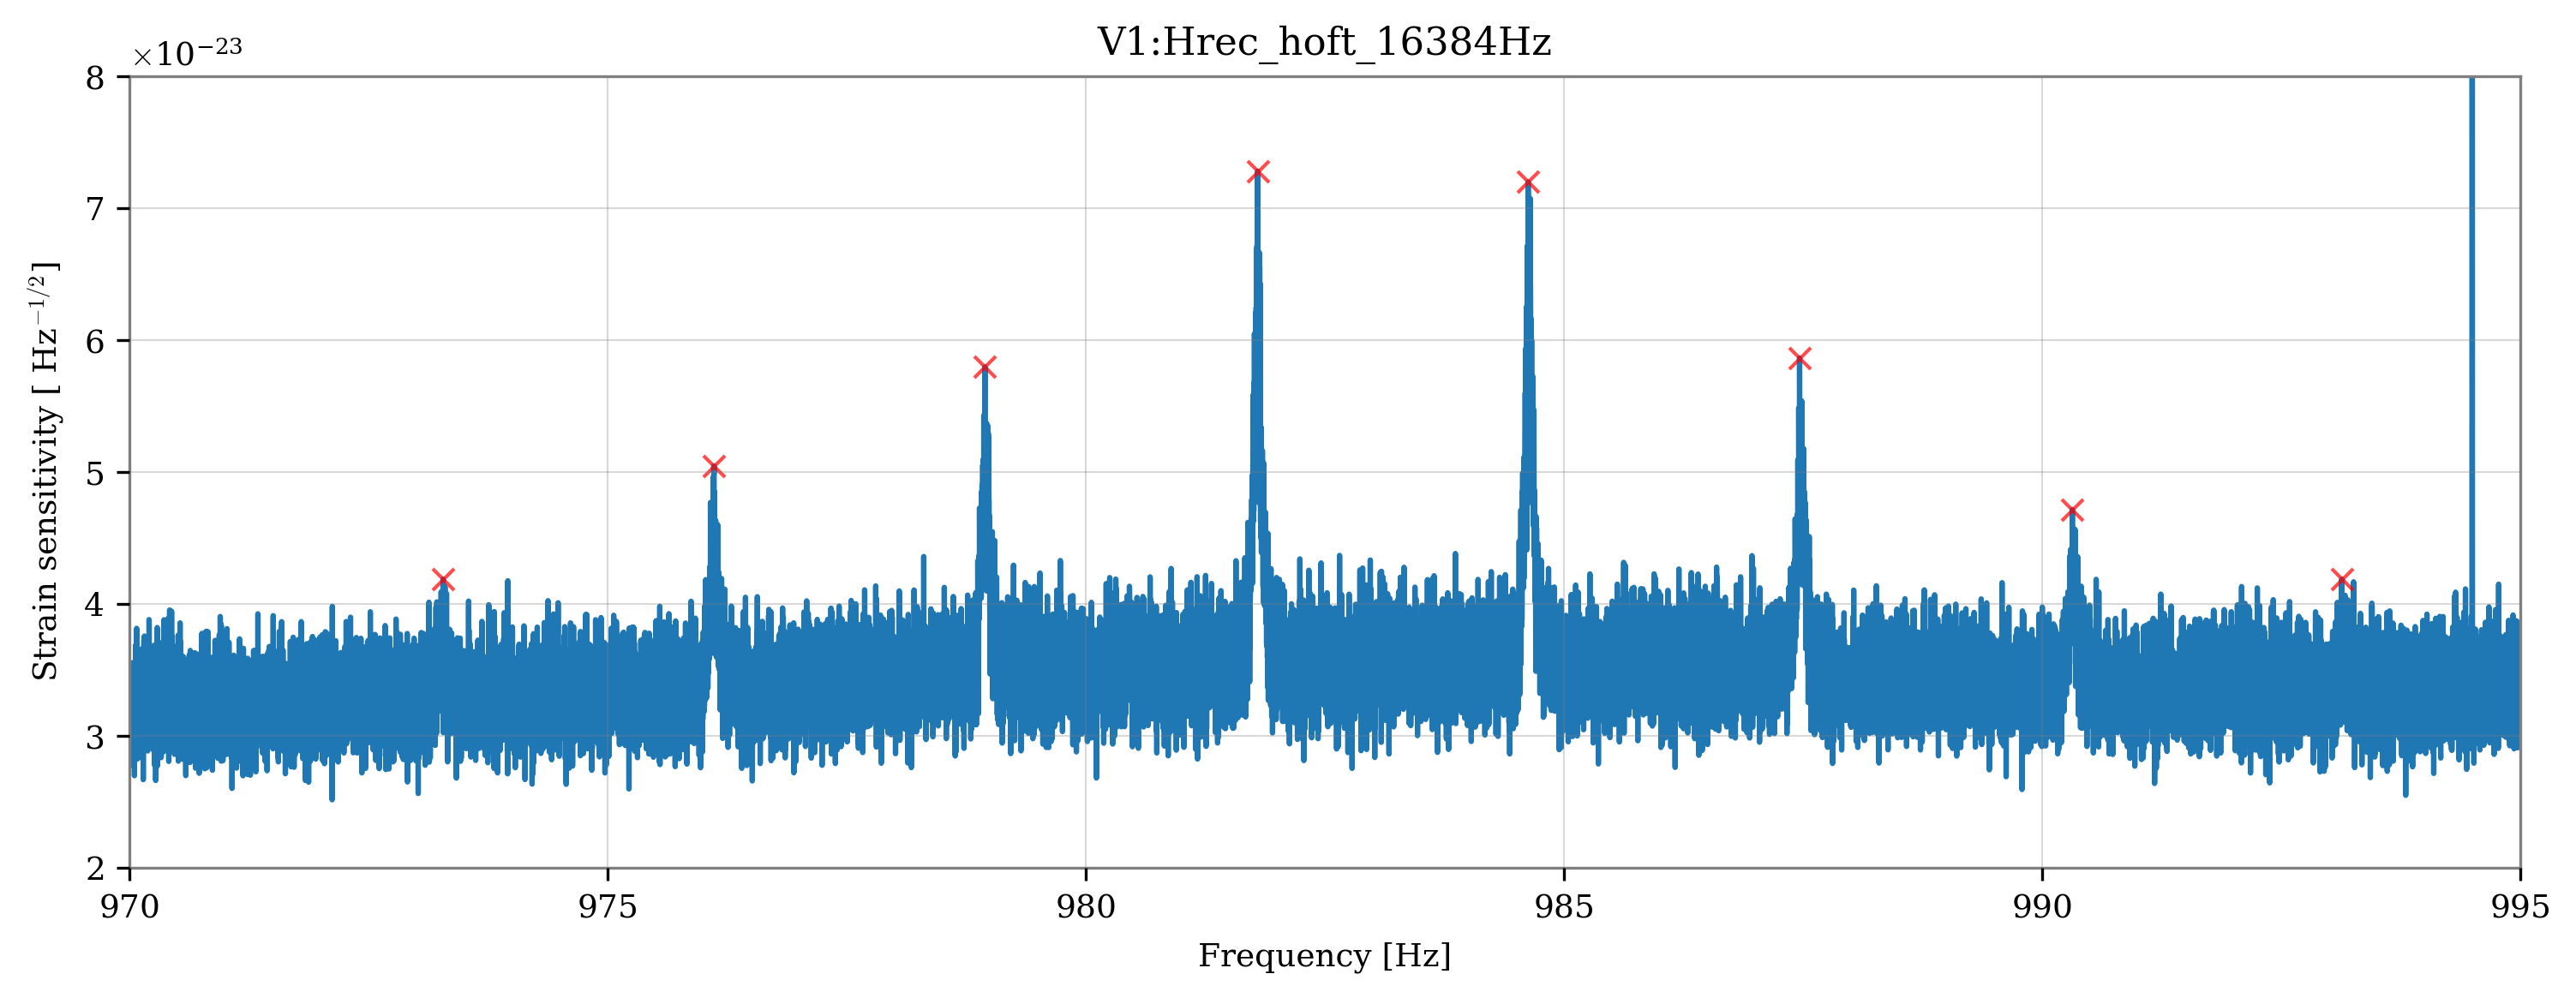
Figure 2: detail of the 970-995 Hz region, showing a comb of lines spaced about ~2.83 Hz (0.35 sec).
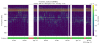
Figure 3: spectrogram of the 955-1005 Hz region, showing the wandering line already documented in these logbook entries: #60093, #61873.