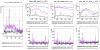
The shaker was placed on the tower base given the forthcoming investigation of the scattered light source at WE: https://git.ligo.org/virgo/commissioning/commissioning-tasks/-/issues/62

Today, we performed the investigation of scattered light at WE. The main actions are the following and details are reported in the attached file:
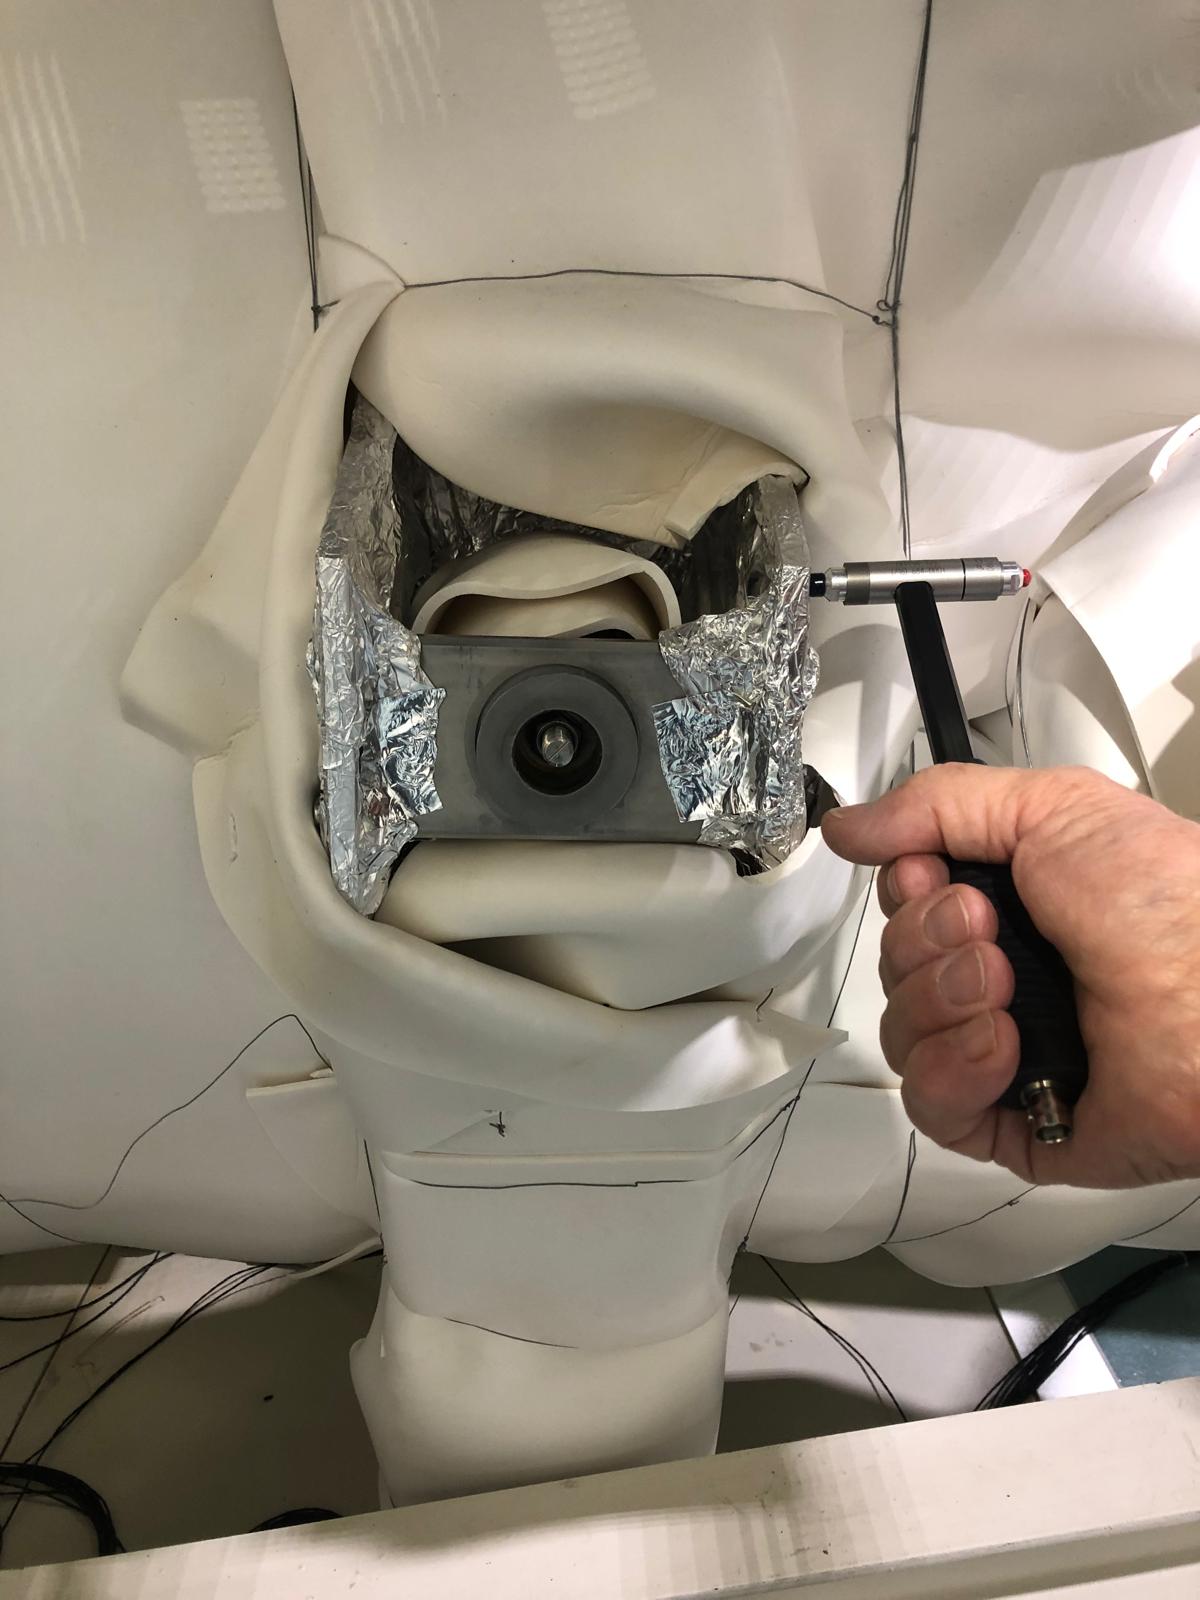
- displacement of TCS in vacuum mirror supports acting on stepping motors
- tapping with small hammer in the following locations:
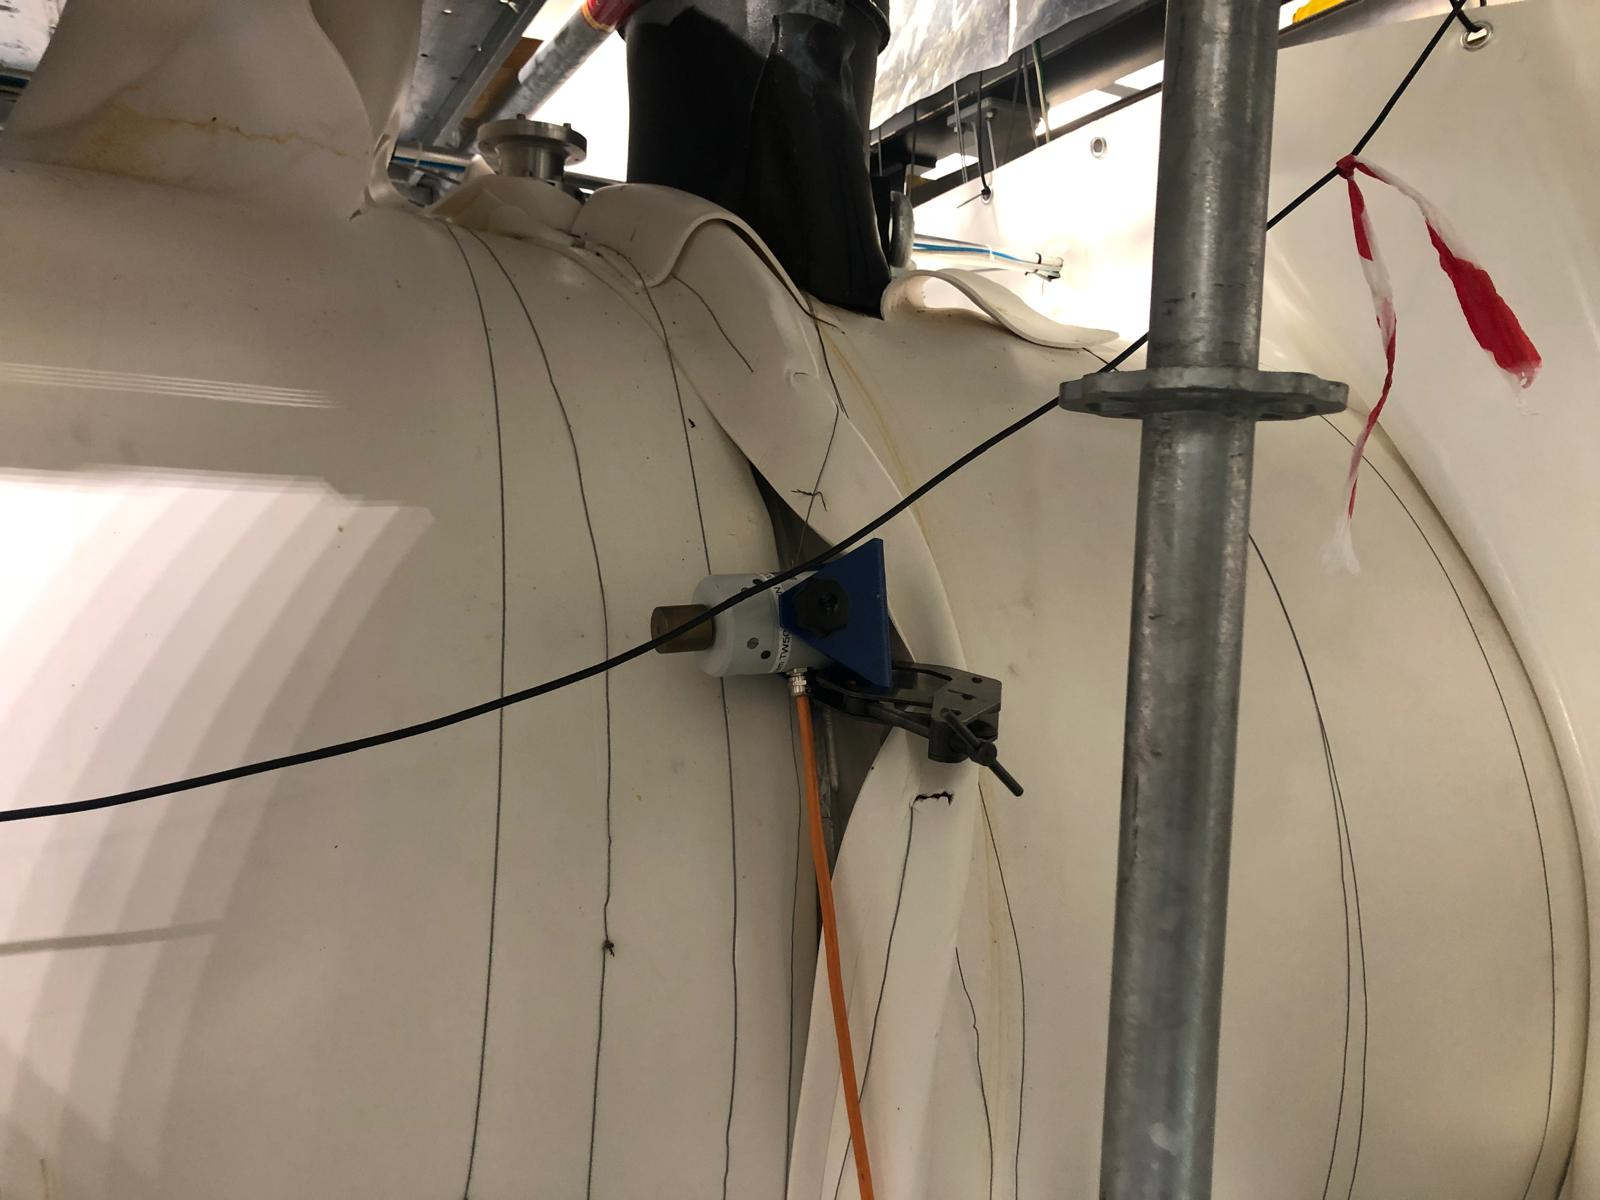
- cryotrap holding points
- structure around cryotrap holding point
- cryotrap chamber in proximity of baffle (near CT accelerometer)
- 1200 flange HR mirror side
- 1200 flange AR mirror side
- near bellow
- vacuum chamber near mirror (cylindric vacuum pipe)
- middle flange of the WE-SWEB vacuum pipe
- metallic support of photon calibrator bench
- flange of VAT valve
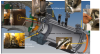
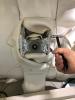
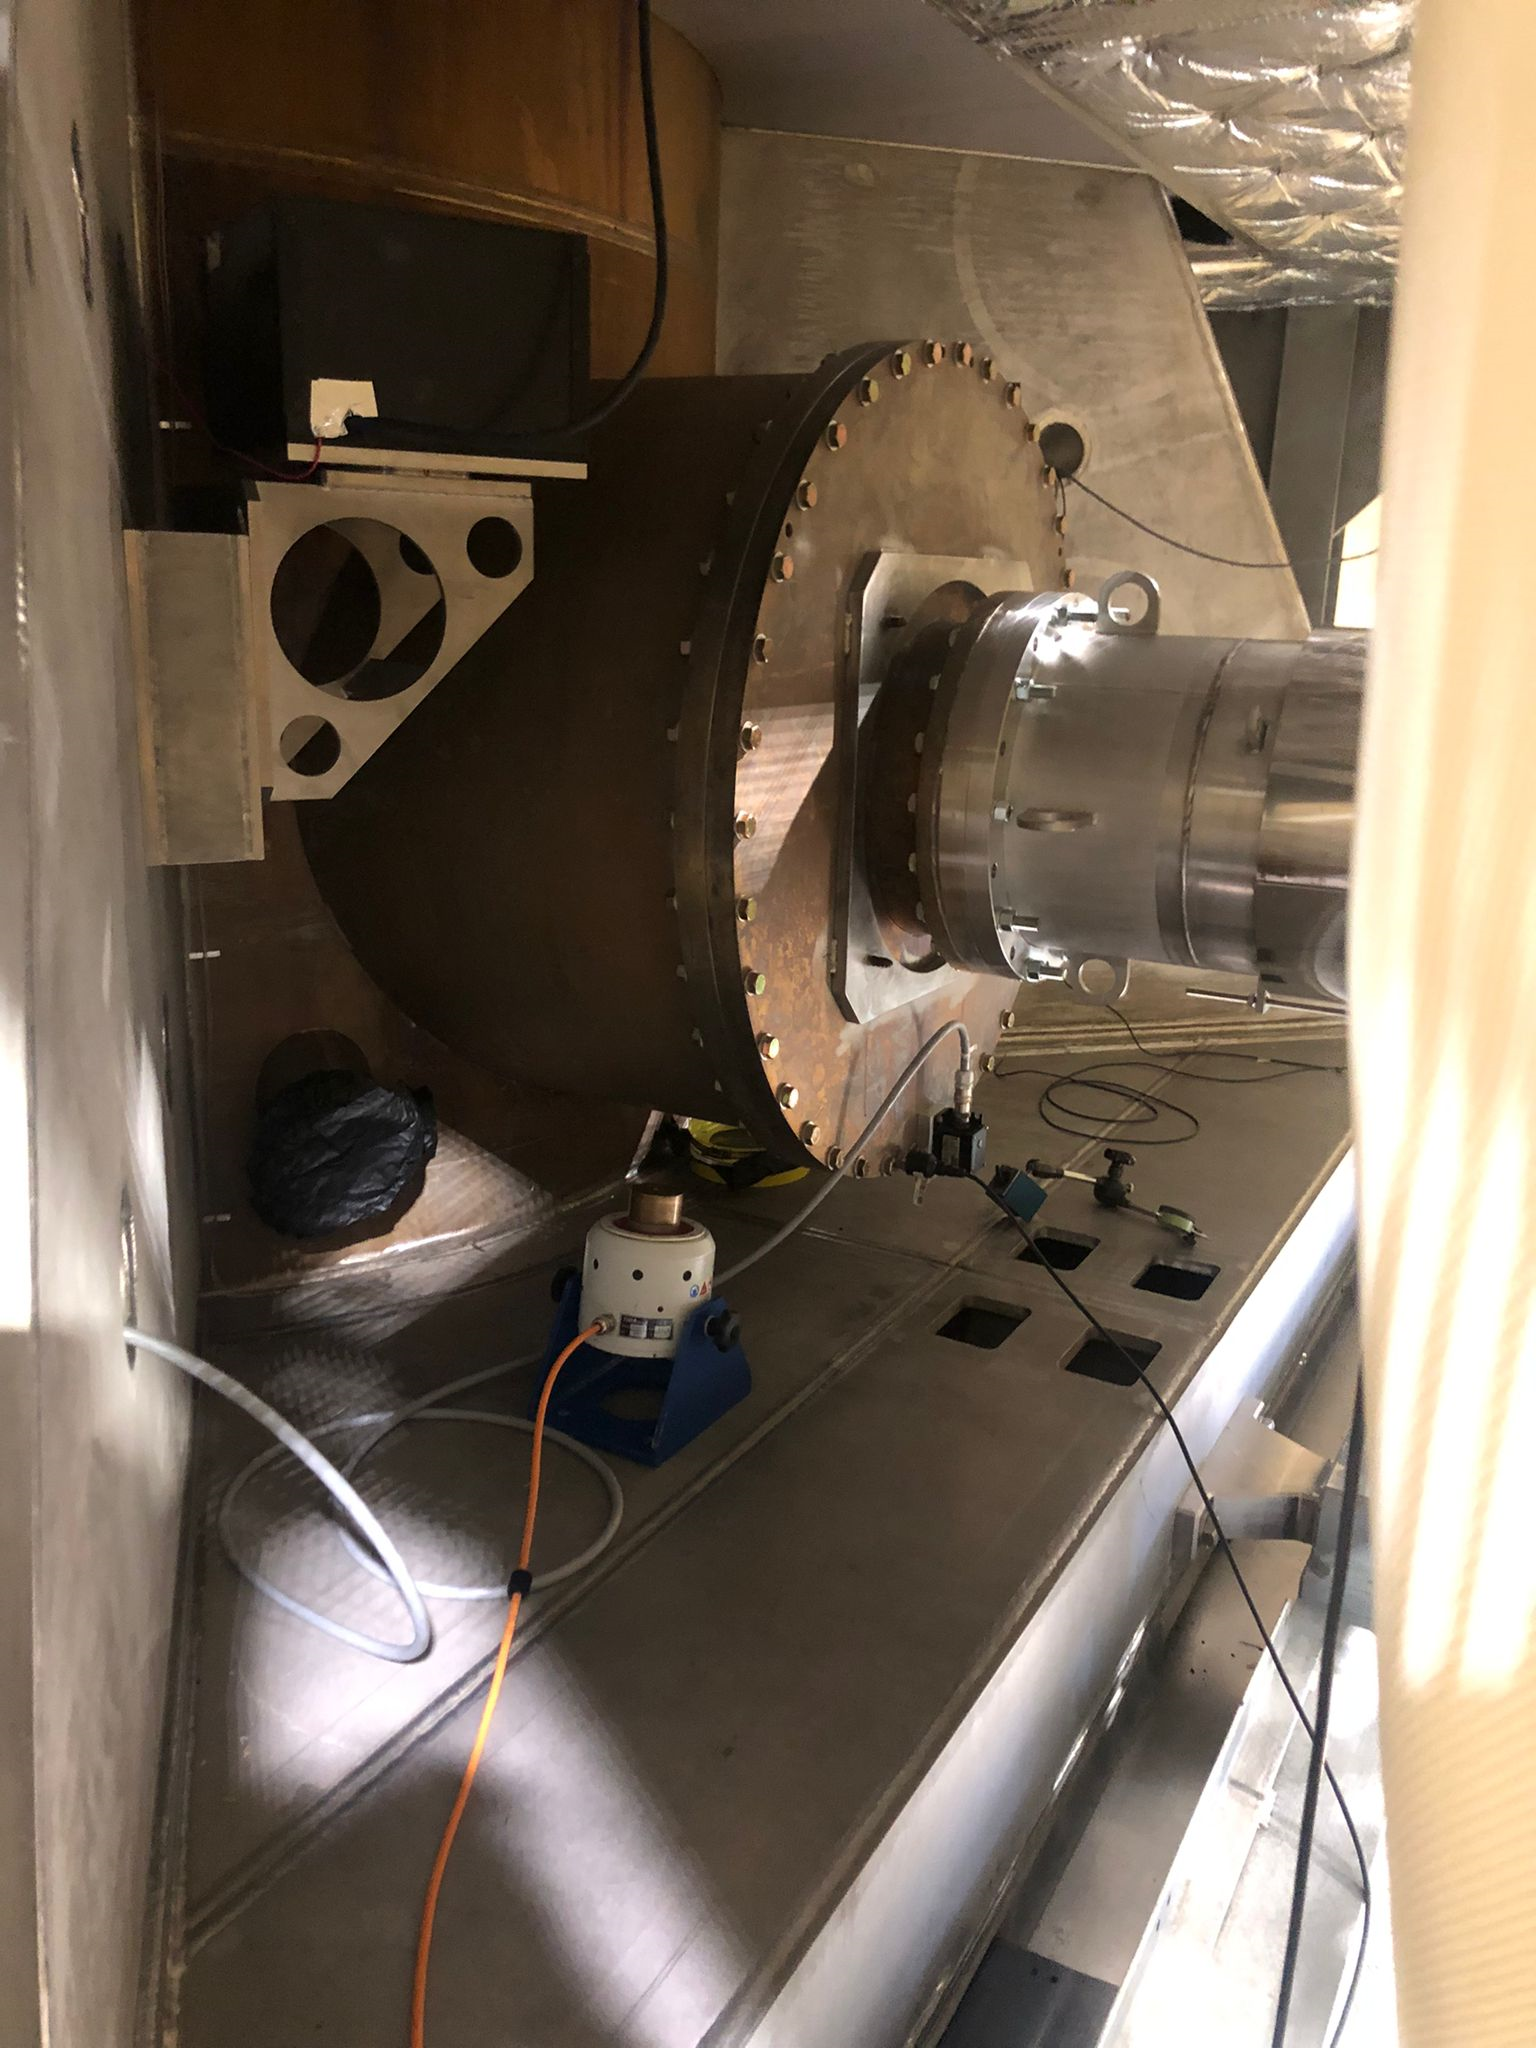
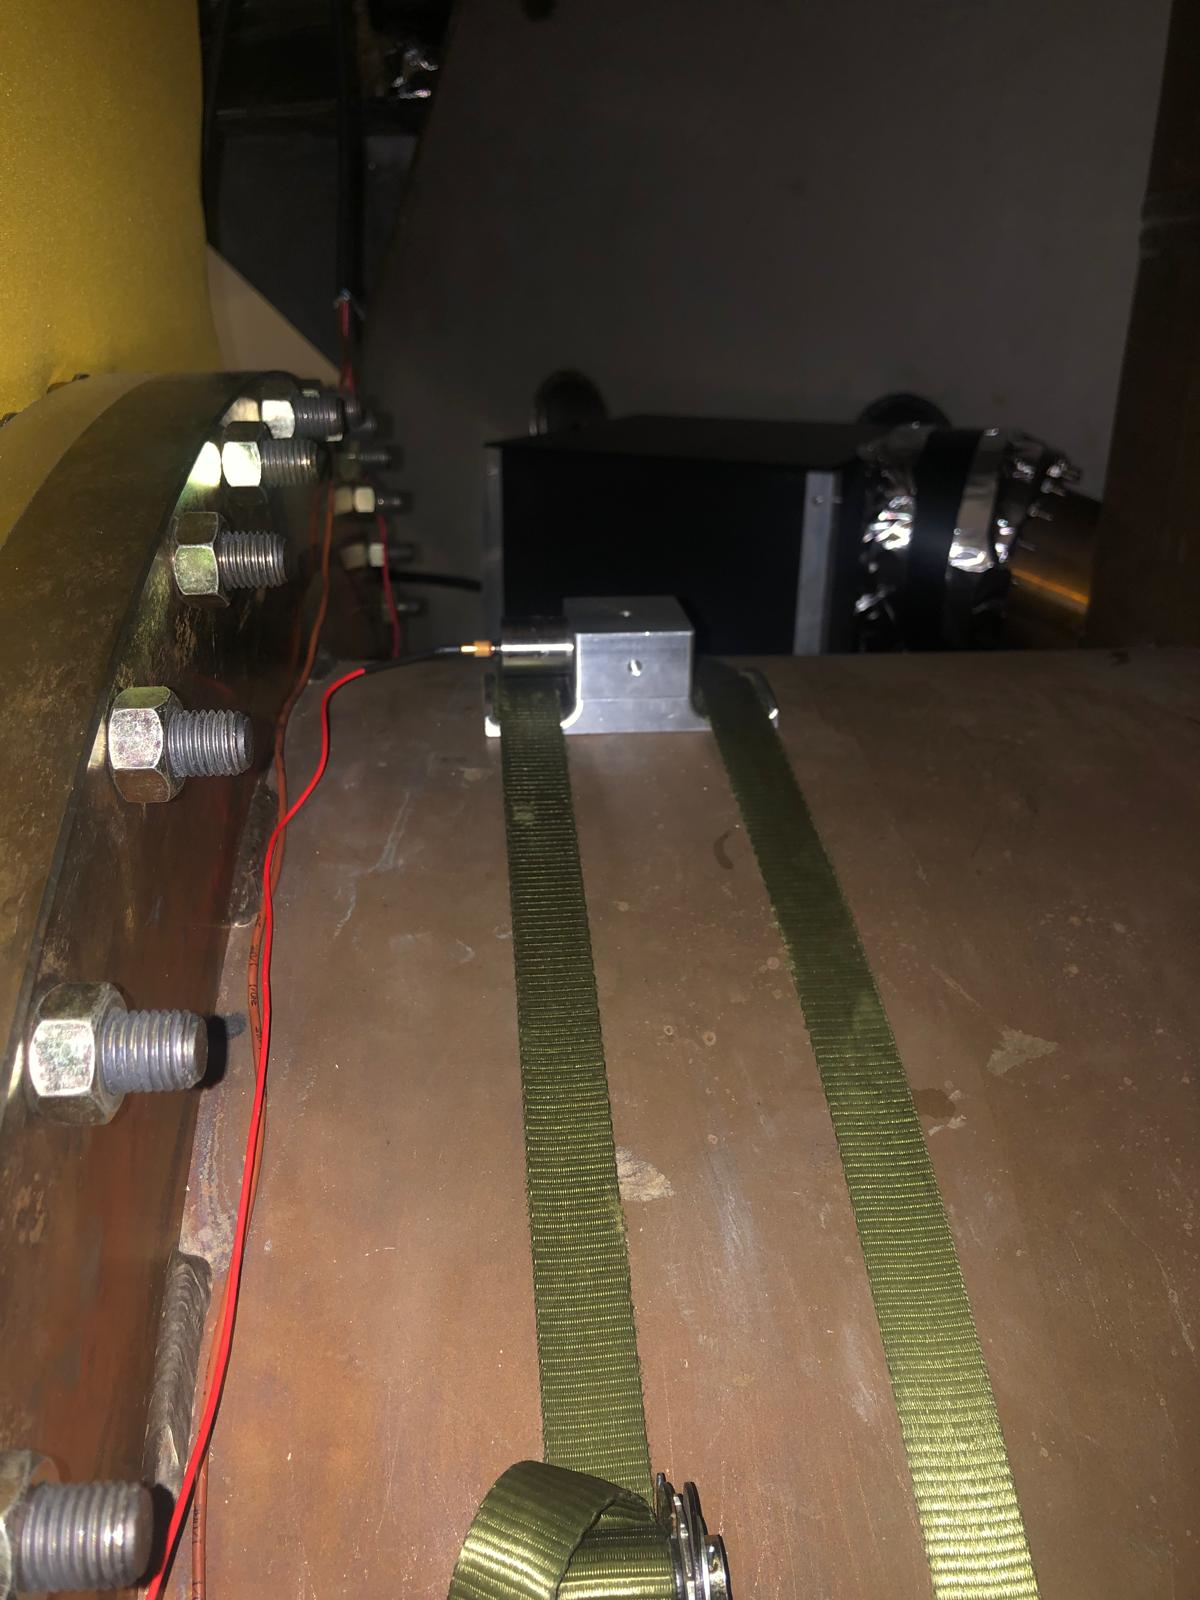
- near position of the clamped small shaker (see Fig)
- colored noise injection (40-200)Hz with big shaker located on tower base - AR mirror side
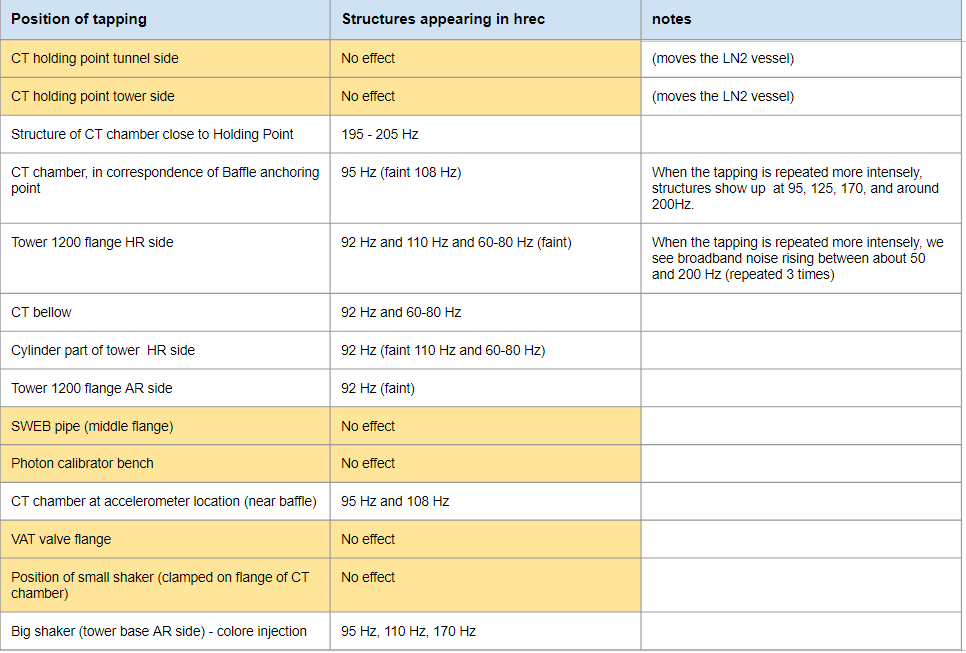
Tapping in locations n. 3) 4) 7) 11) excited some structures in the Hrec spectrum around (90 - 200) Hz.
We performed further actions in CEB:
- switch-on permanent particle counter network
- switch-off/on in-vacuum temperature probes
A detailed analysis will follow.

We summarize the results of the analysis.
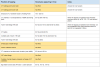
Fig. 1: The table reports the effect observed in Hrec for each tapping position.
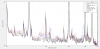
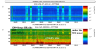
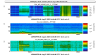
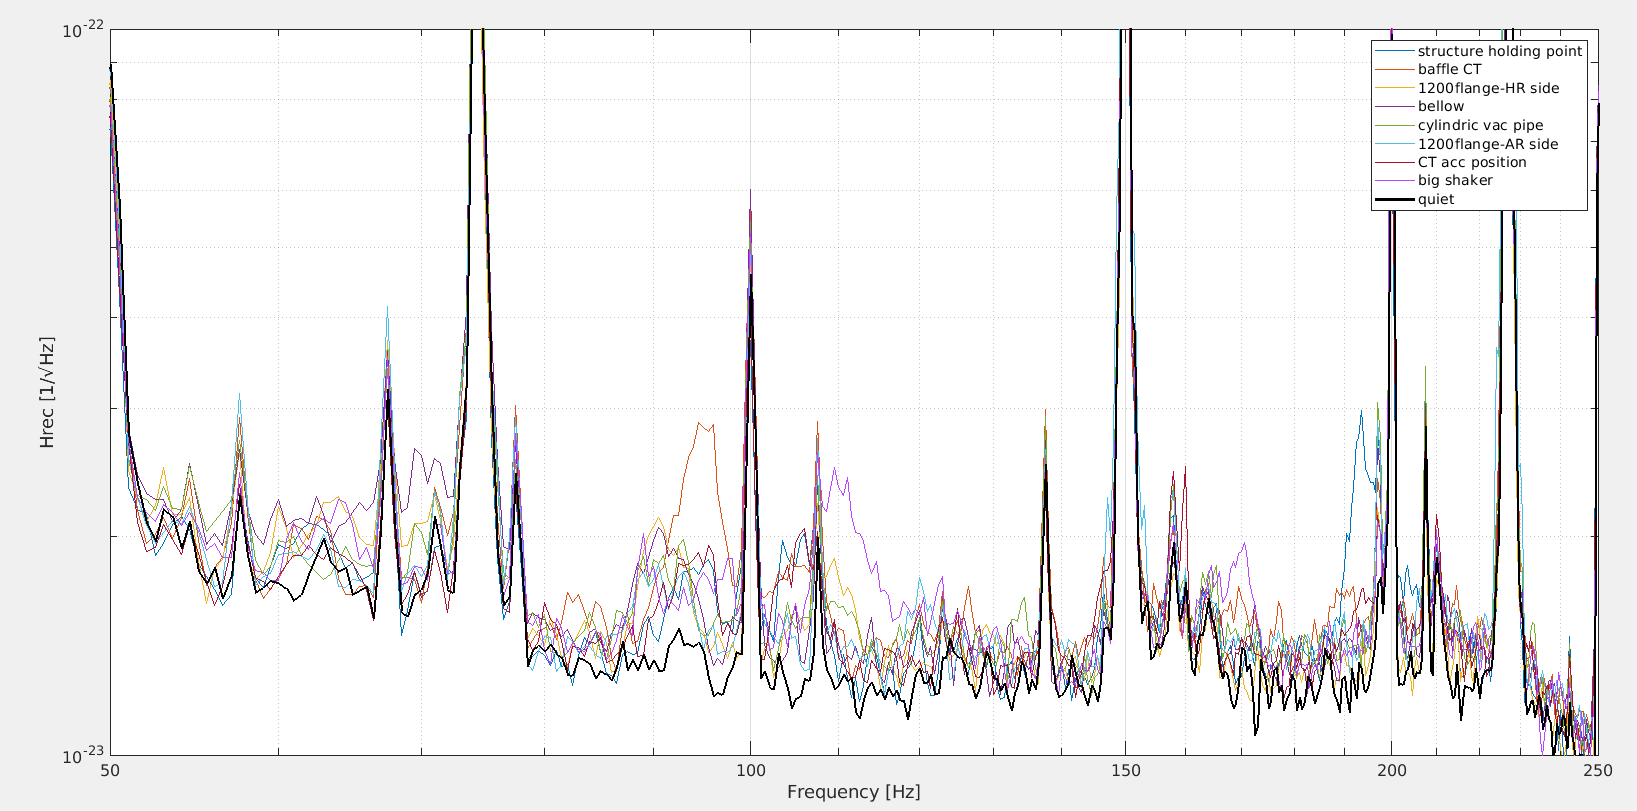
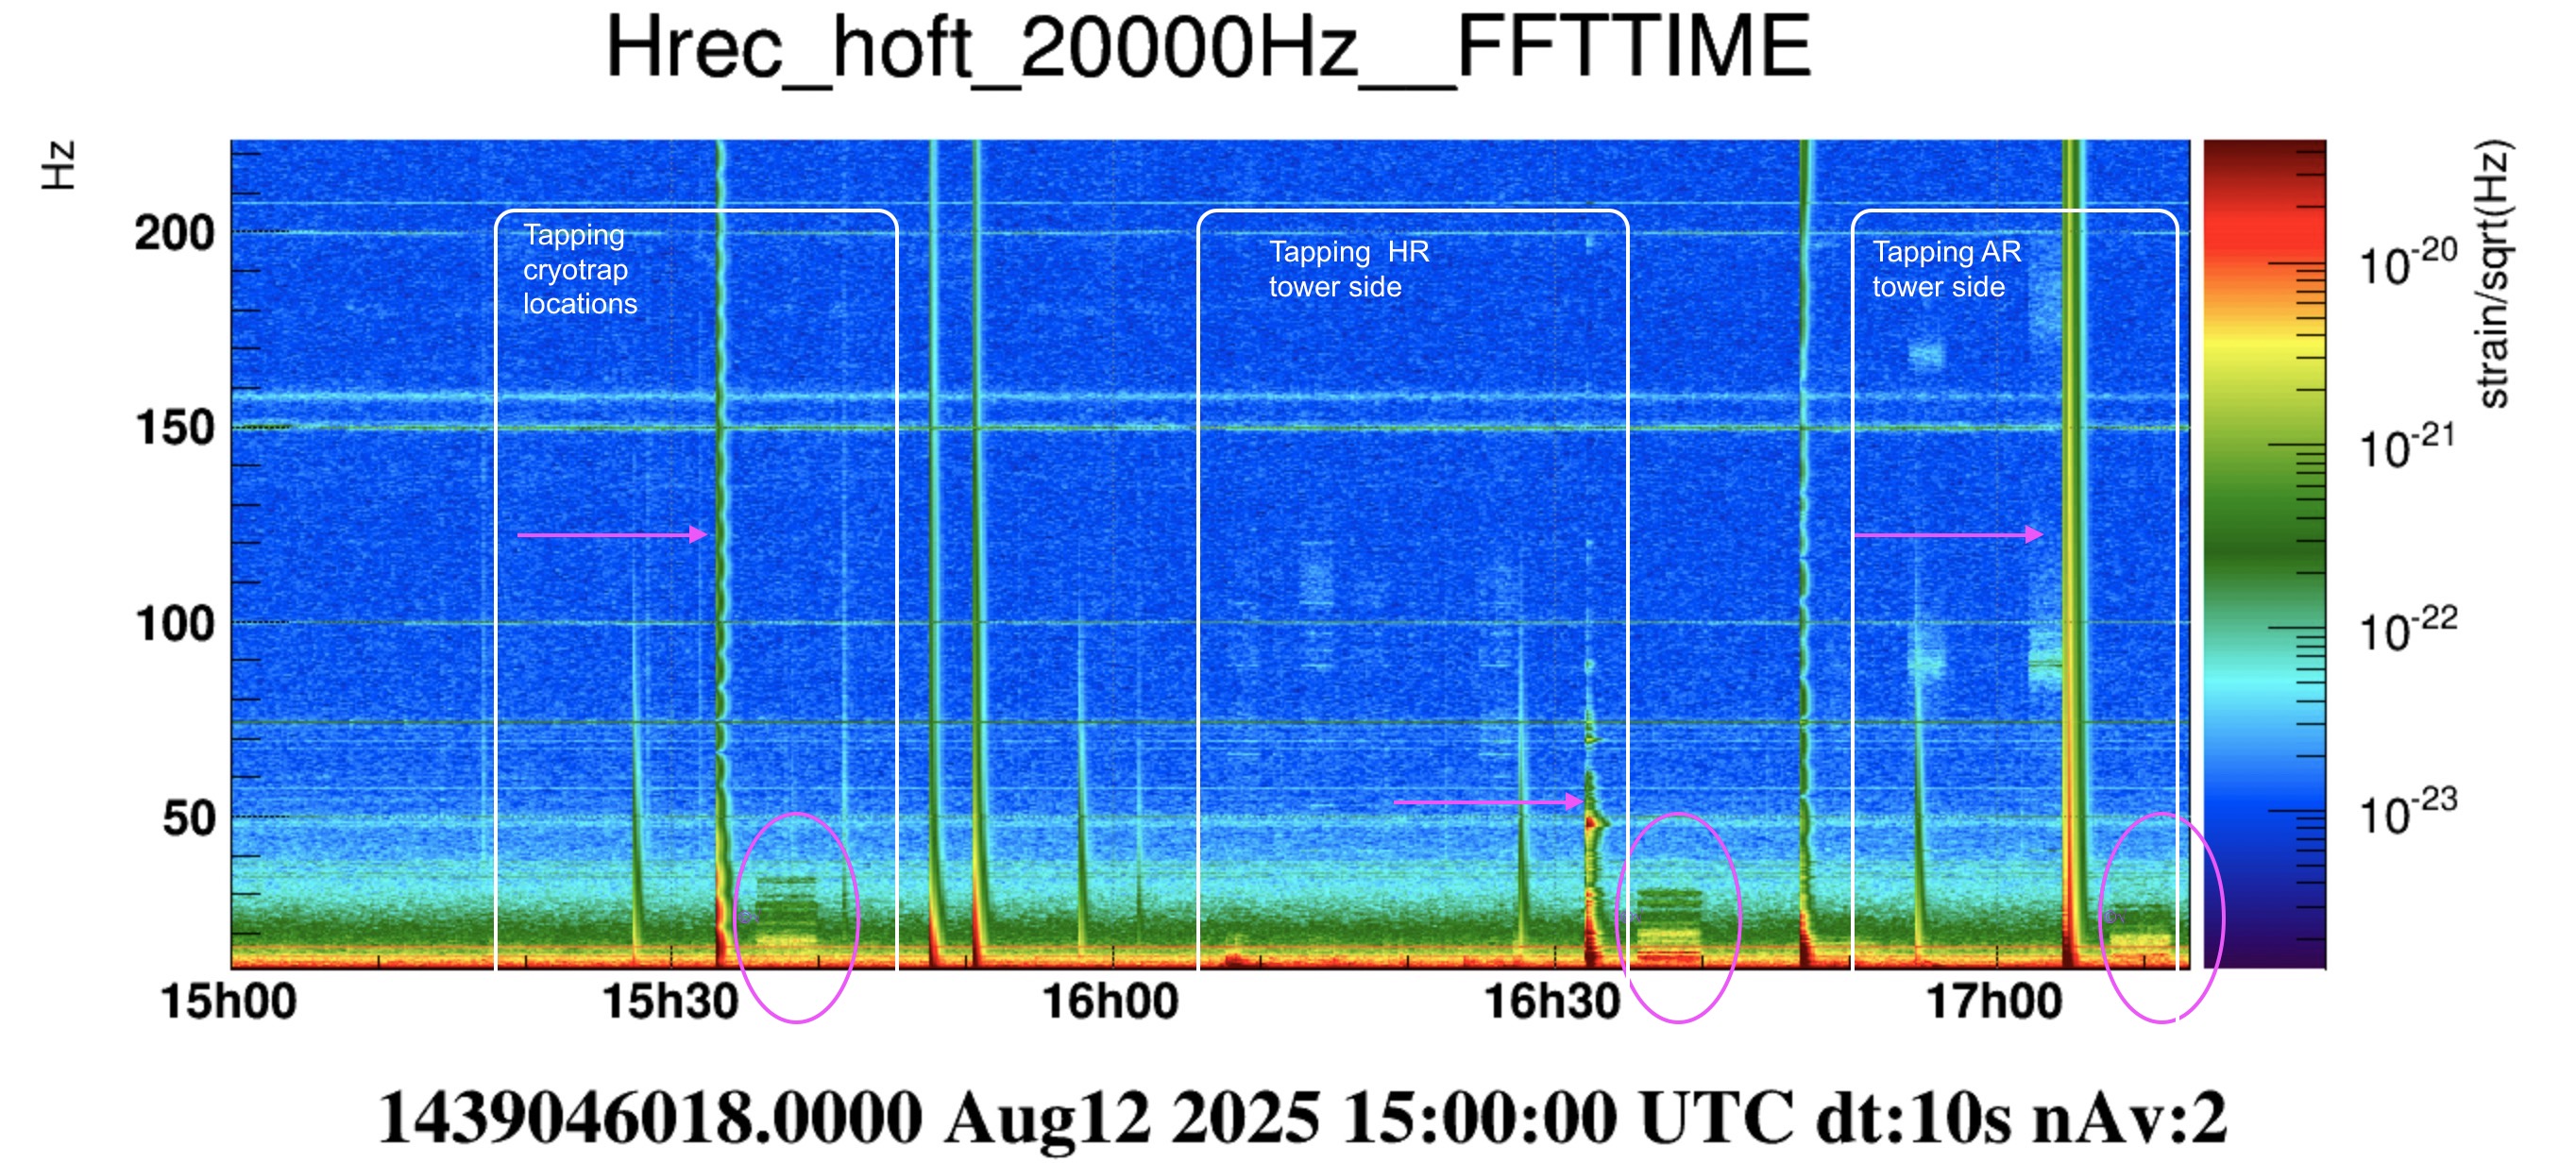
Fig. 2: it is an overview of excited peaks in Hrec which are all in the frequency range (50-250)Hz.
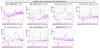
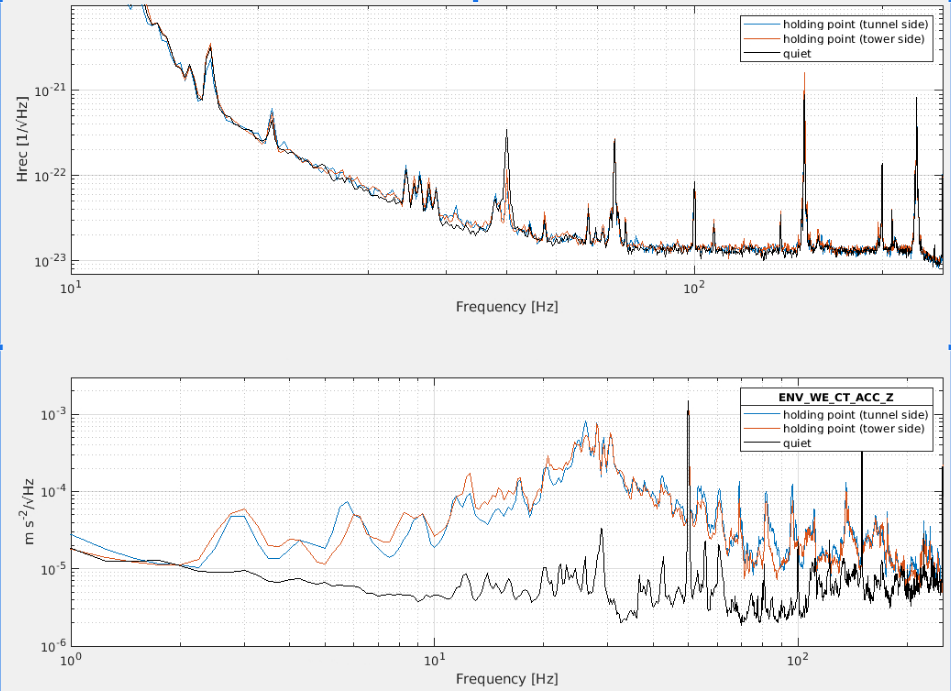
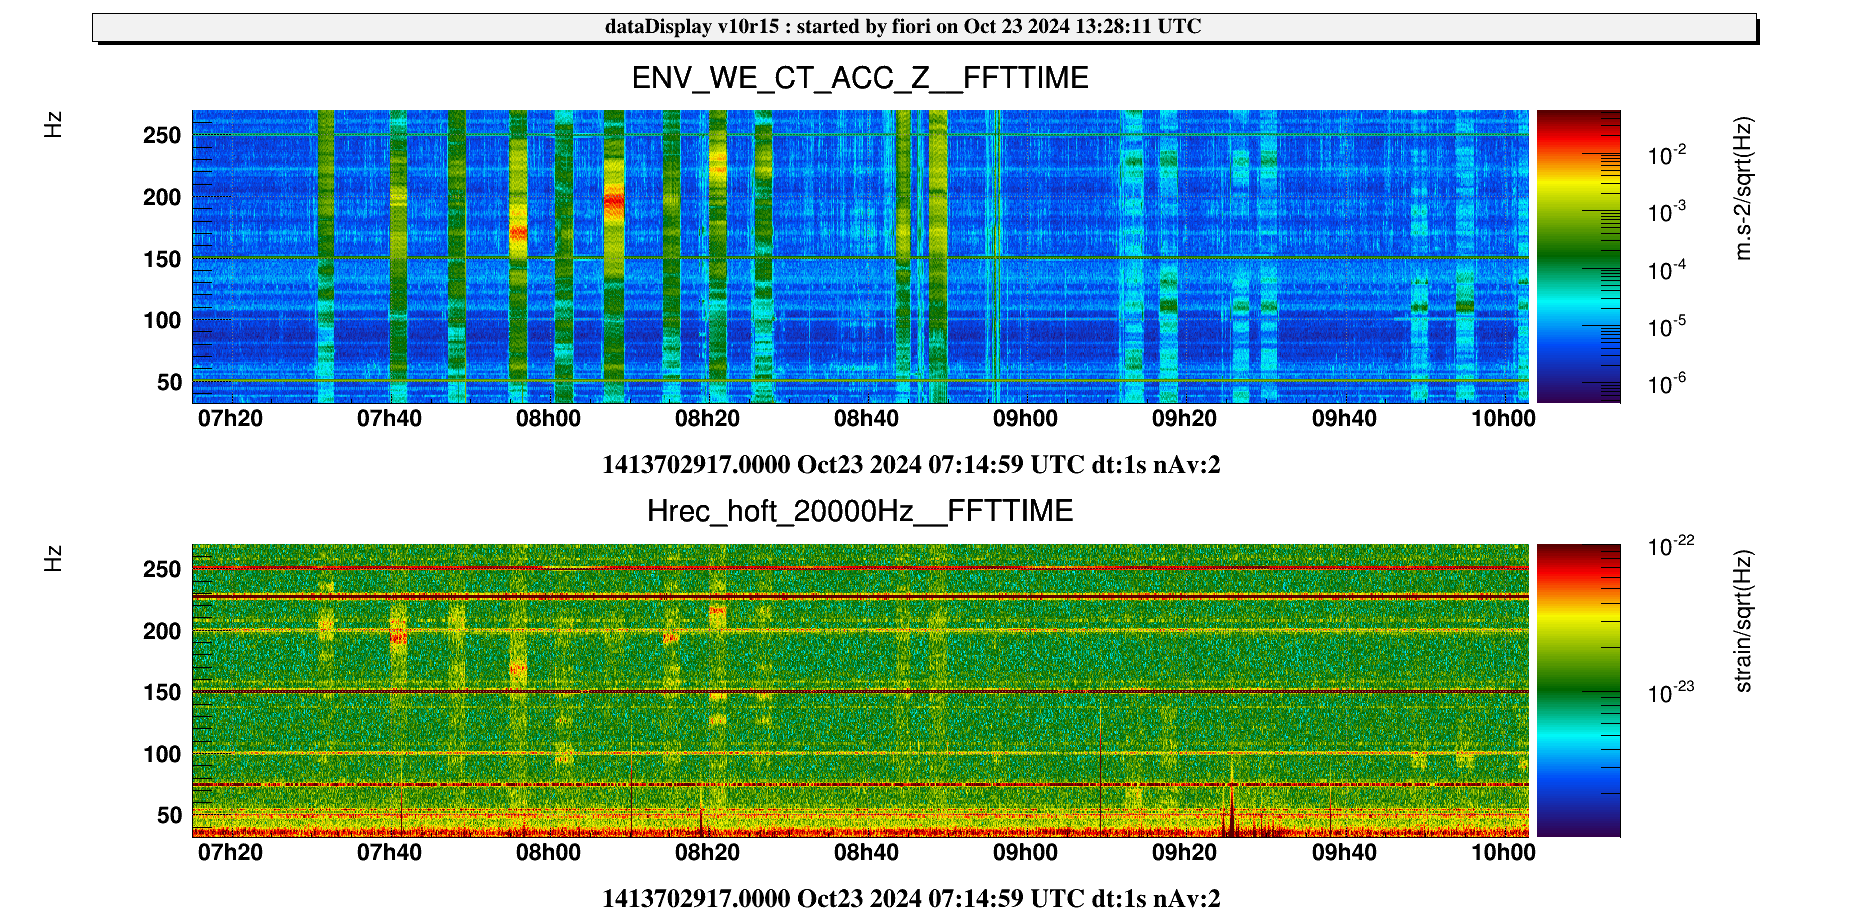
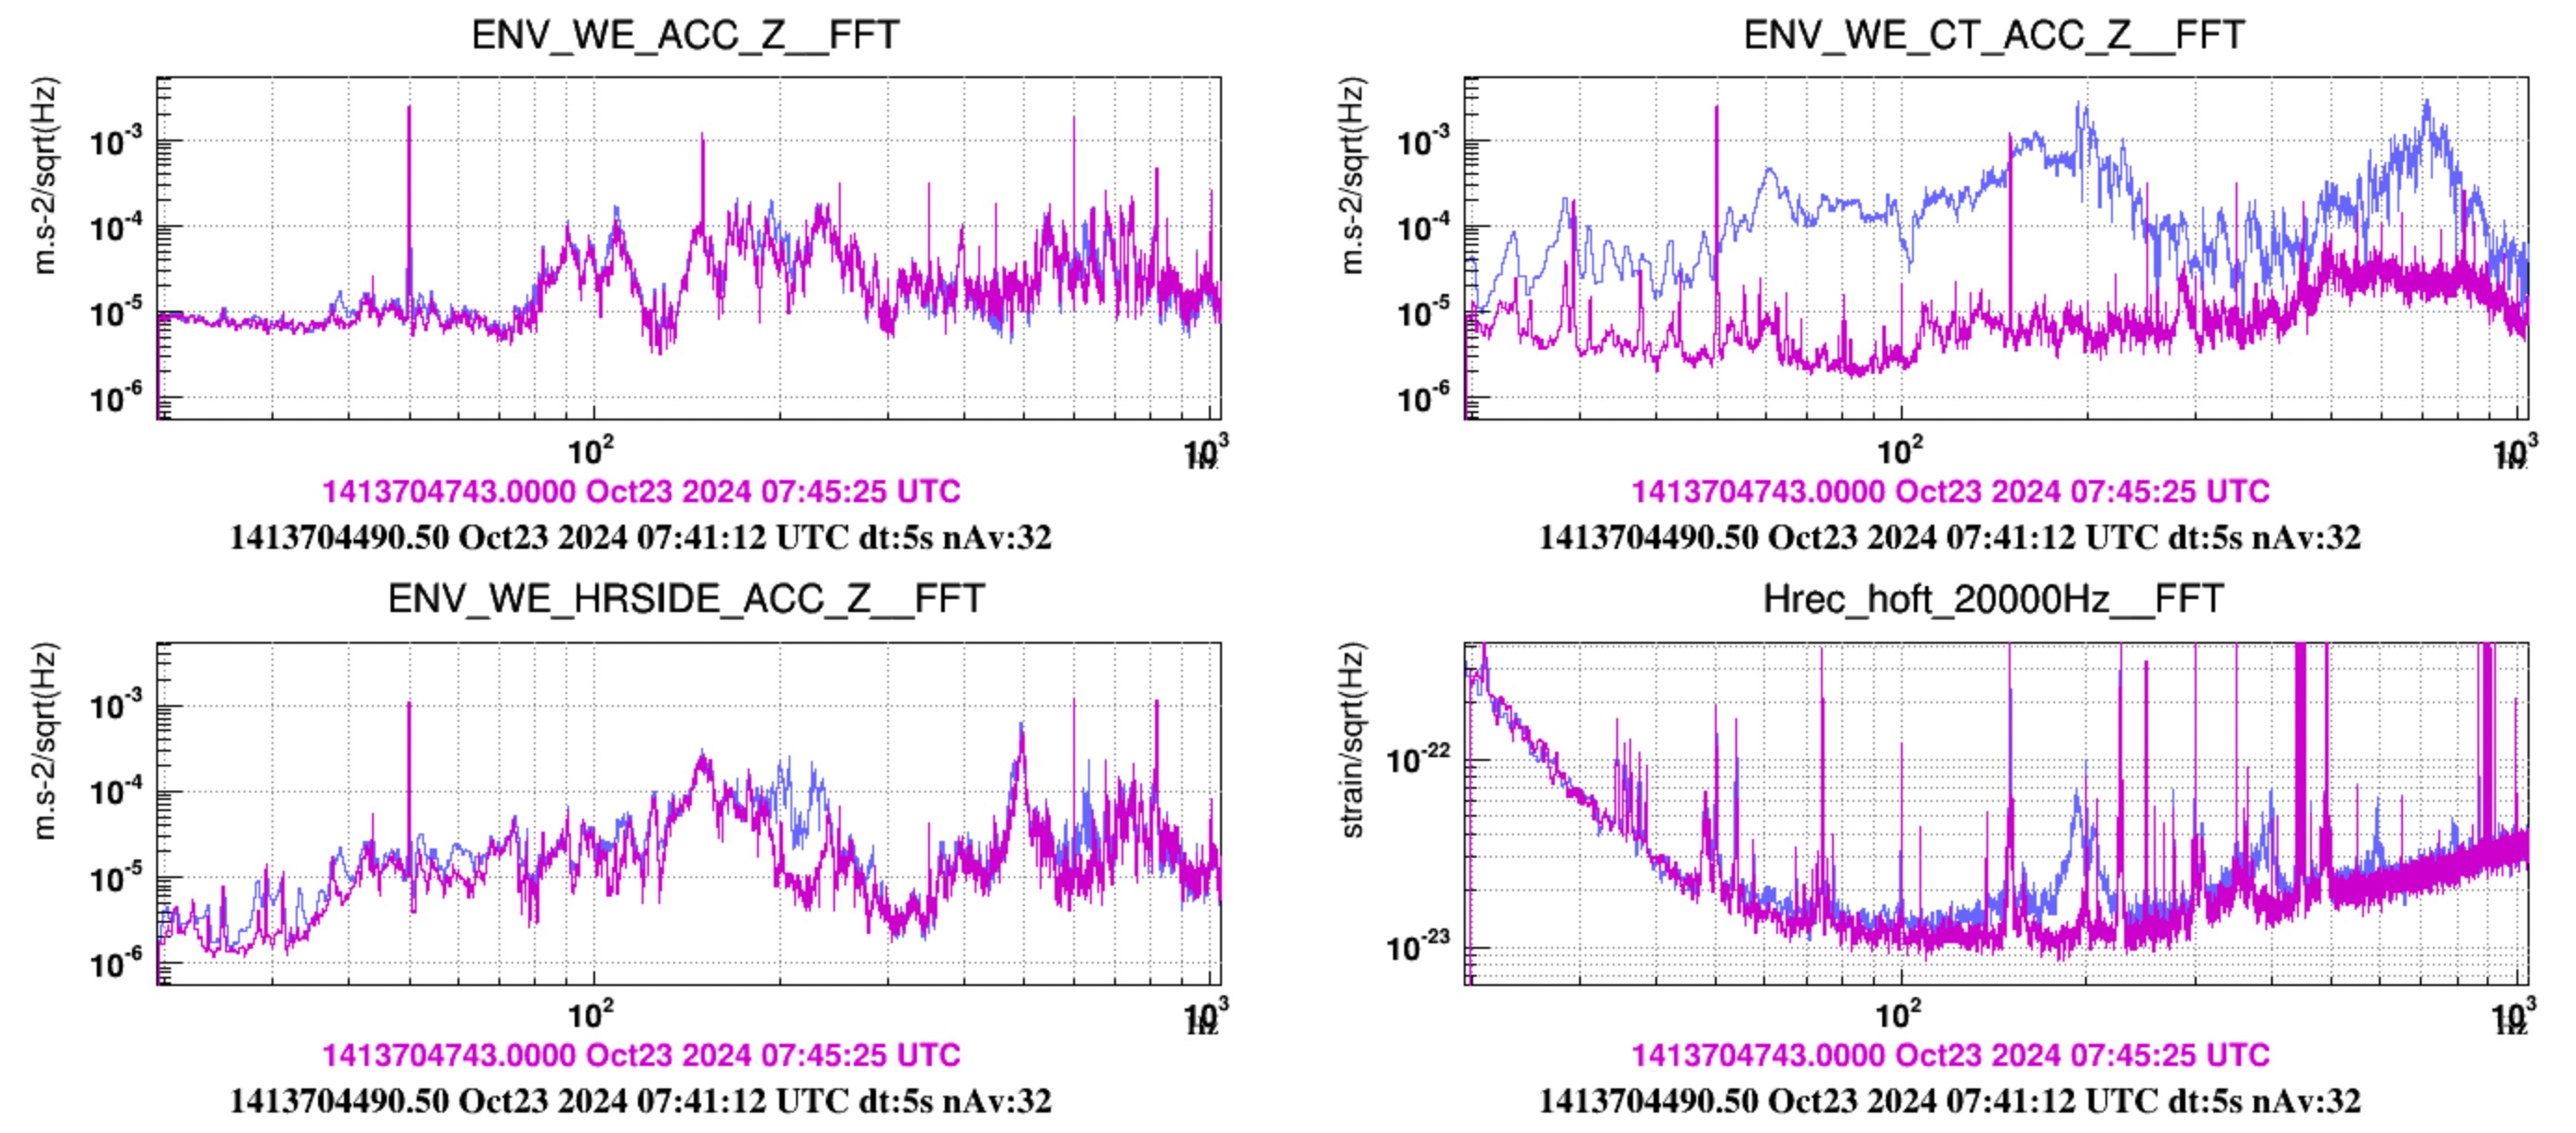
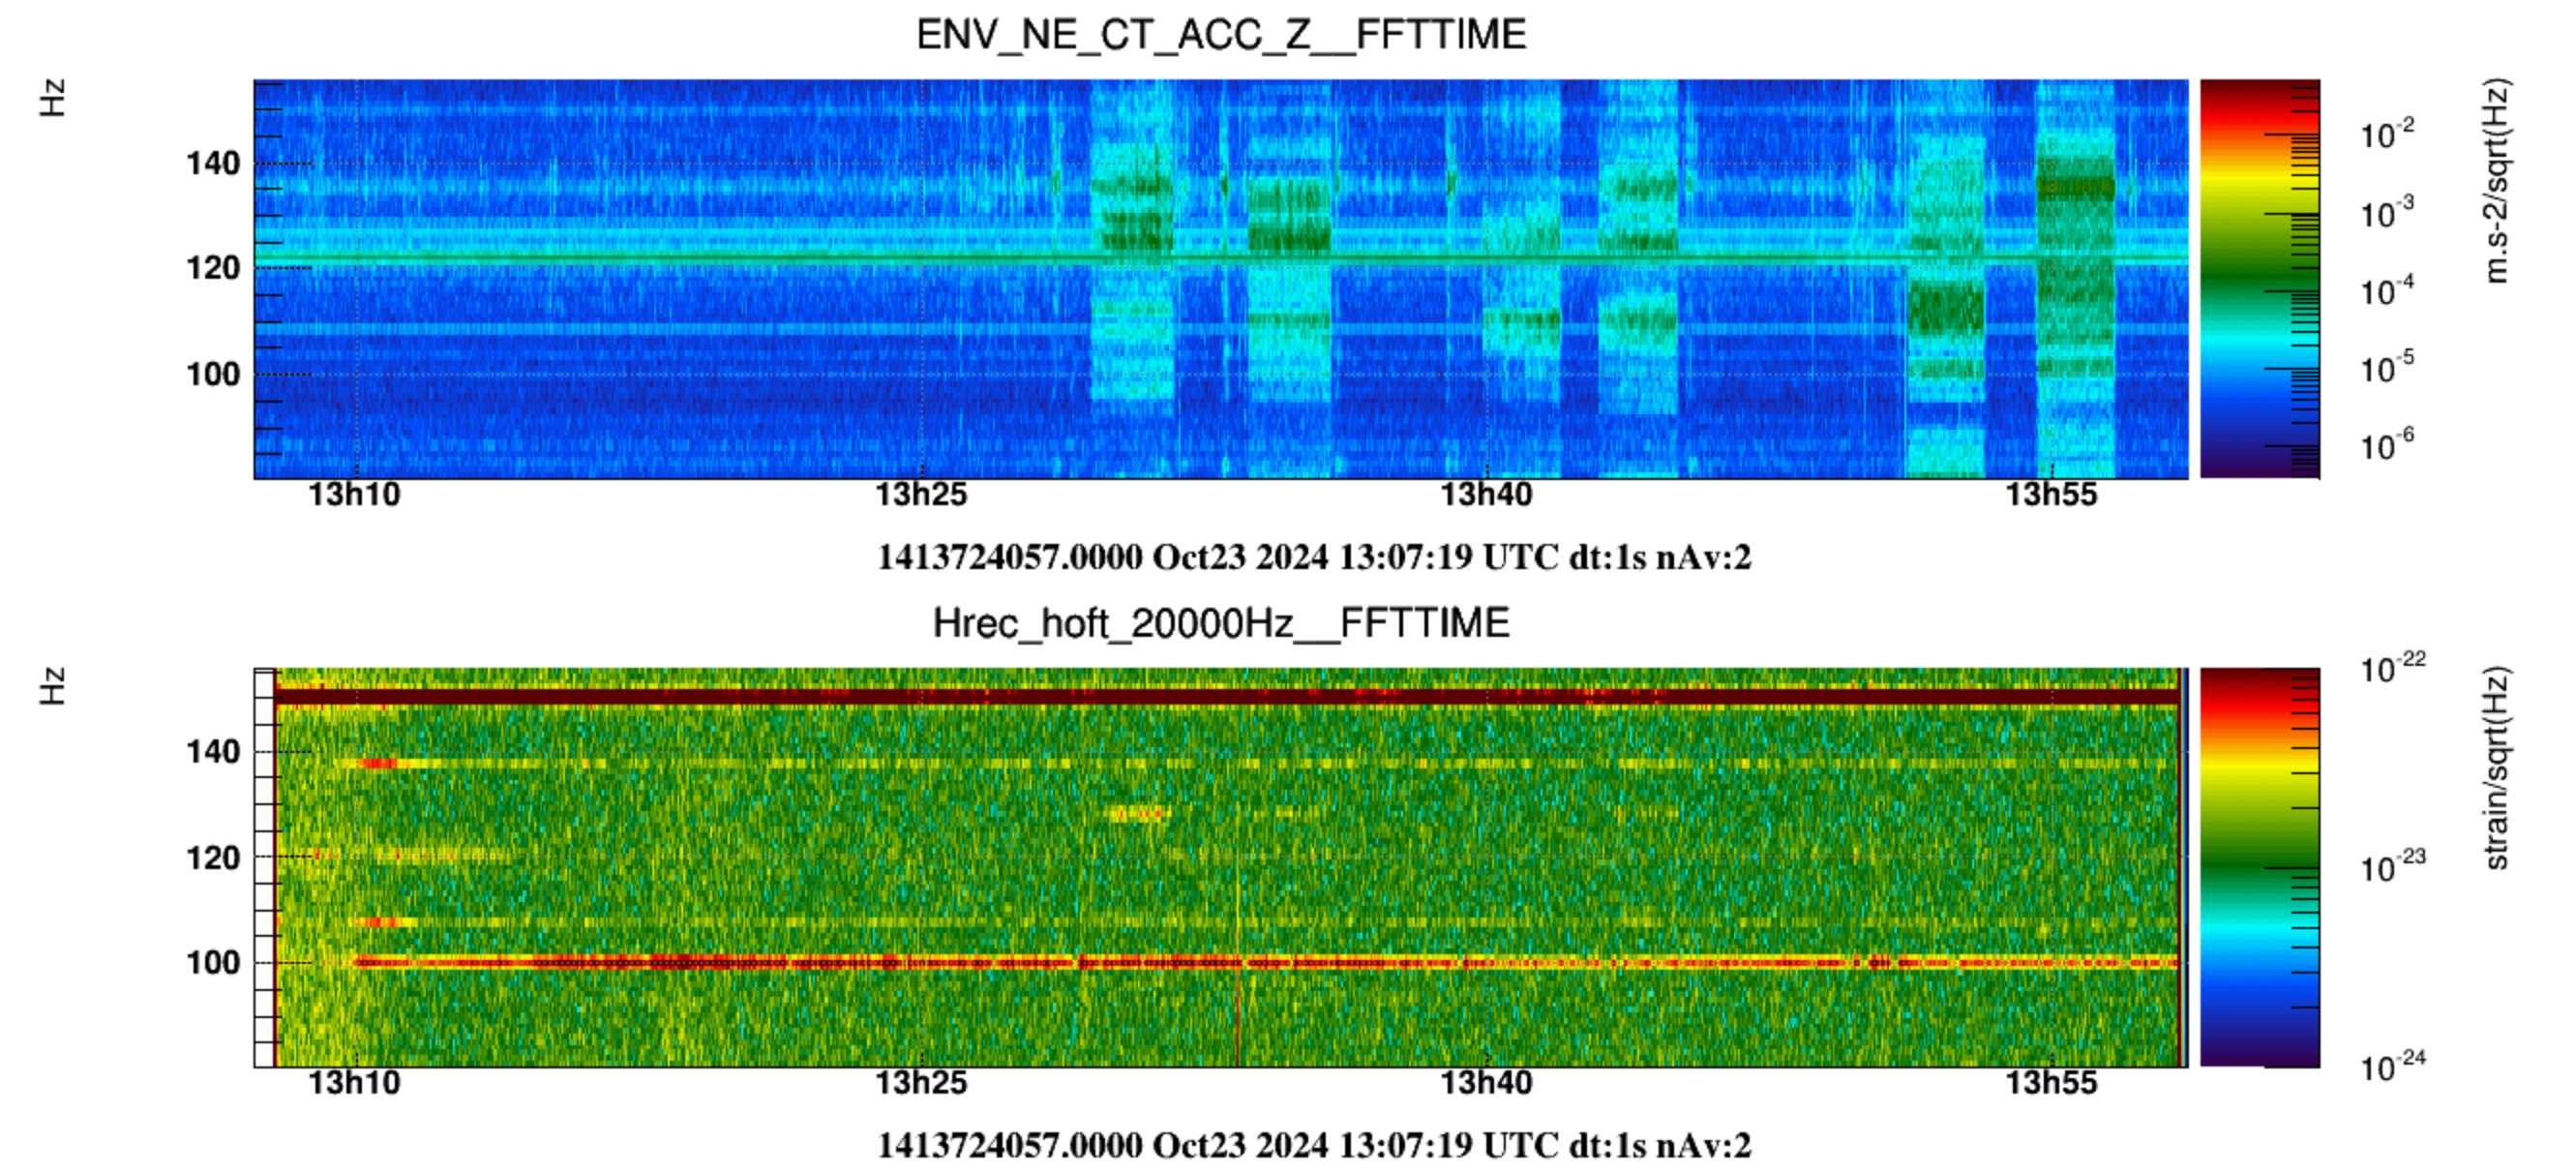
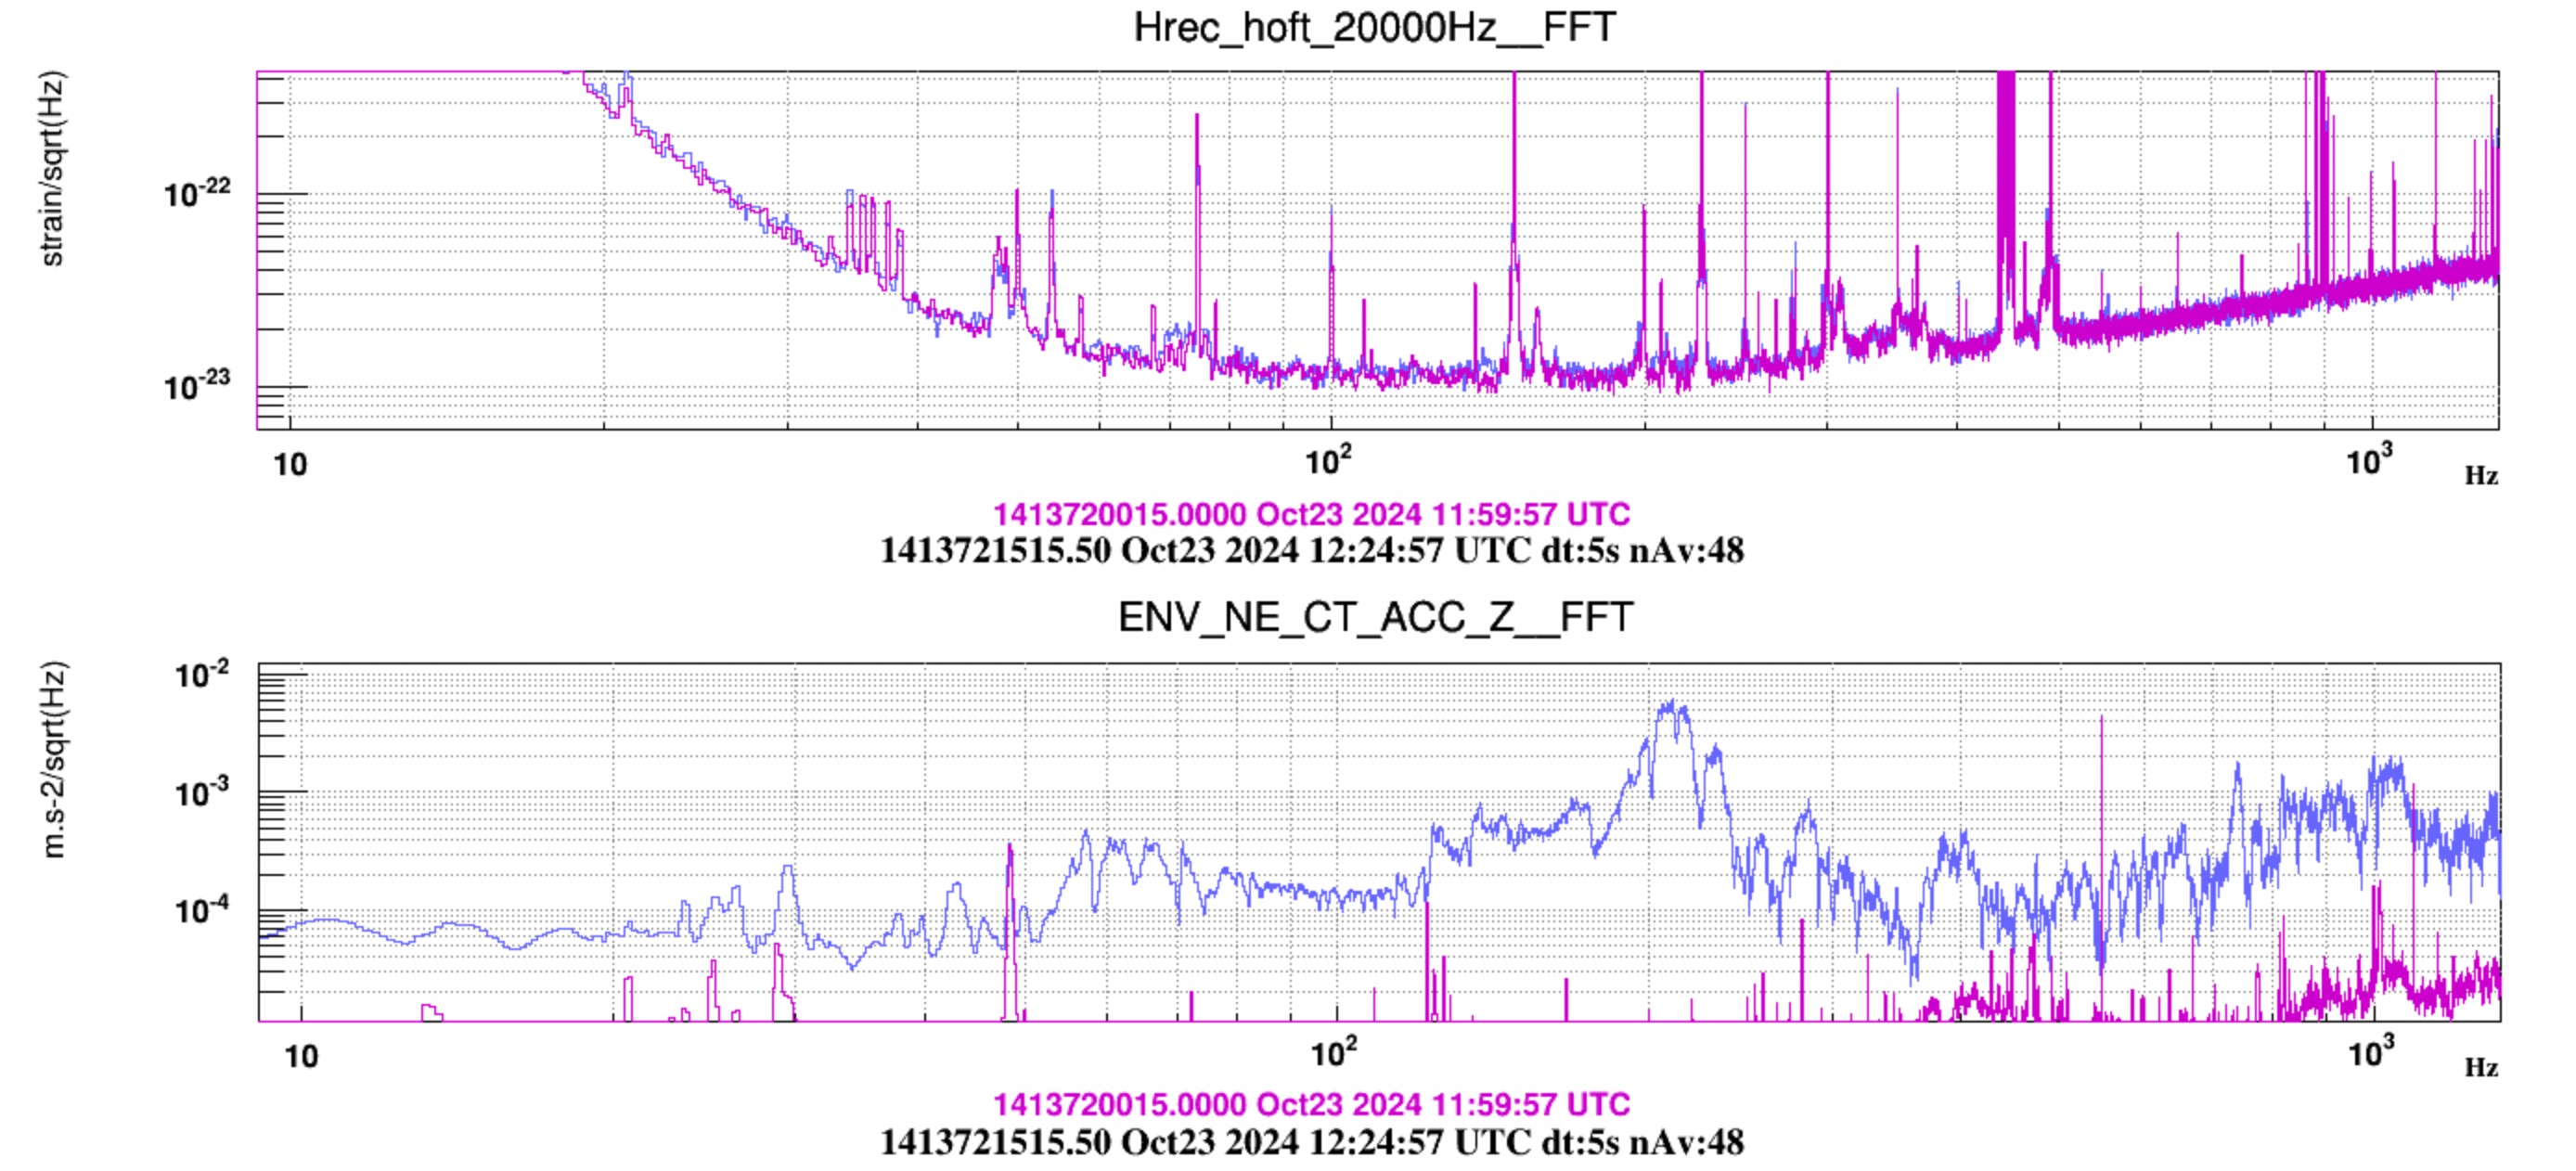
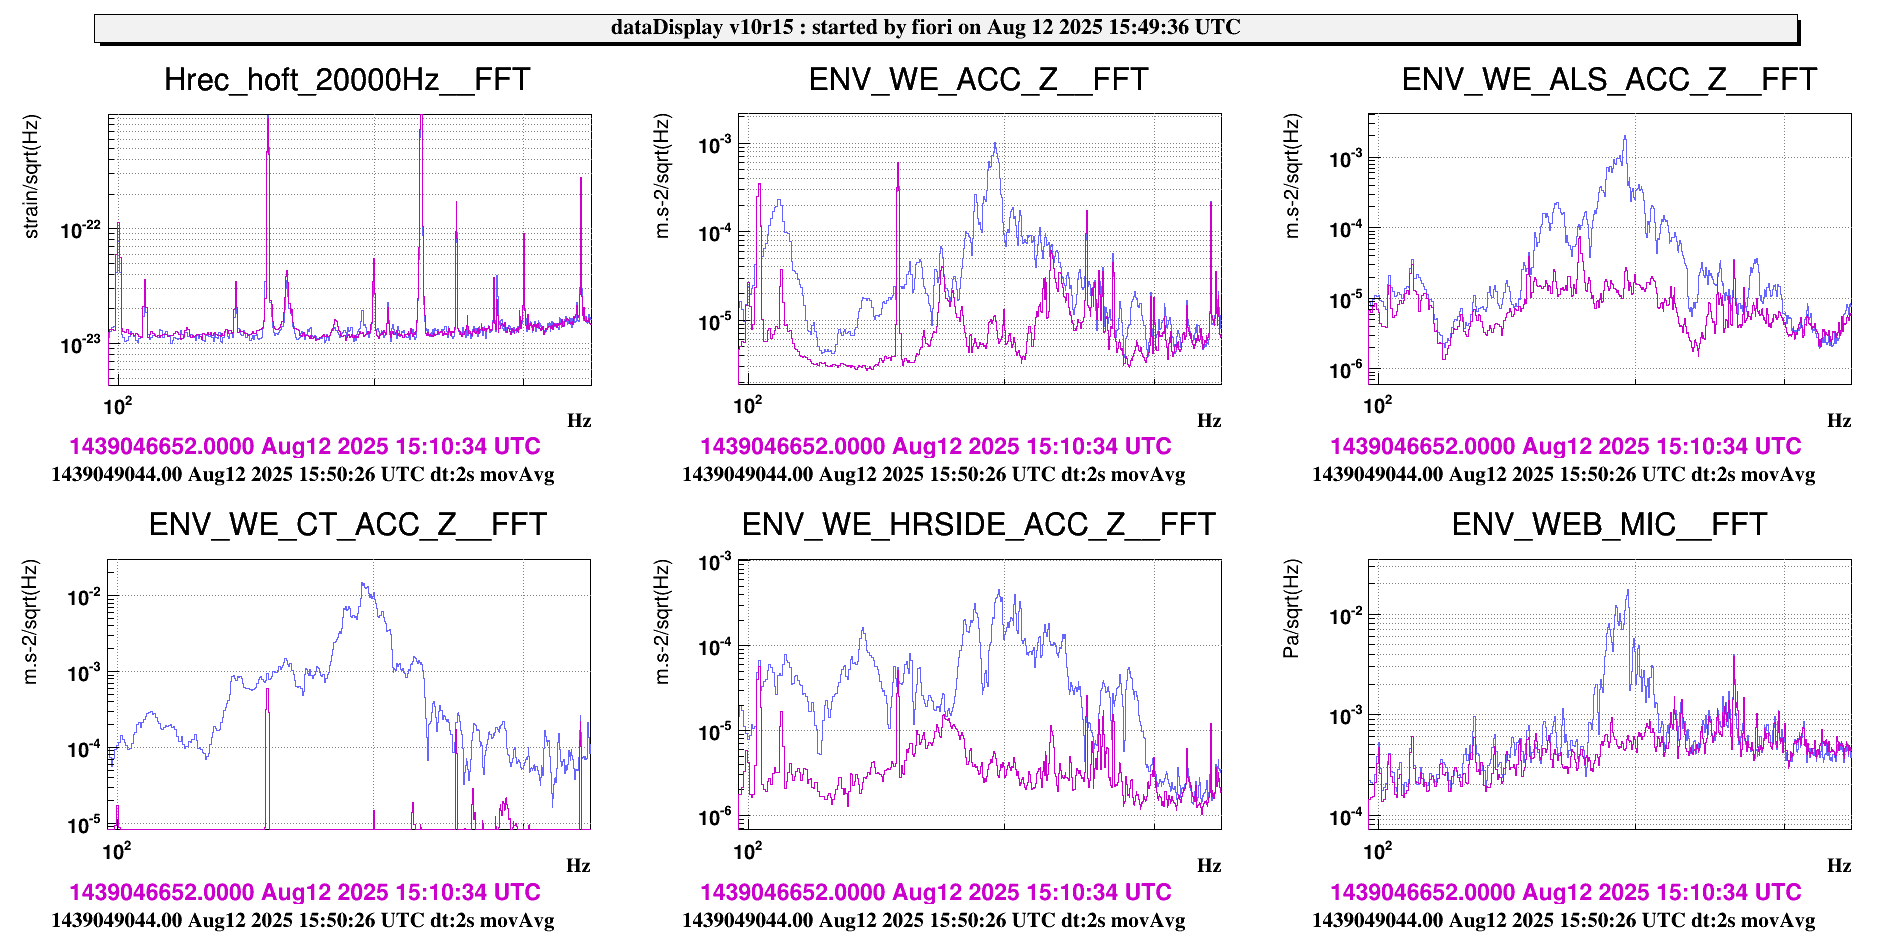
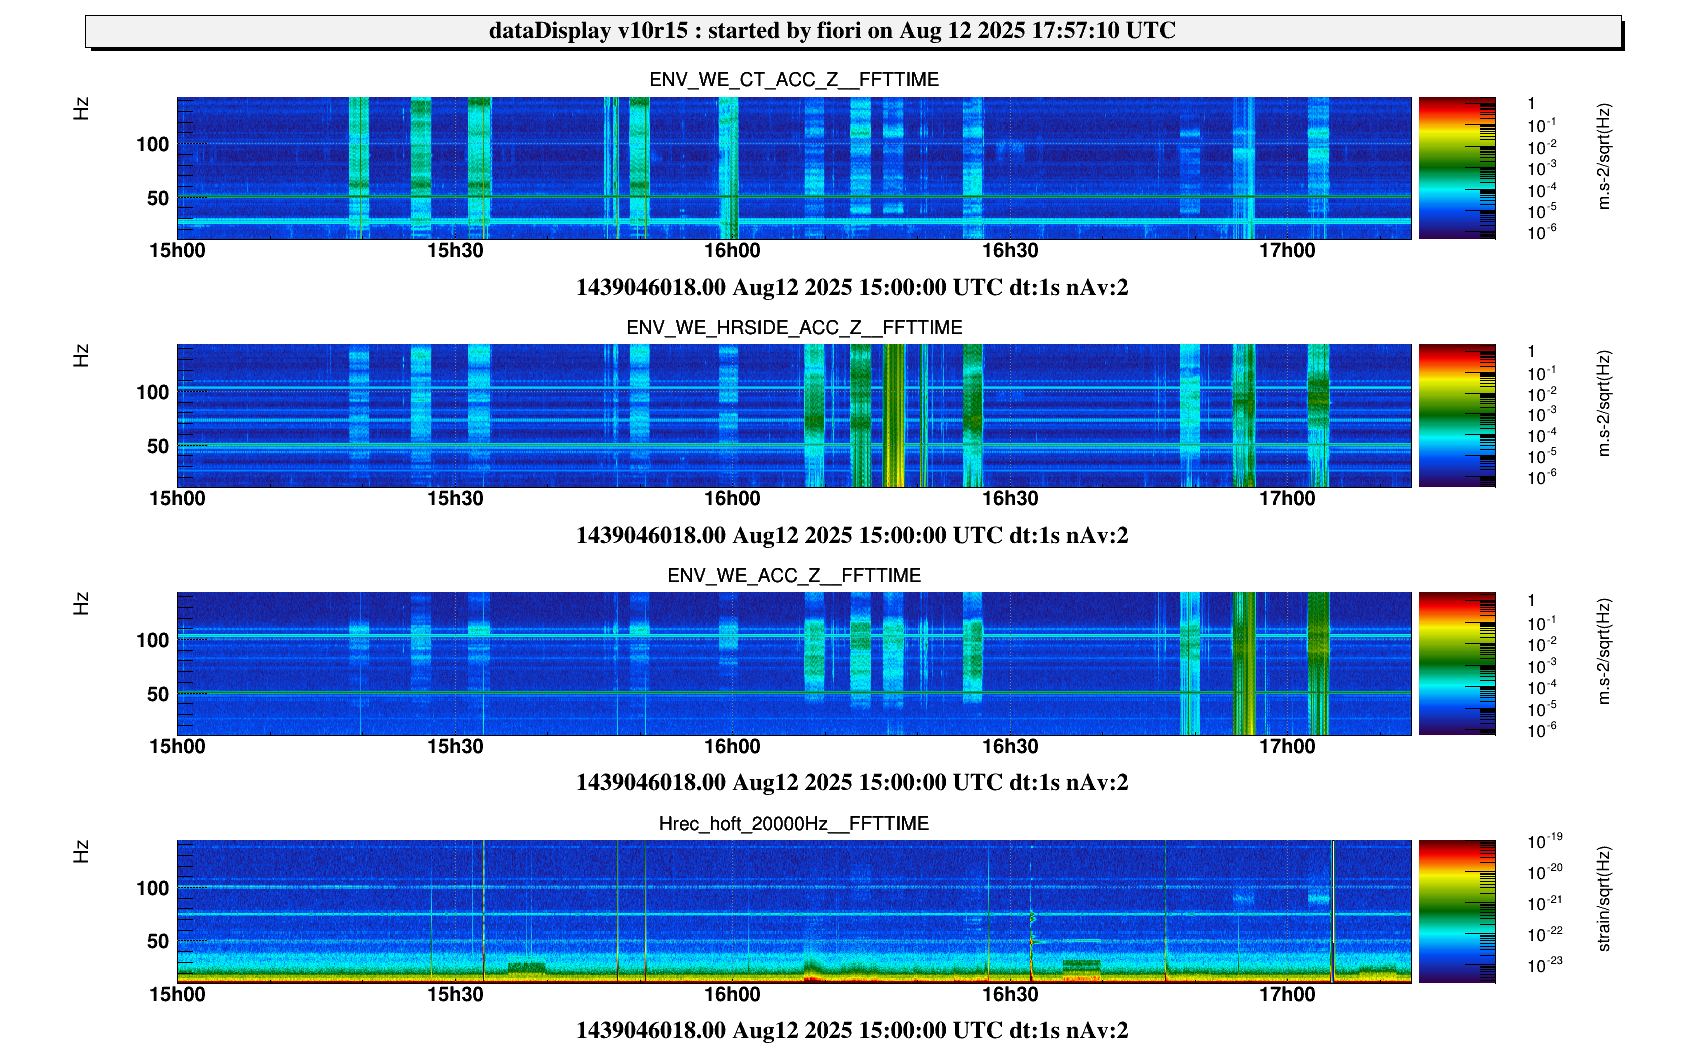
Fig. 3: it shows the pushing on the cryotrap holding points. There is no effect produced in Hrec yet in the accelerometer (ENV_CT_ACC_Z) we see the 3 Hz and harmonics associated with the cryotrap suspensions.
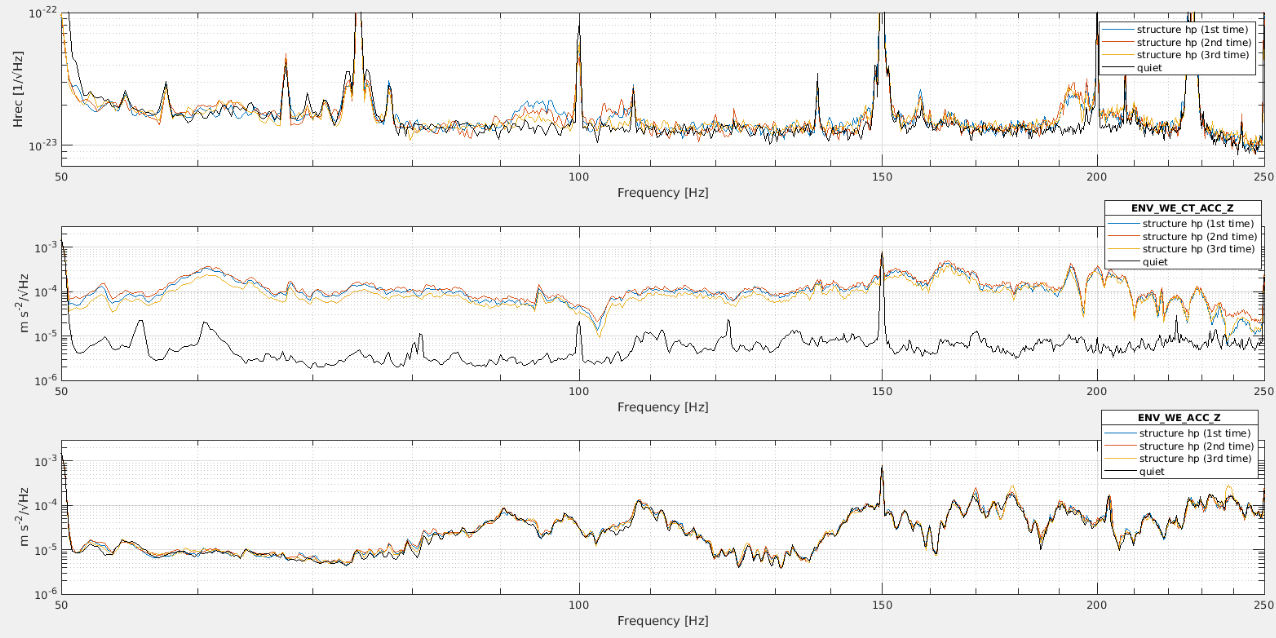
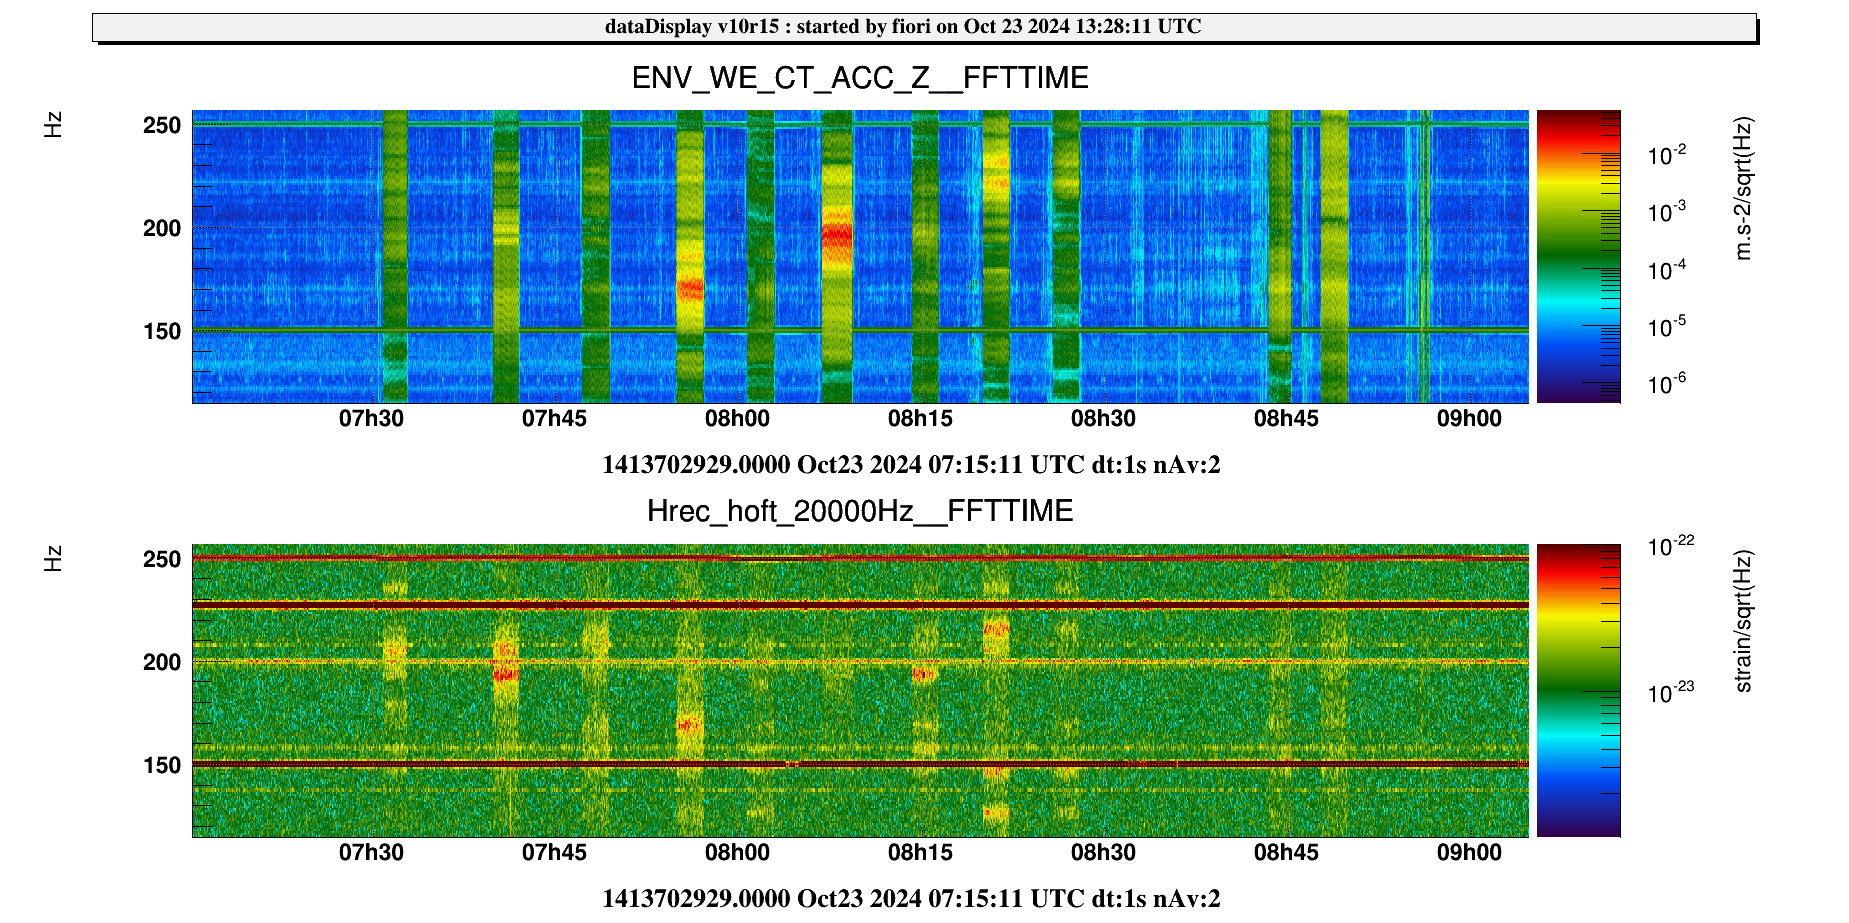
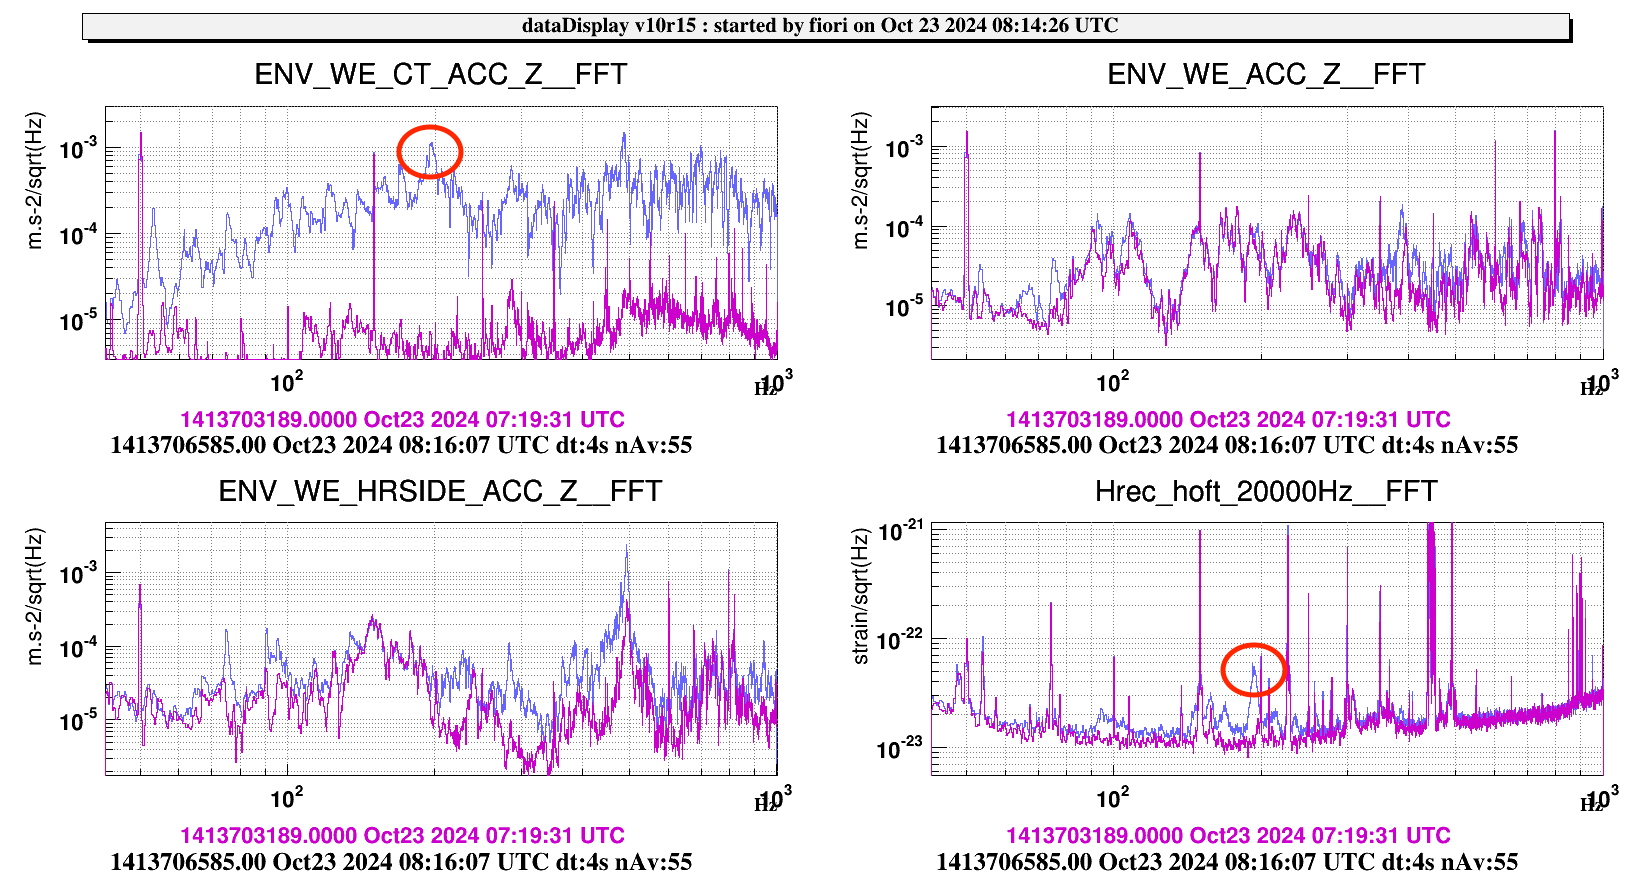
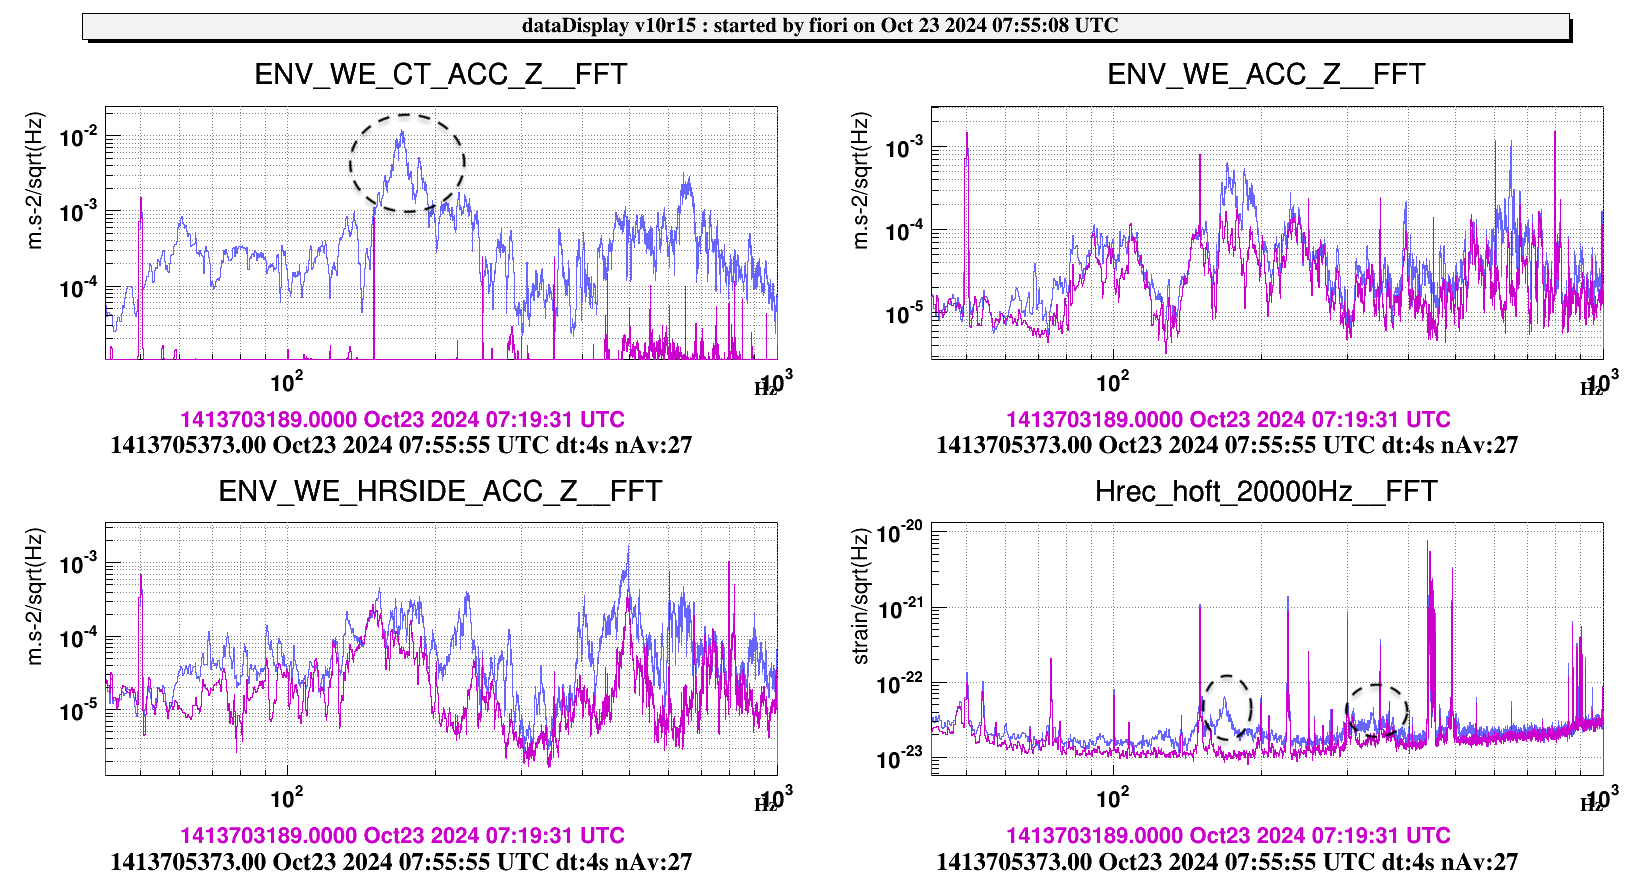
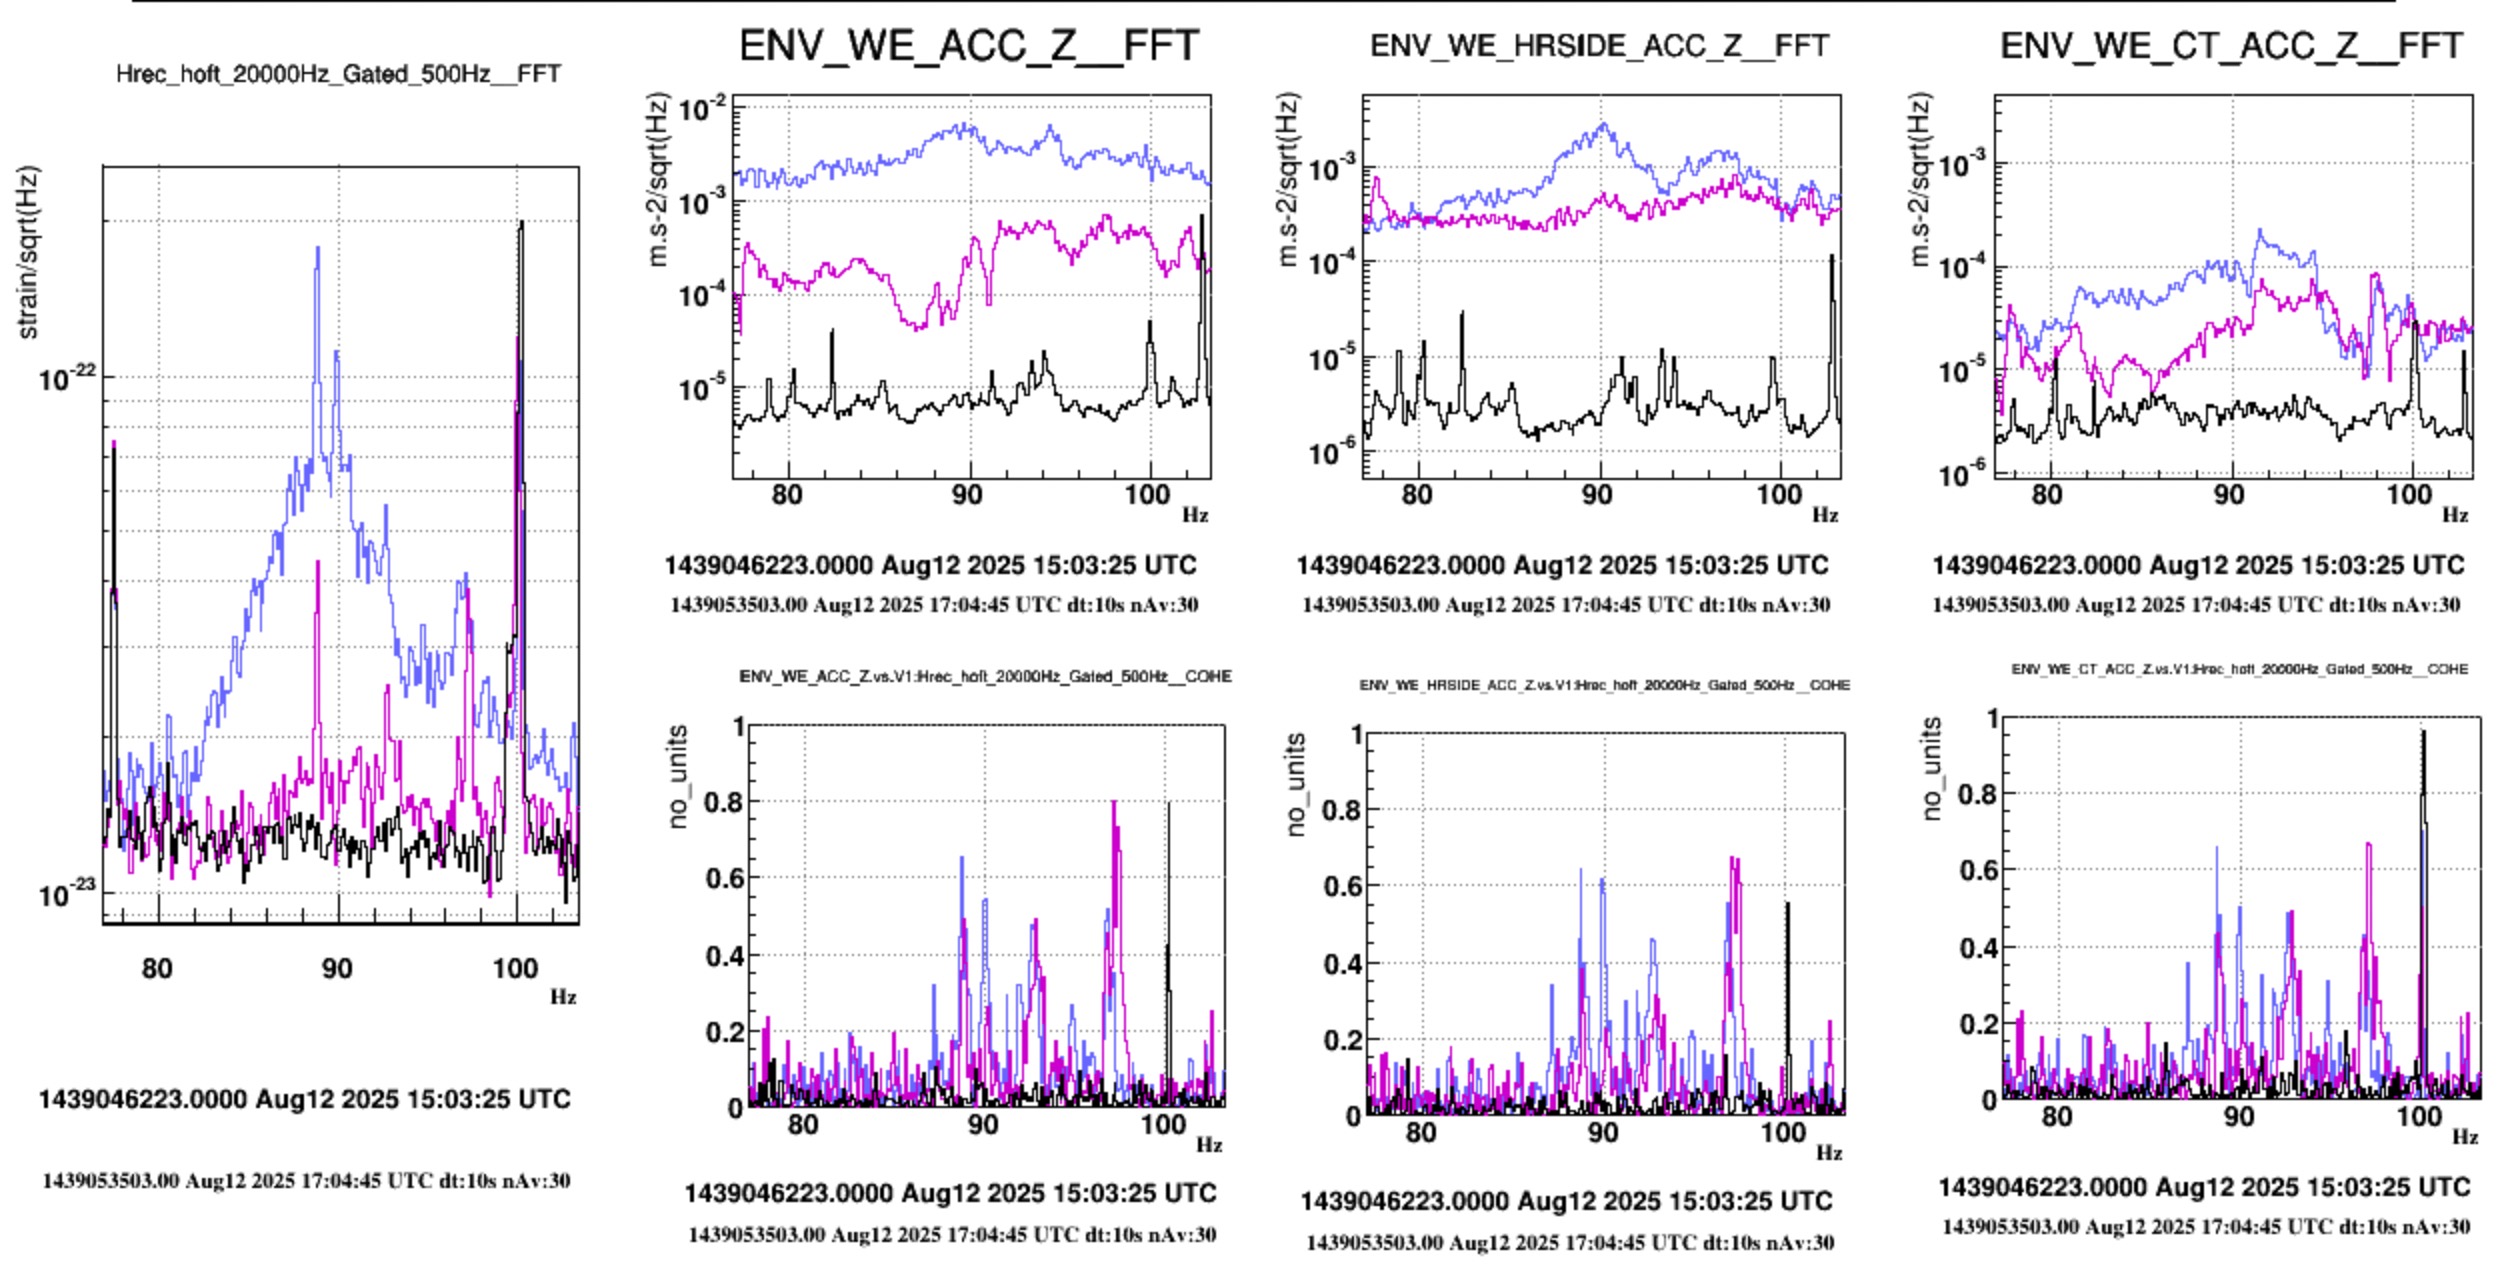
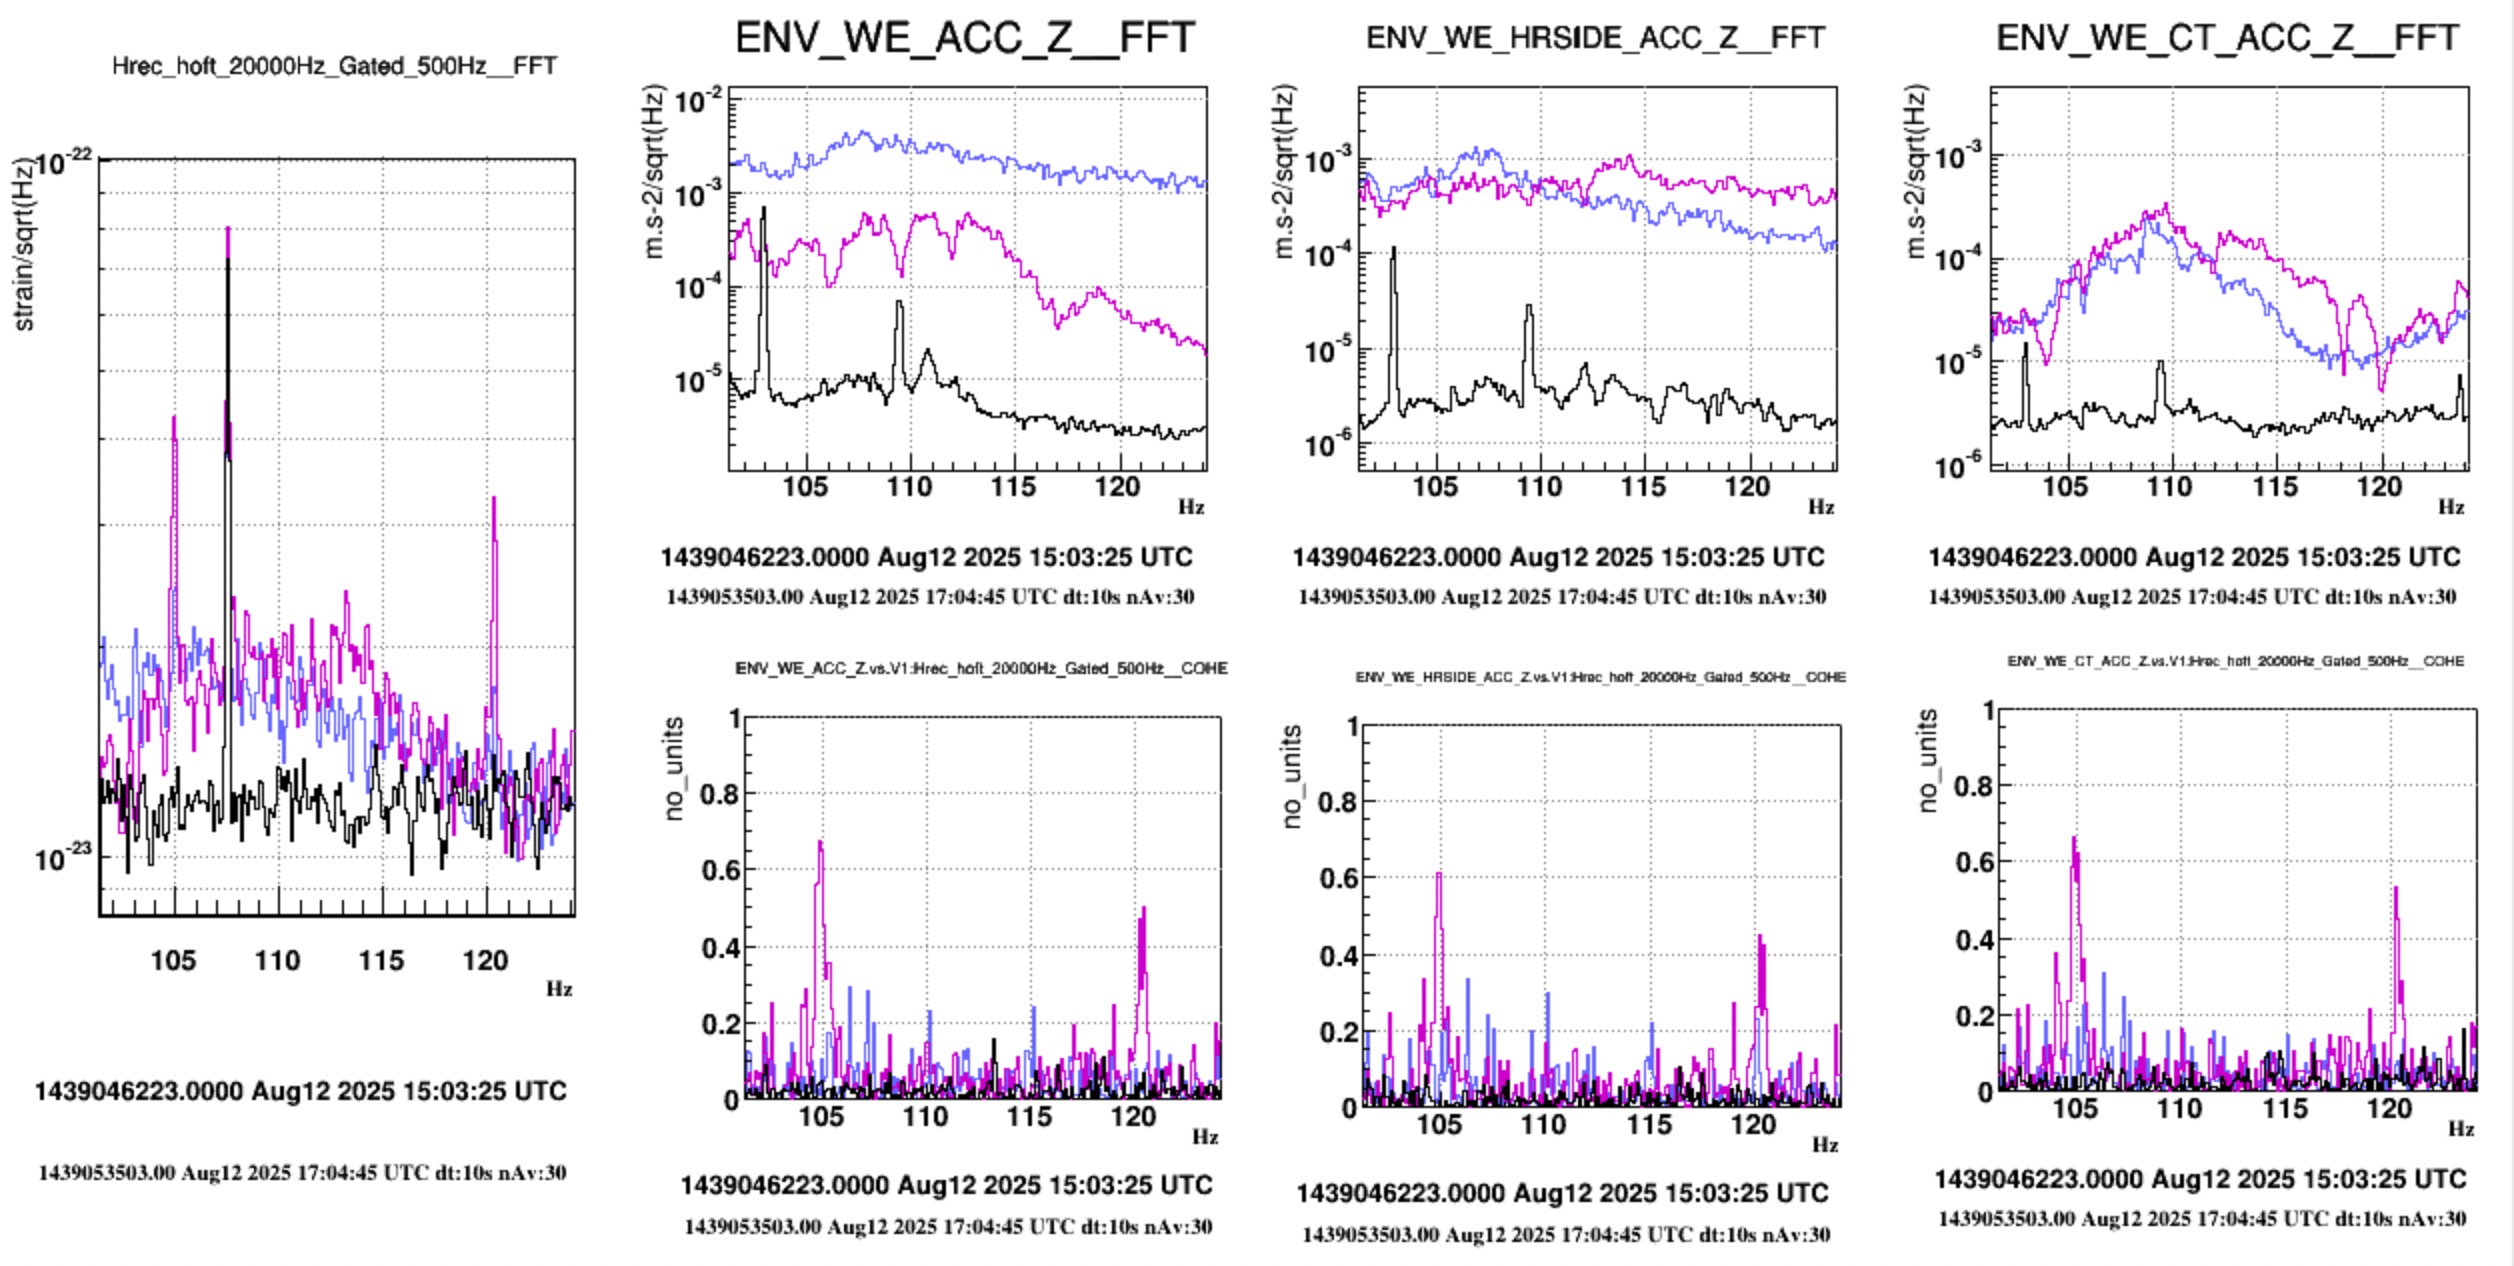
Fig.4: it shows three tappings on the metallic structure of the holding point (North side towards the tunnel ). We excited bumps at 95, 105, and 195 Hz. It is worth noticing that no measurable noise is observed by the accelerometer (ENV_WE_ACC_Z) on the 1200 flange of the AR mirror side.
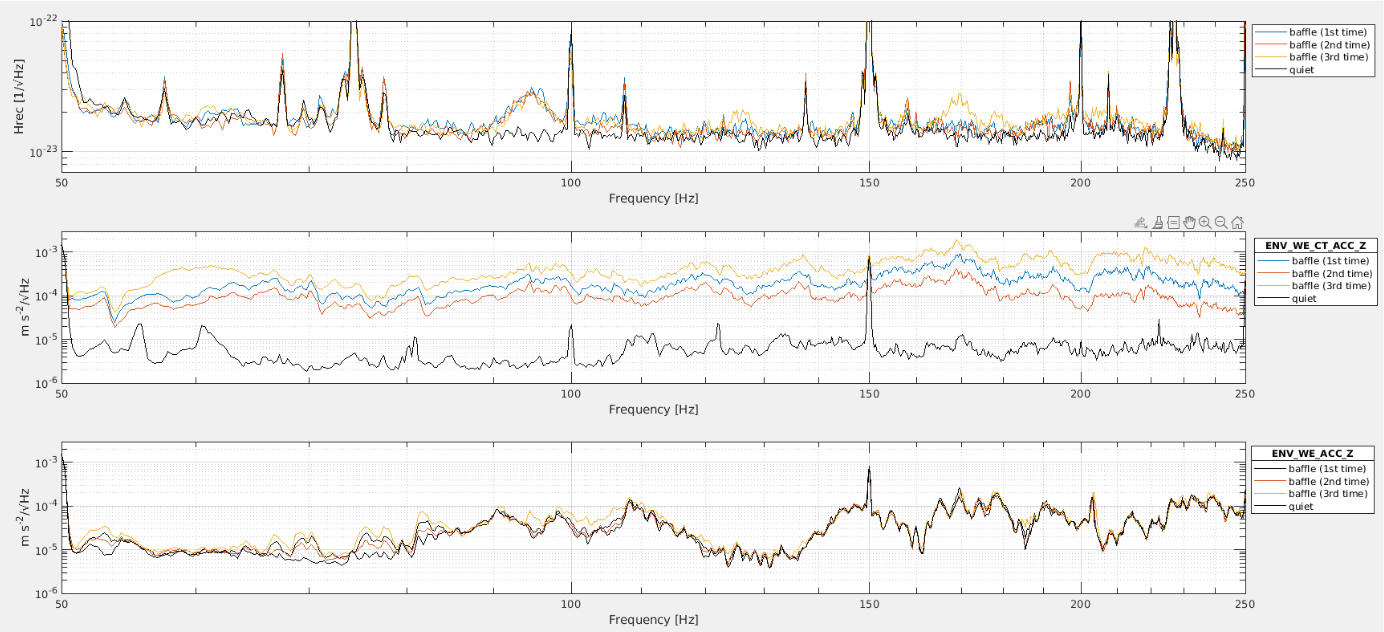
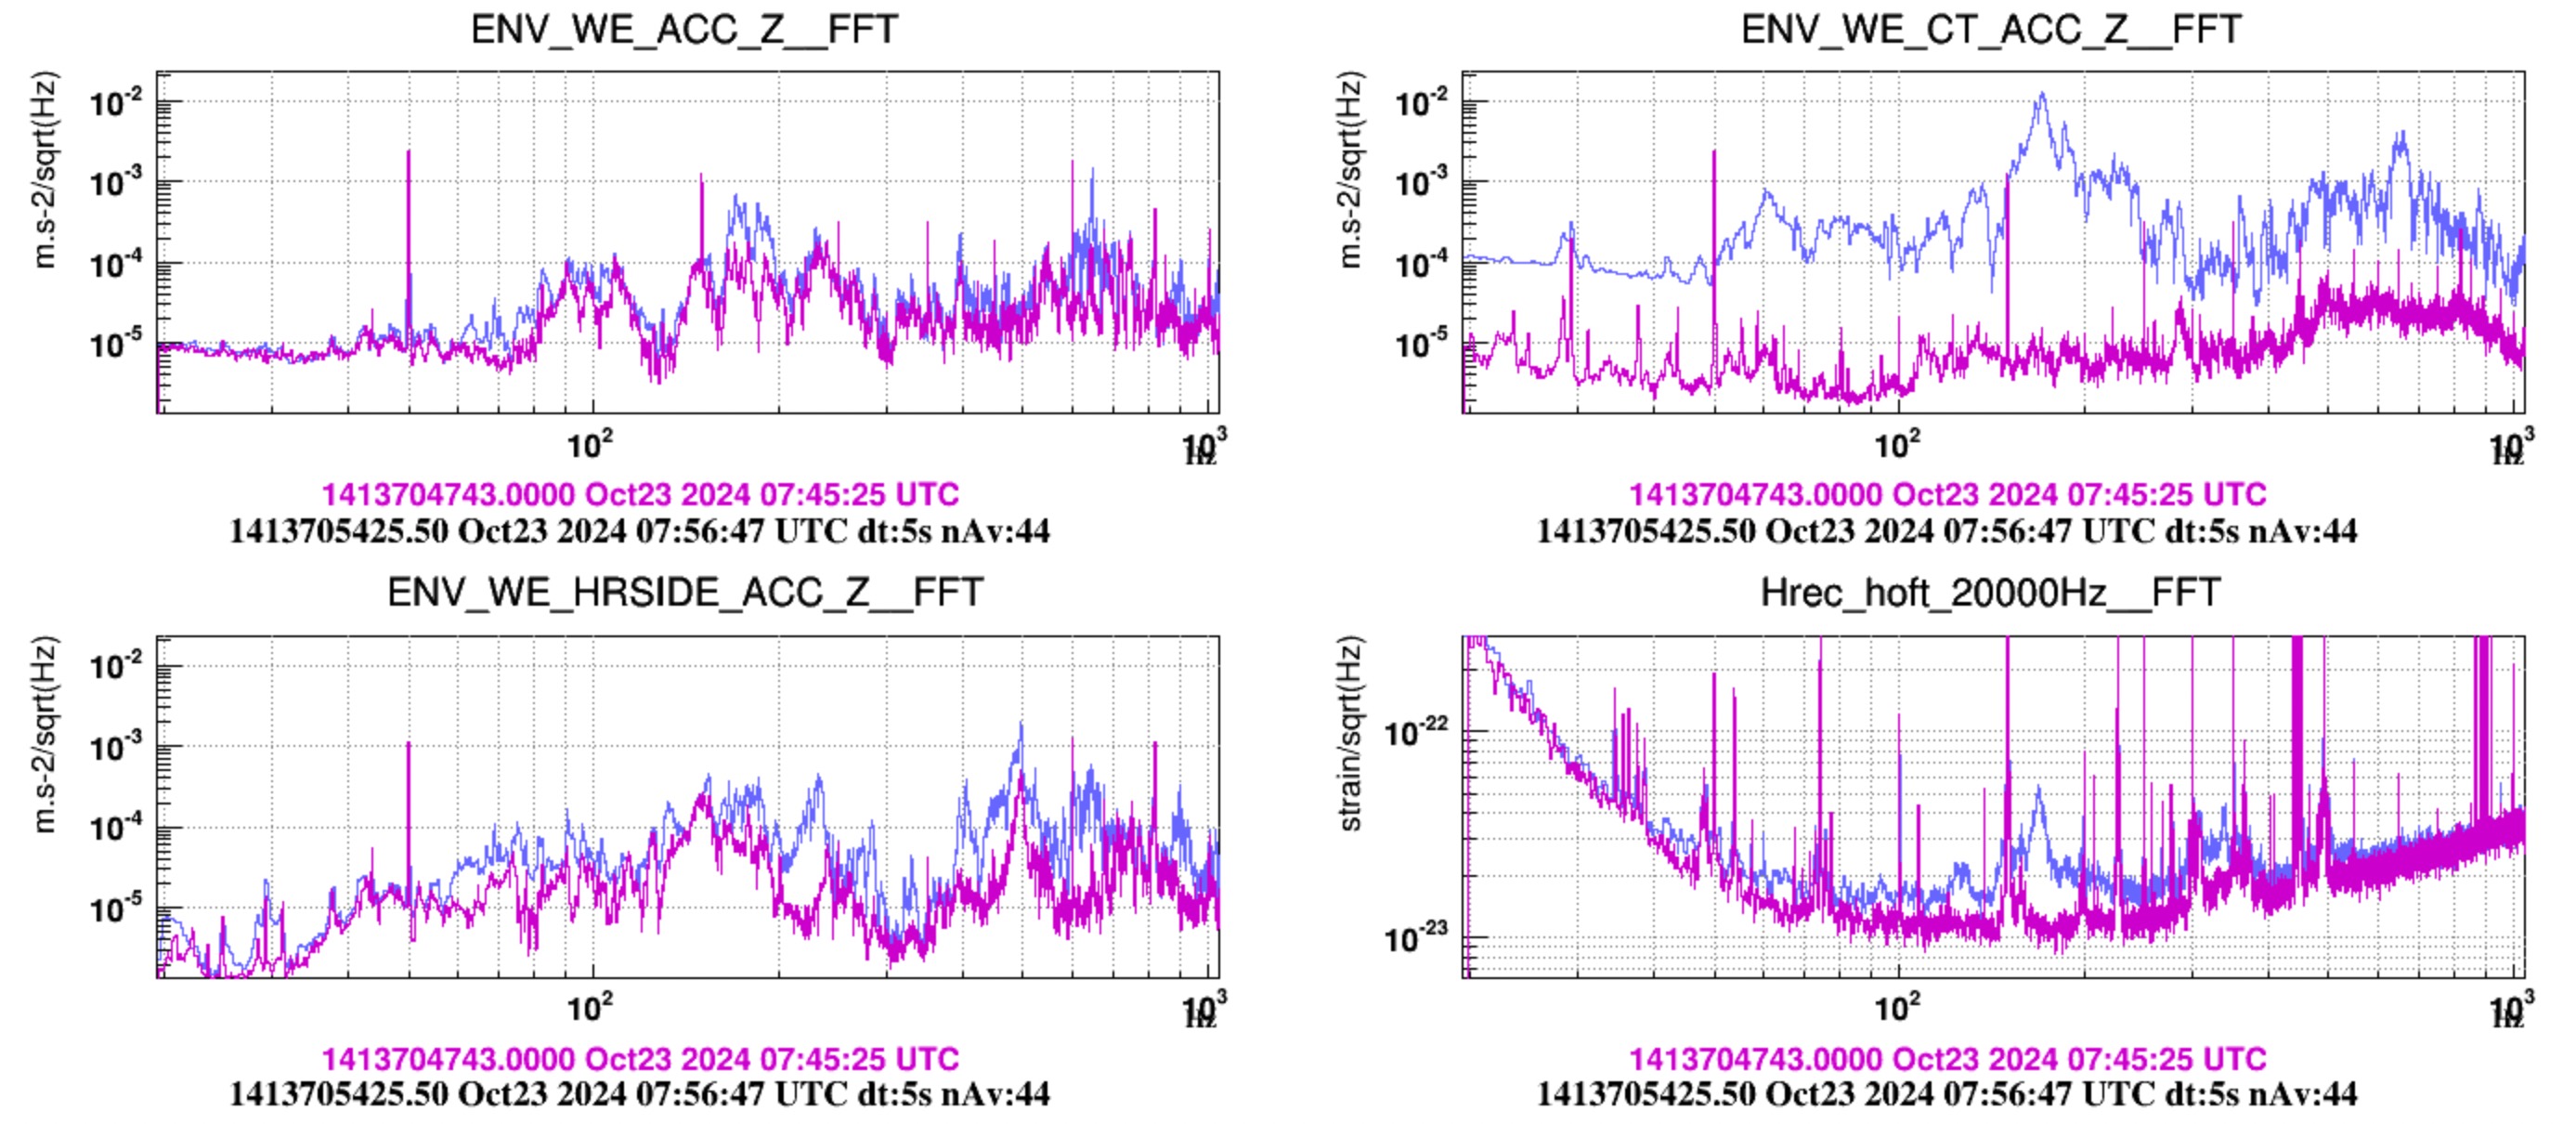
Fig 5: it shows three tappings (increasing intensity) on the CT chamber in the position of the anchoring point of the cryo-baffle. The noise bumps at 95 Hz and 105 Hz are produced by all tappings. Instead, the most intense tapping also produced bumps at 125 Hz, 170 Hz and around 200 Hz. It is worth noticing that essentially no vibration reached the 1200 flange of the AR mirror side.
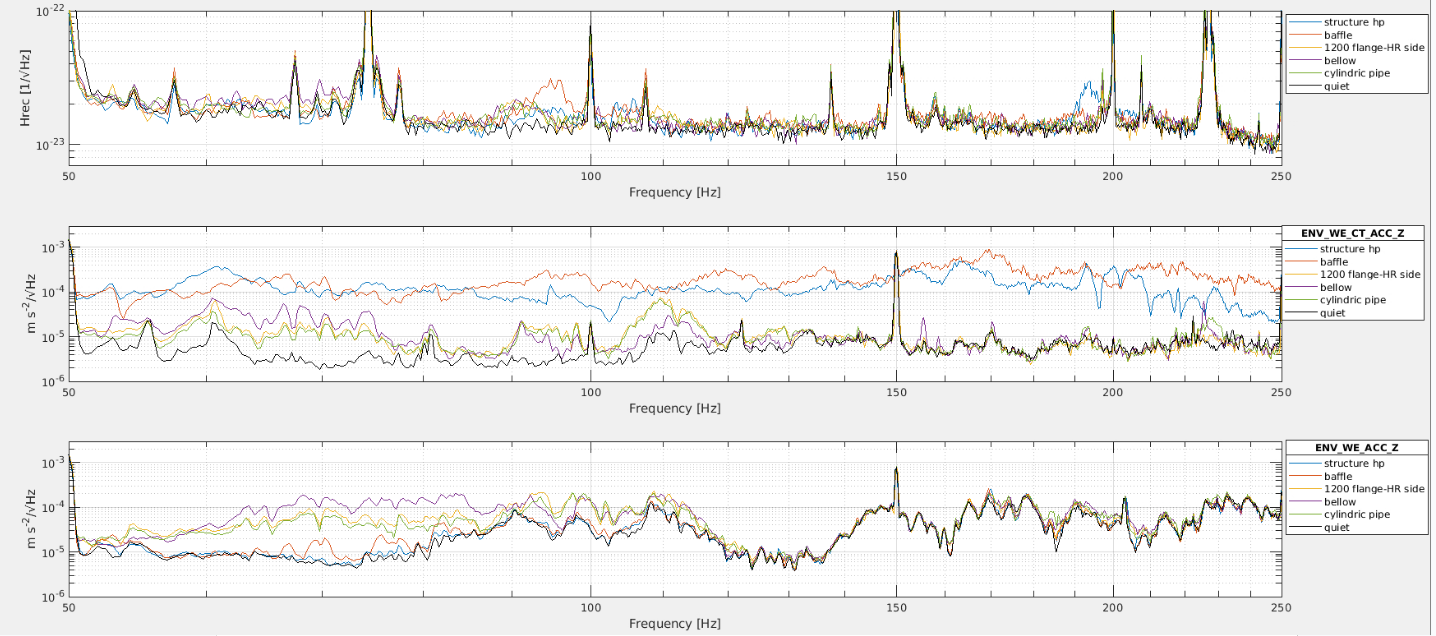
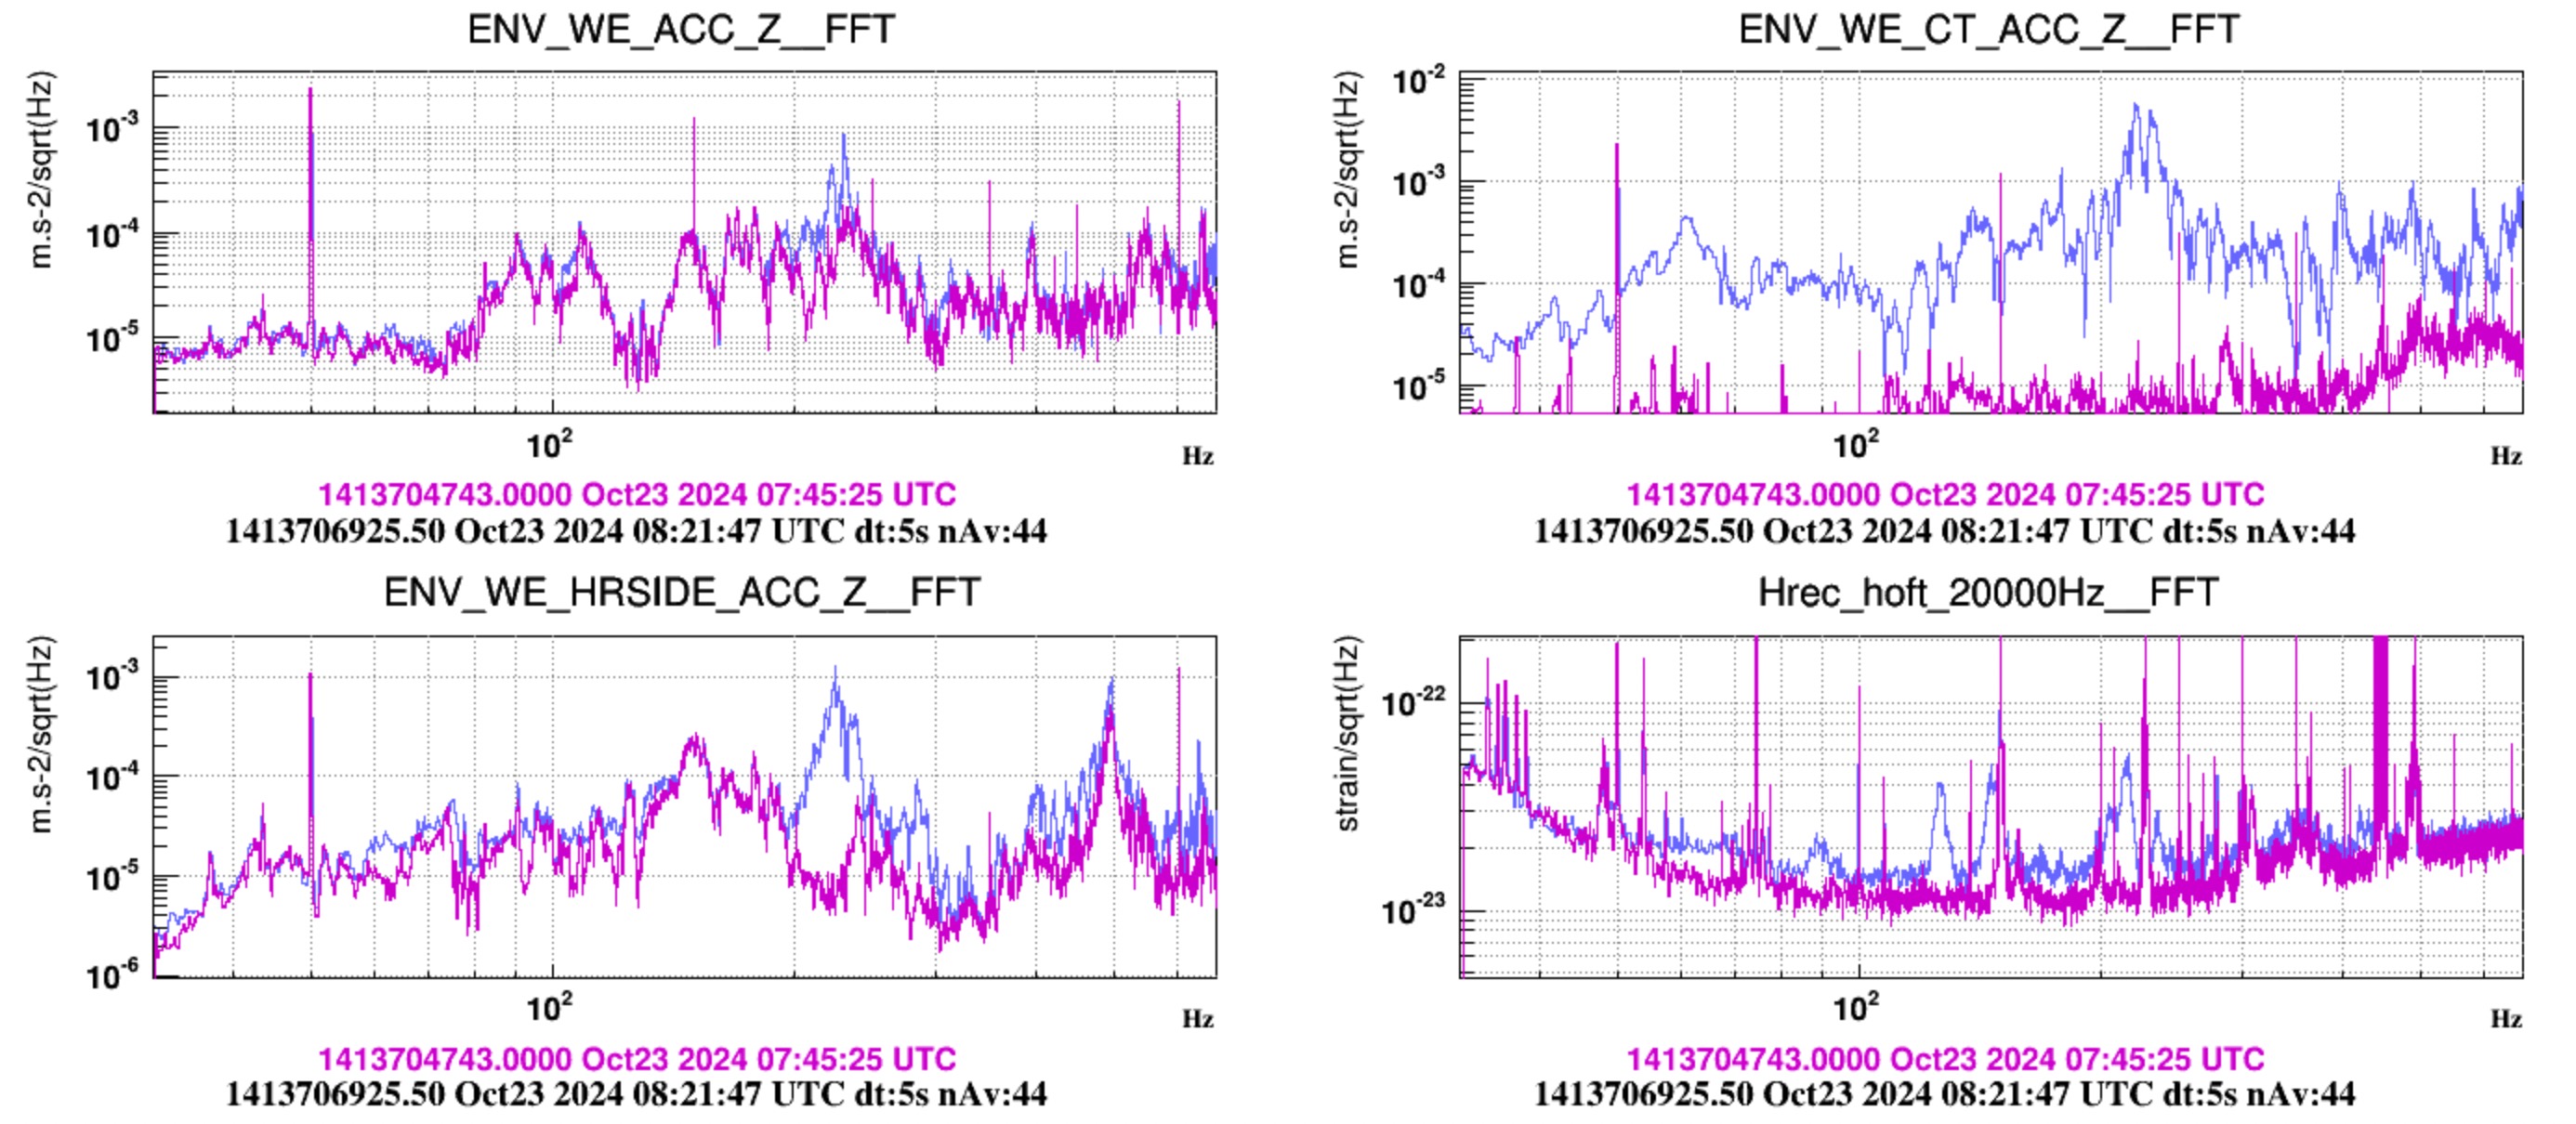
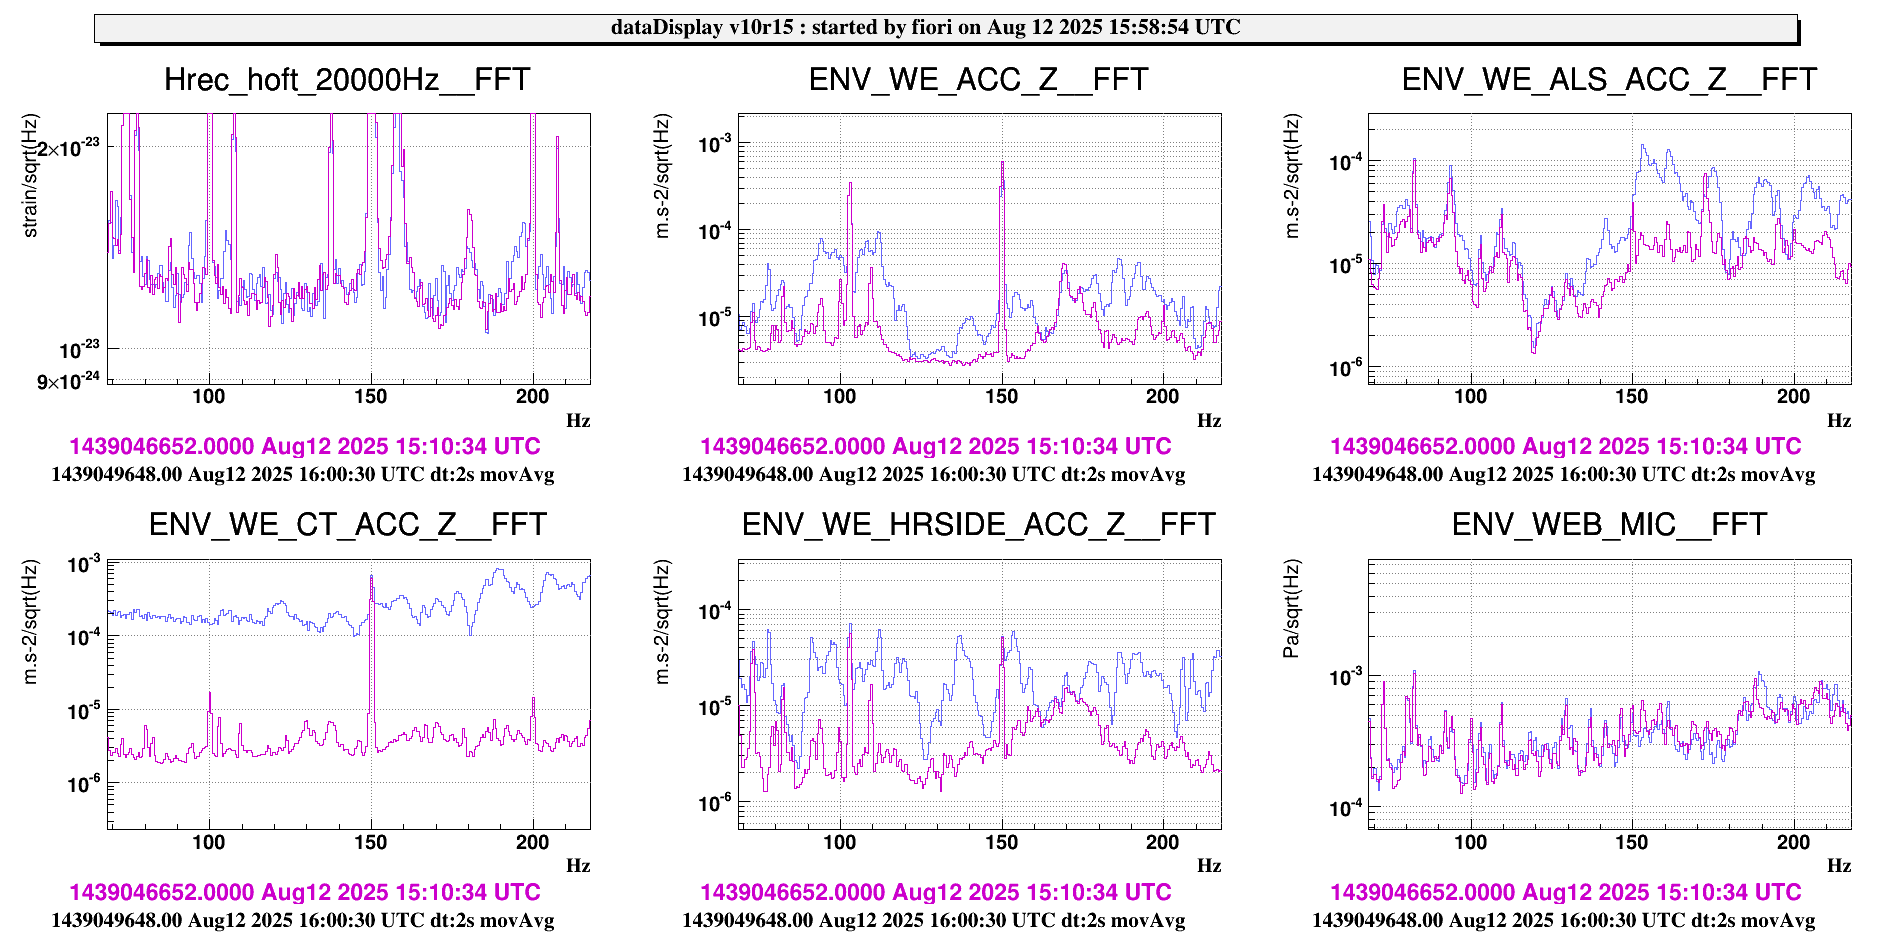
Fig.6: it shows the comparison of all tappings on the HR mirror side. A new bump at 90 Hz is produced when tapping on these three locations: bellow, cylindric link pipe, and 1200 flange (HR side).
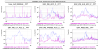
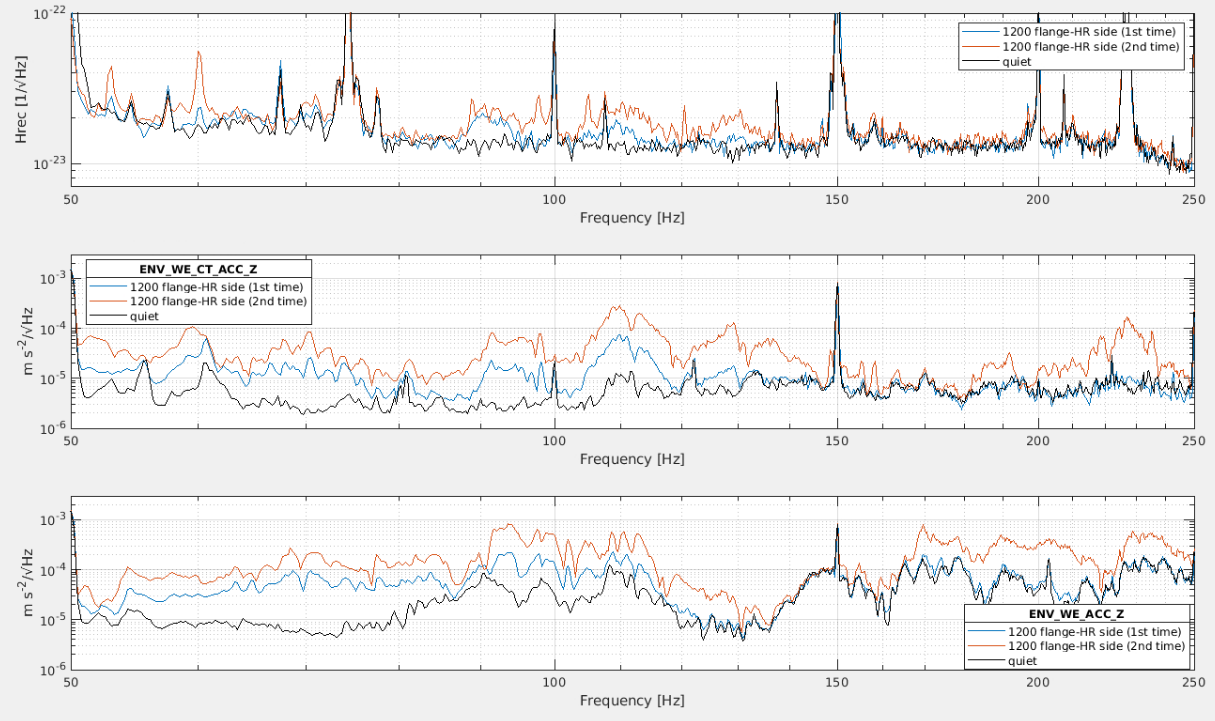
Fig.7: it shows the tappings on the 1200 flange HR mirror side with two intensities. We see growing bumps at 90 Hz, 110 Hz, and 130 Hz. As expected, we also excited significantly the 1200 flange AR side.
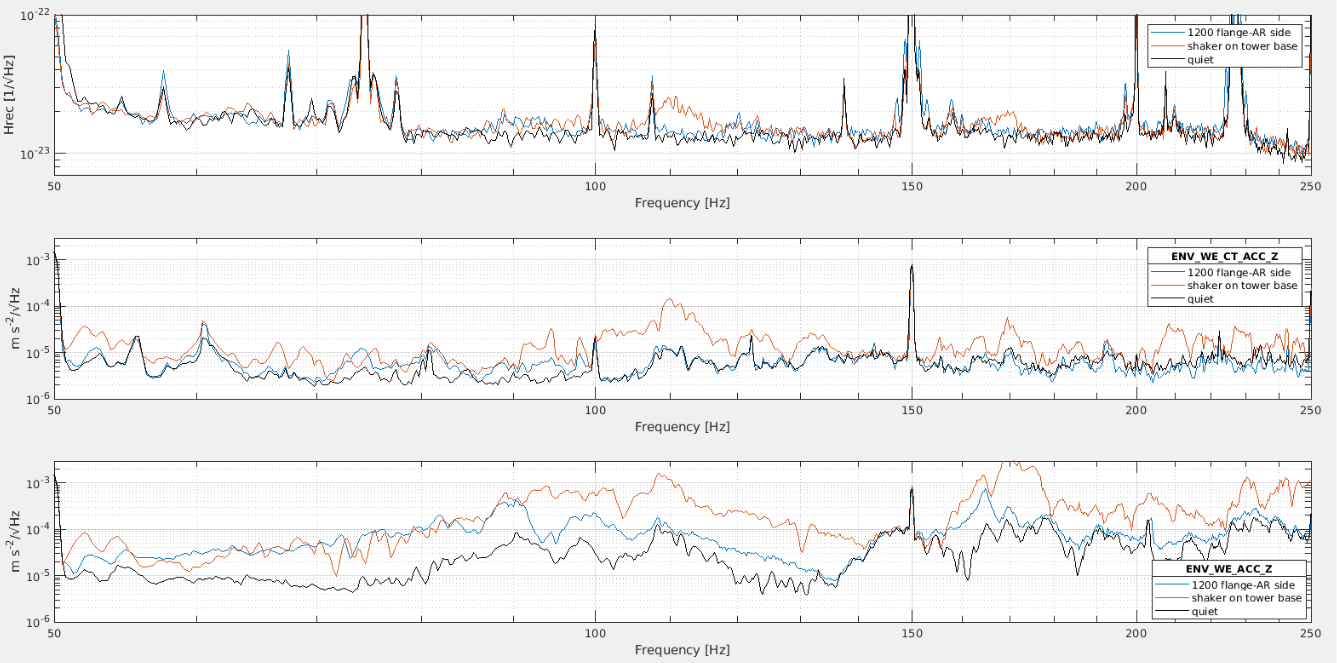
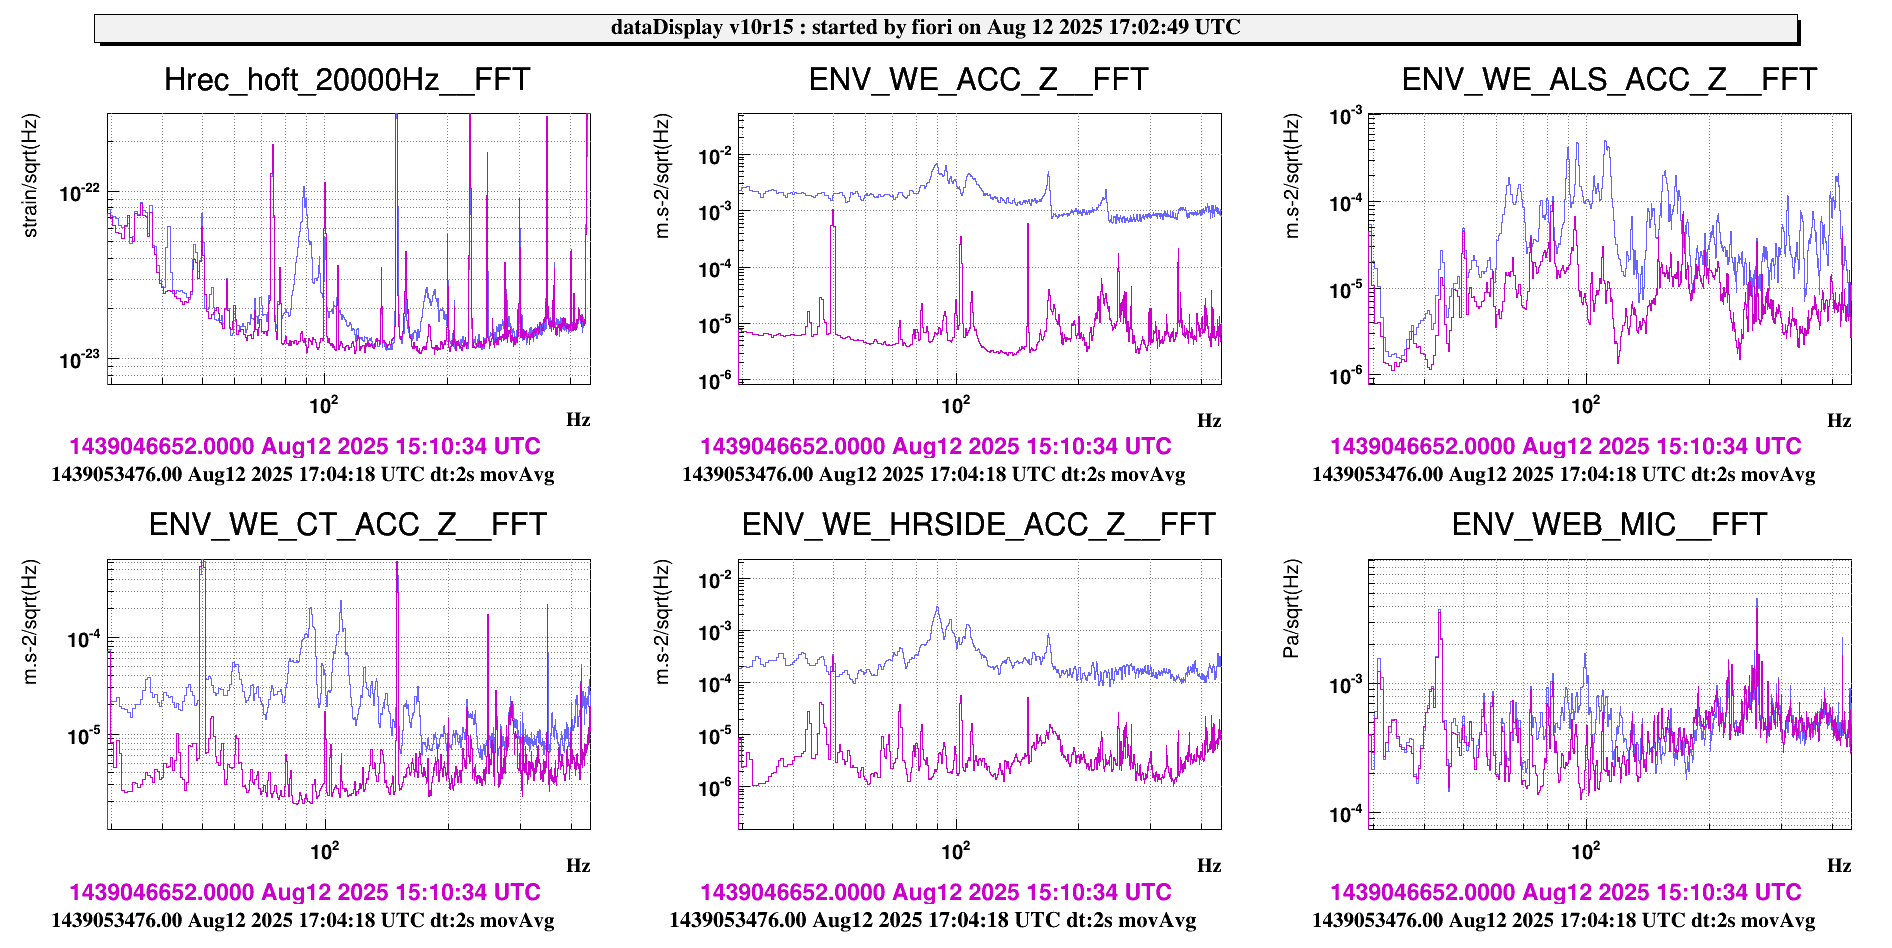
Fig.8: it shows the shaker (on the tower base AR side) injection compared with the tapping on the 1200 flange AR side. We excited bumps at 110 Hz and 170 Hz during the shaking. However, the shaker's excitation is widespread.
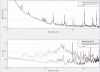
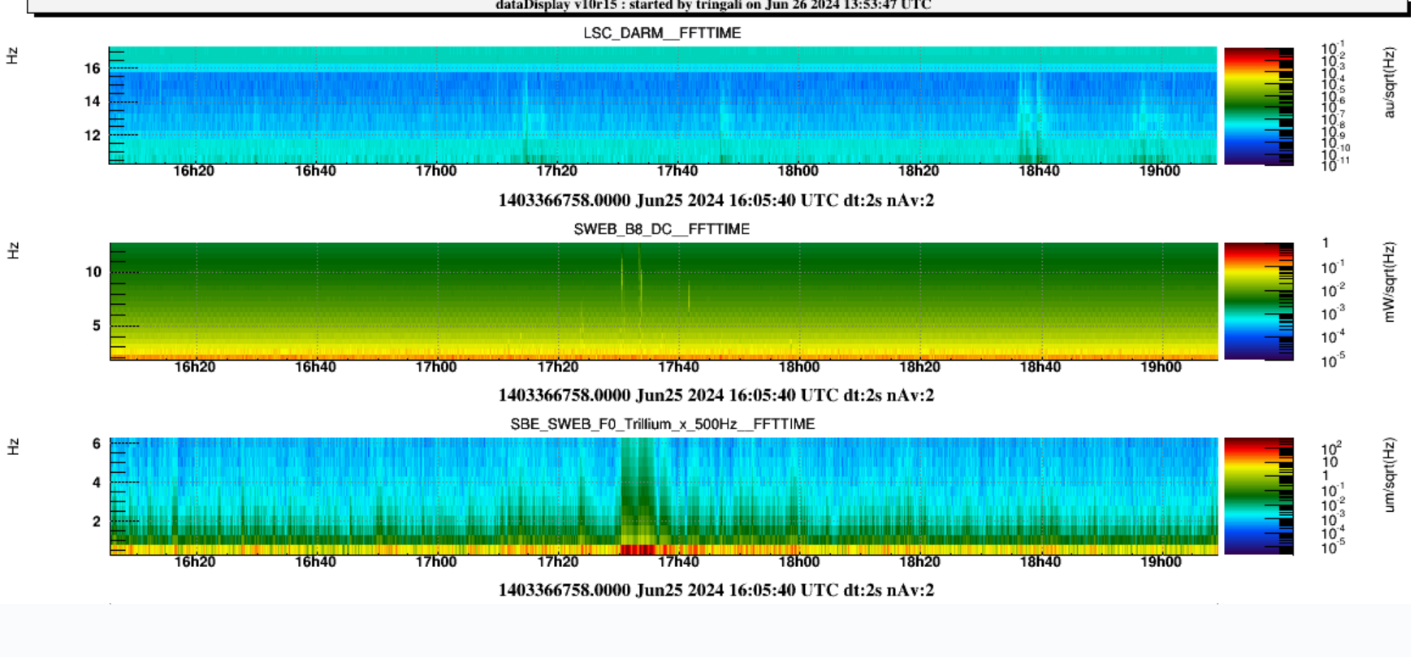
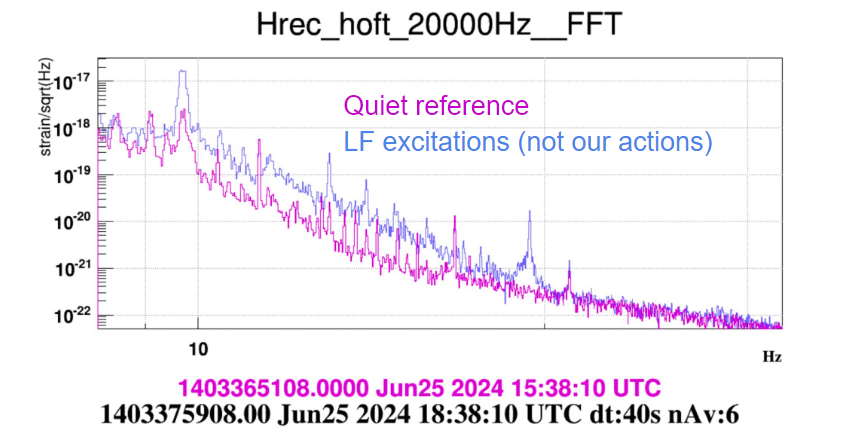
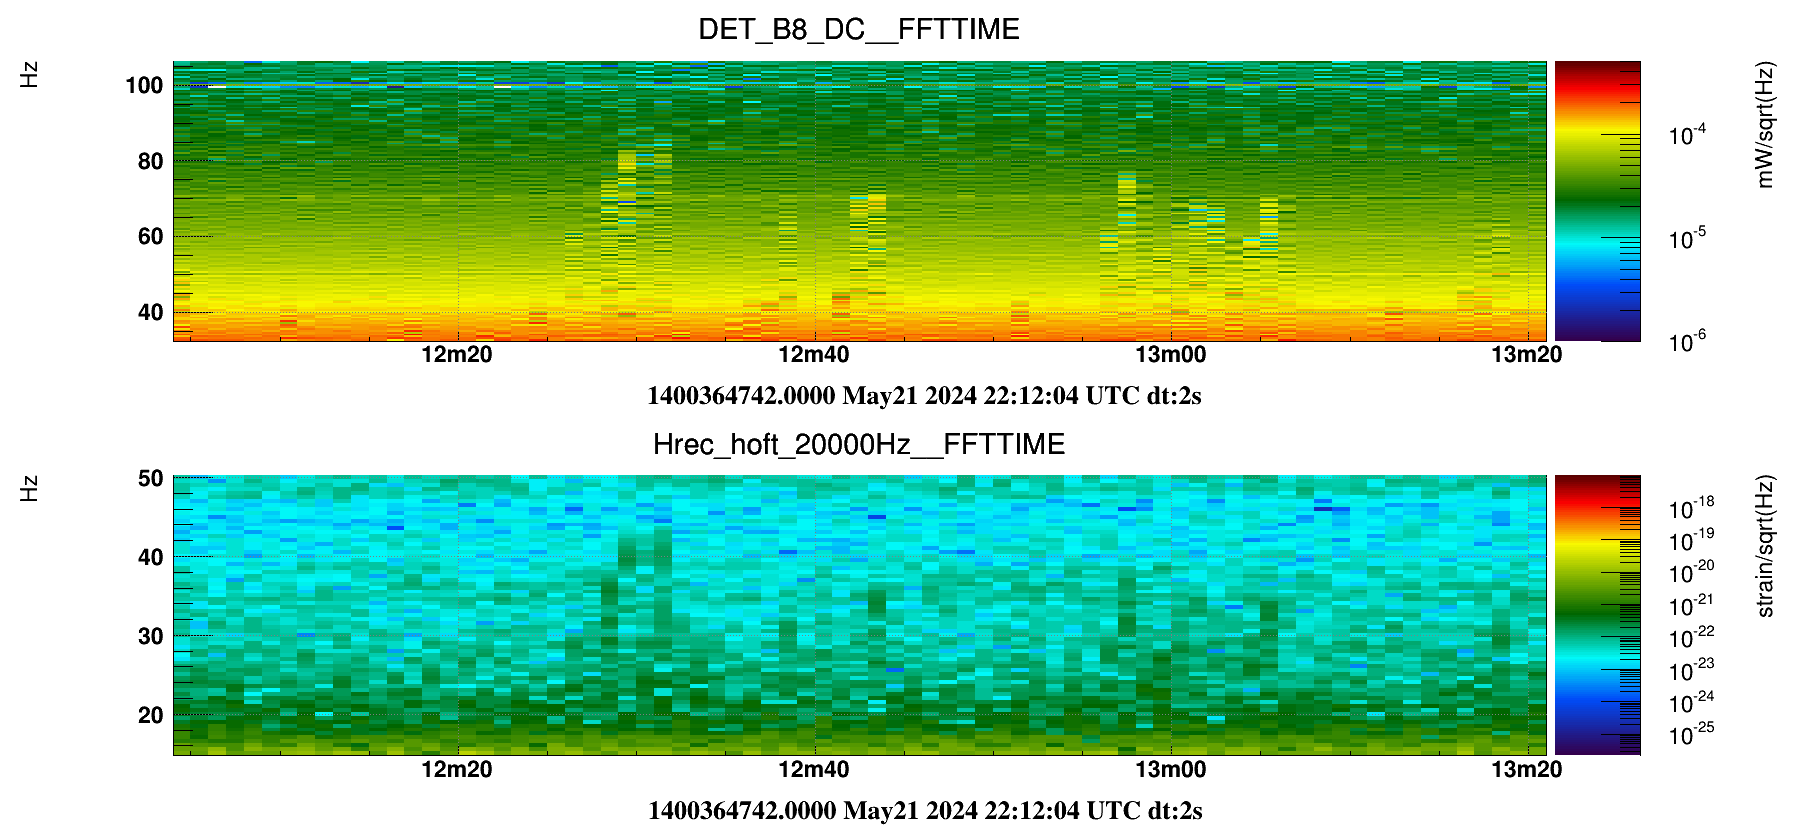
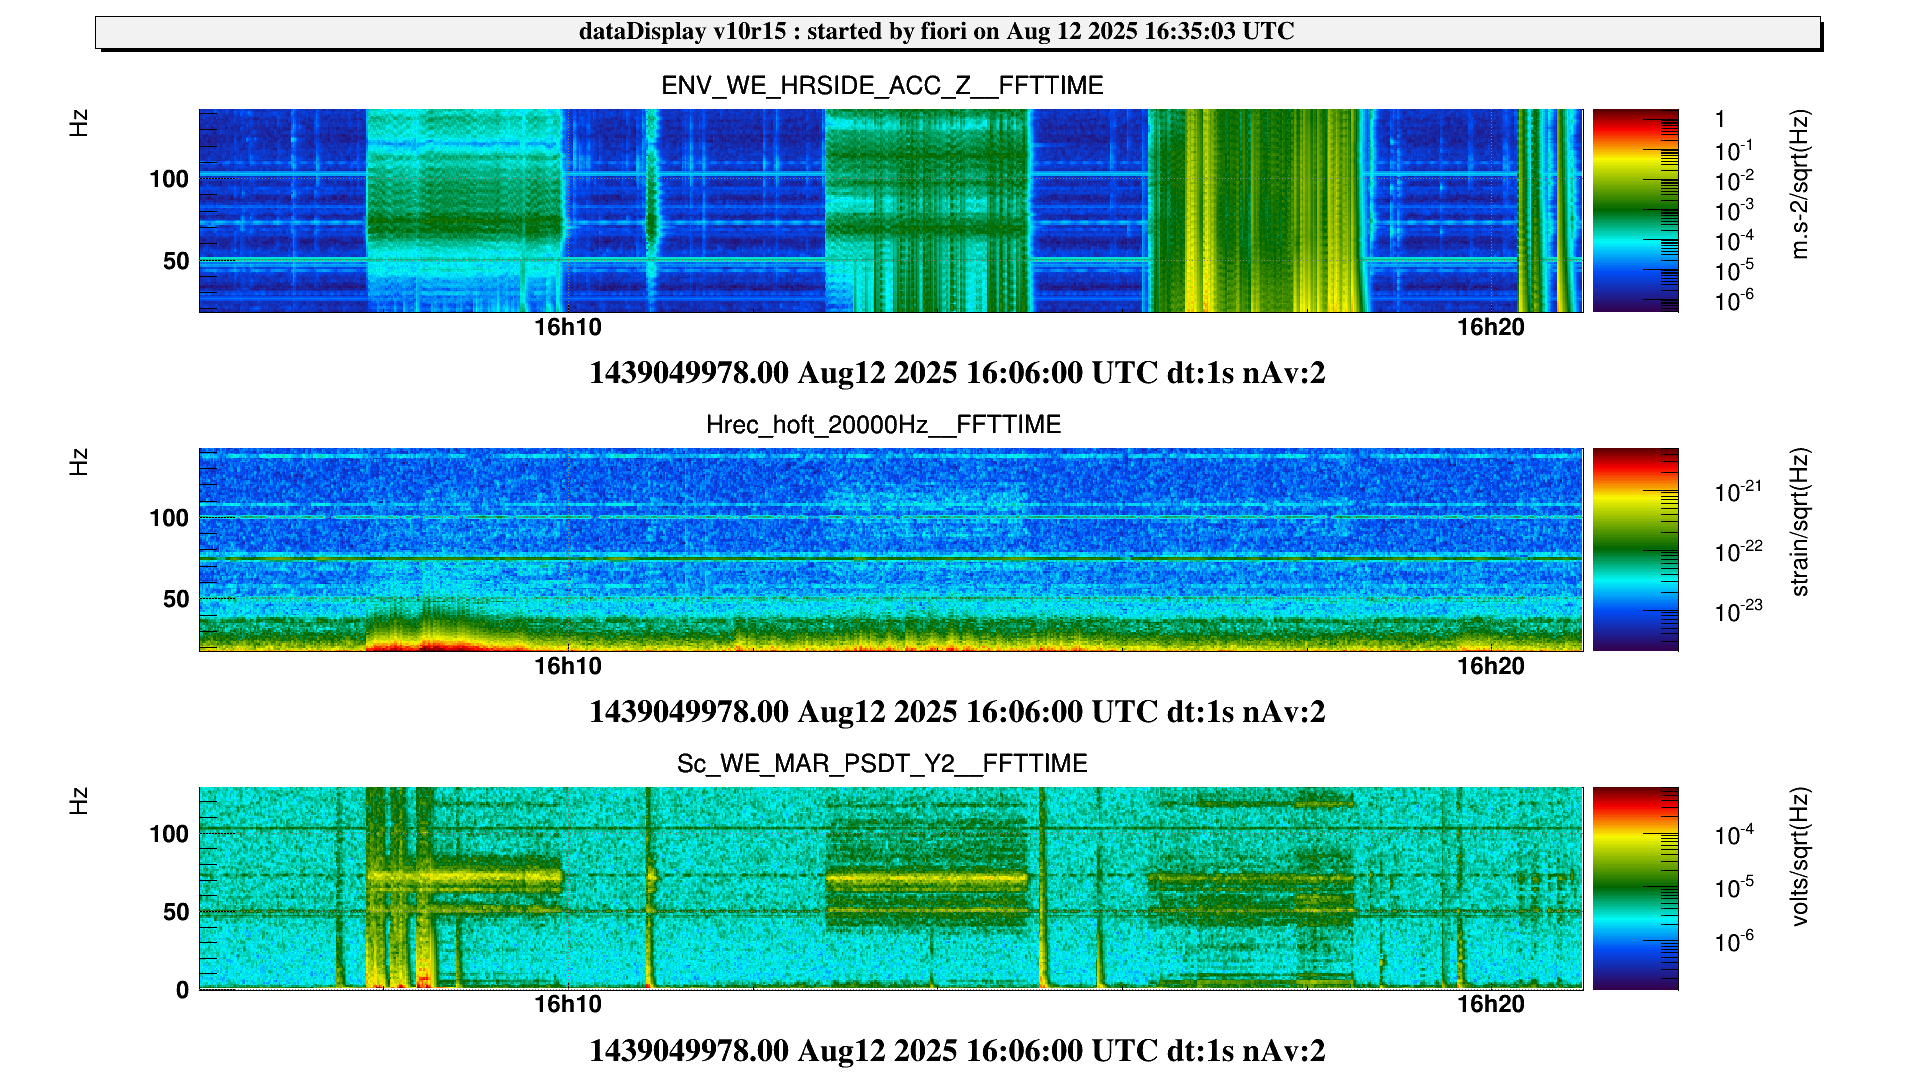
Some low-frequency excitations of Hrec or B8 photodiode also (randomly) occurred during our actions, Fig. 9. But, while in the B8 photodiode, these excitations are shaped as arches and look associated with SWEB suspension motion which (probably) we accidentally excited, the low-frequency structures in hrec are not arches, Fig.10. Indeed these do not look like arches. No correlation is found with Sa_WE_F0 displacements.
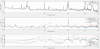

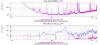
I did an exercise to test the compatibility of the scattered light arches noticed by Michal during the high microseism of May 21 and the structures we excited during the tapping campaign. As Michal hypothesizes the arches in Hrec are originated by a ground connected scattering object, moving a lot (10micrometers or so) during high microseism conditions.
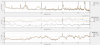
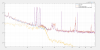
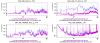
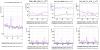
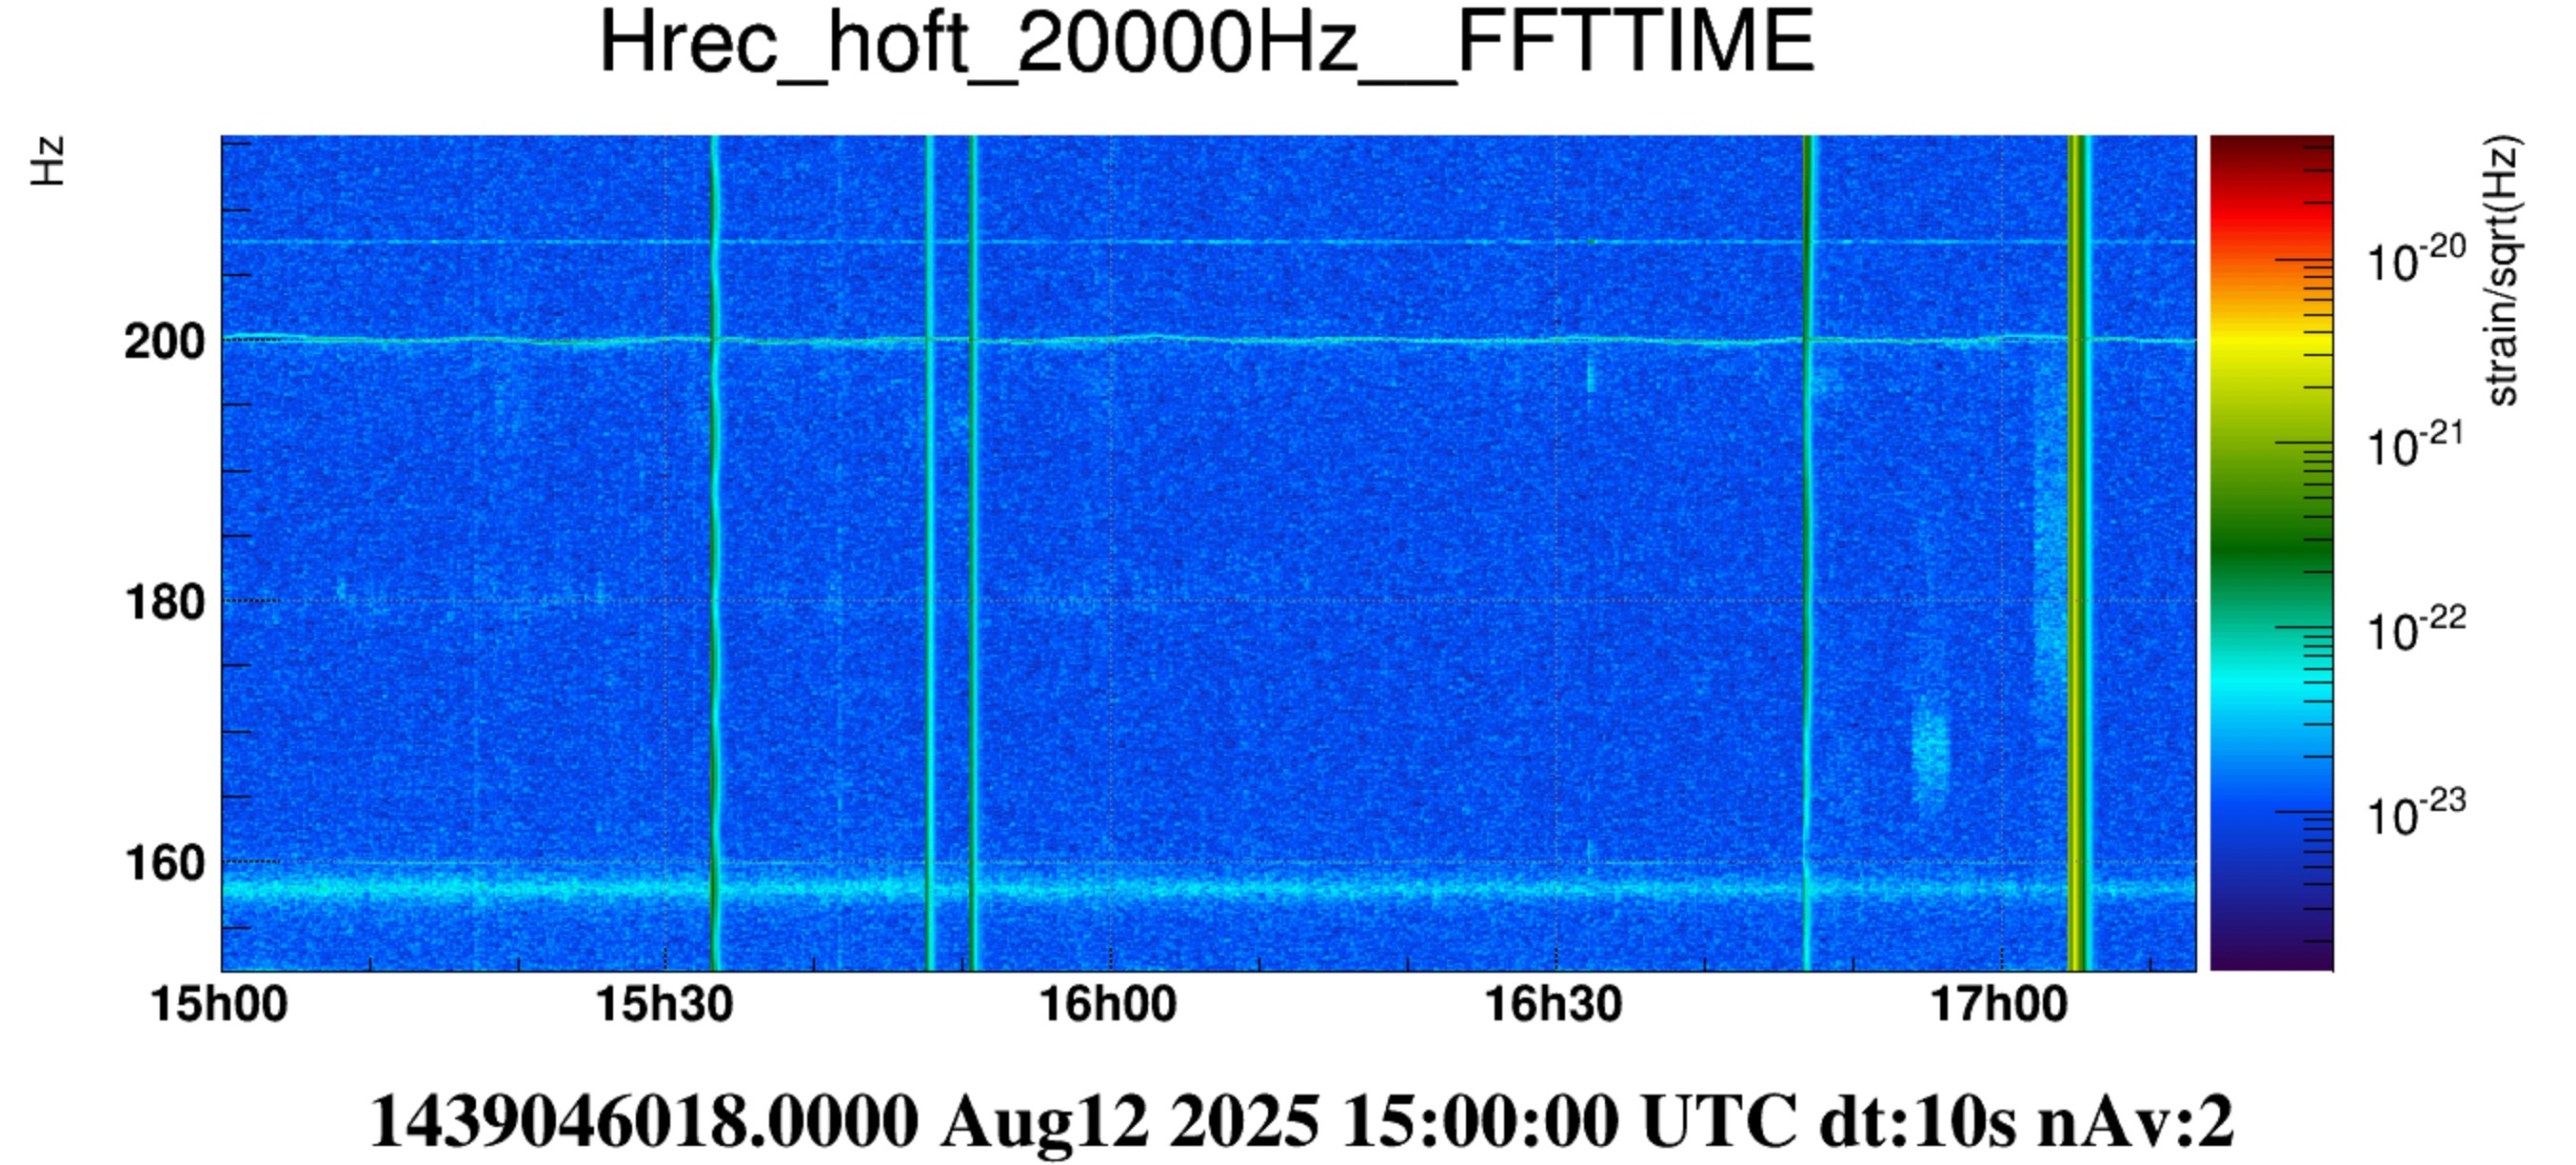
I selected a 60minute period which shows a few significant arches in hrec, reaching up to 40Hz: see Figure 1.
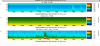
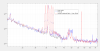
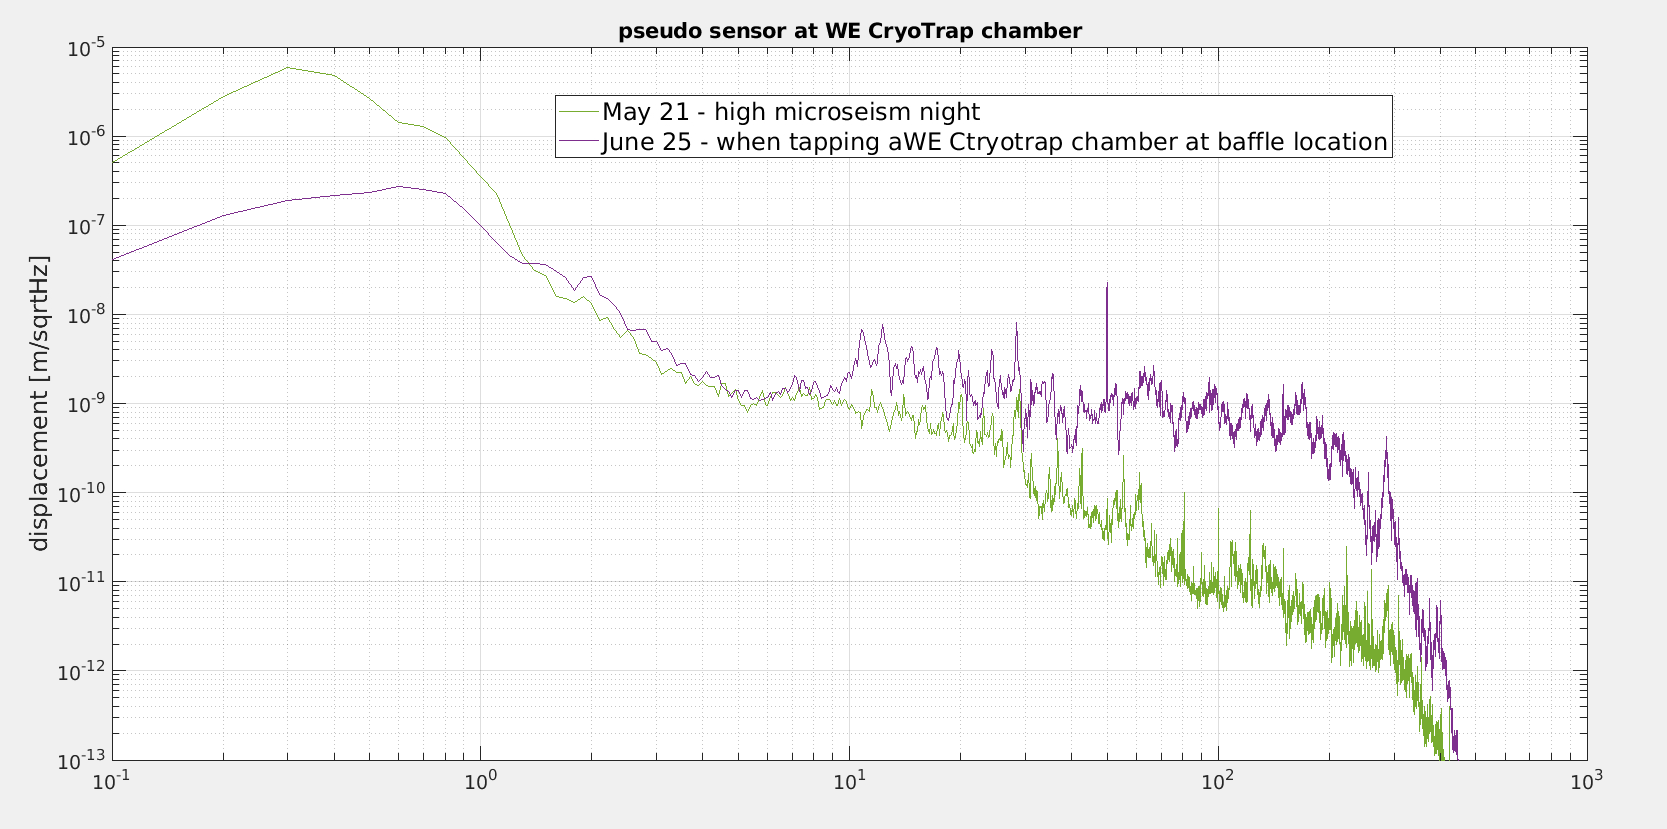
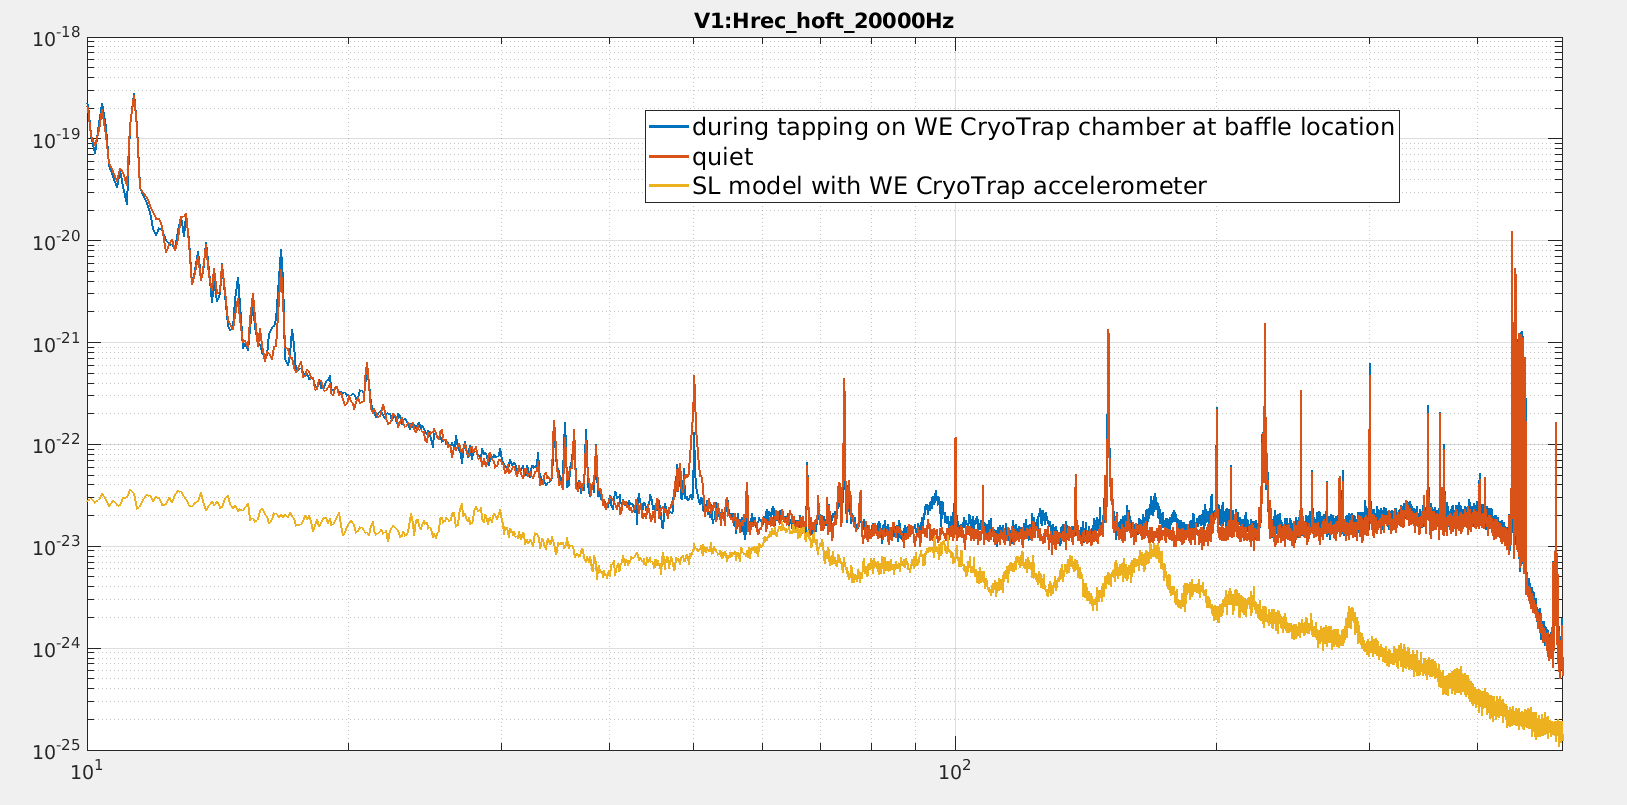
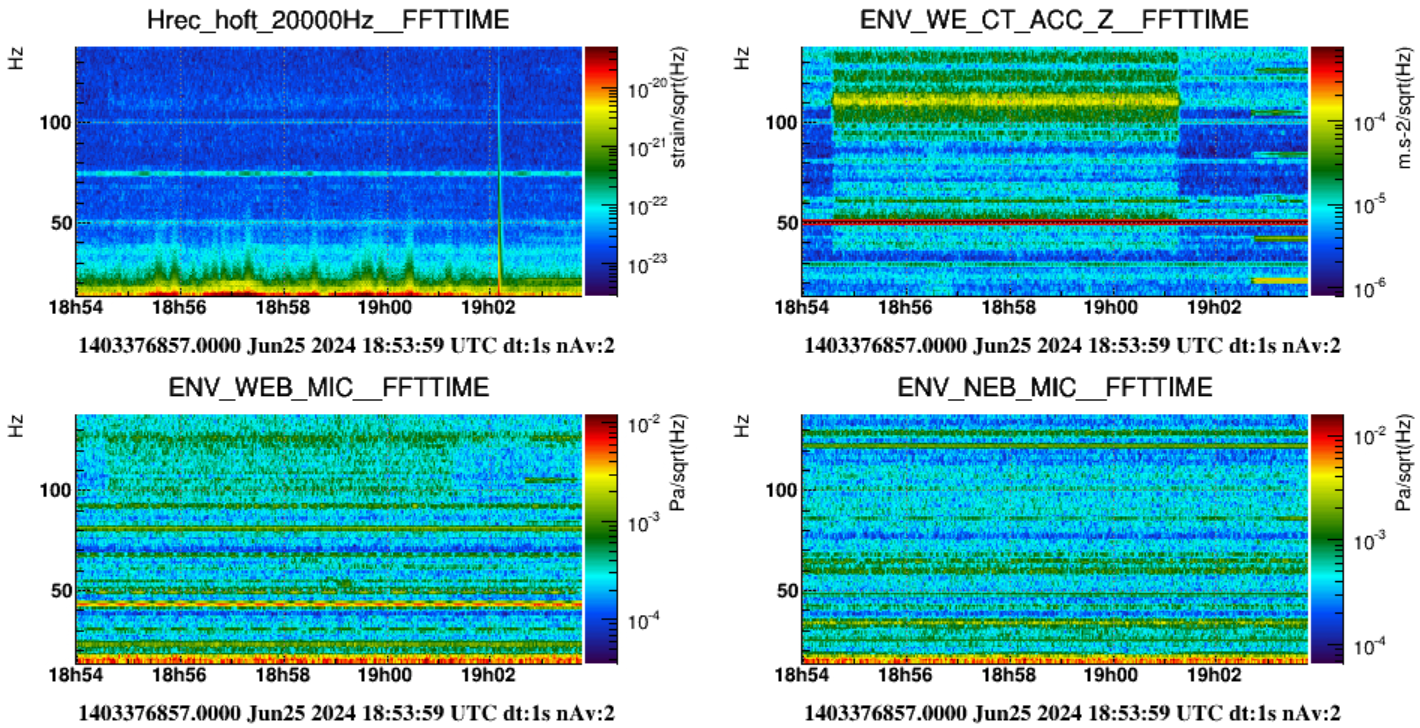
I derived a seismic displacement signal by combining the WE Guralp sensor, W channel (ENV_WEB_SEIS_W) for the low frequency part (below 10Hz), and the accelerometer sensor mounted on the CryoTrap vacuum chamber in correspondence of the anchoring location of the Cryo-Baffle (ENV_WE_CT_ACC_Z) which I high-pass filtered above 10 Hz. Figure 2, the green curve is the displacement spectrum of "psedo-sensor" on the same 60min high-microseism period of May 21.
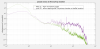
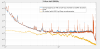
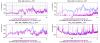
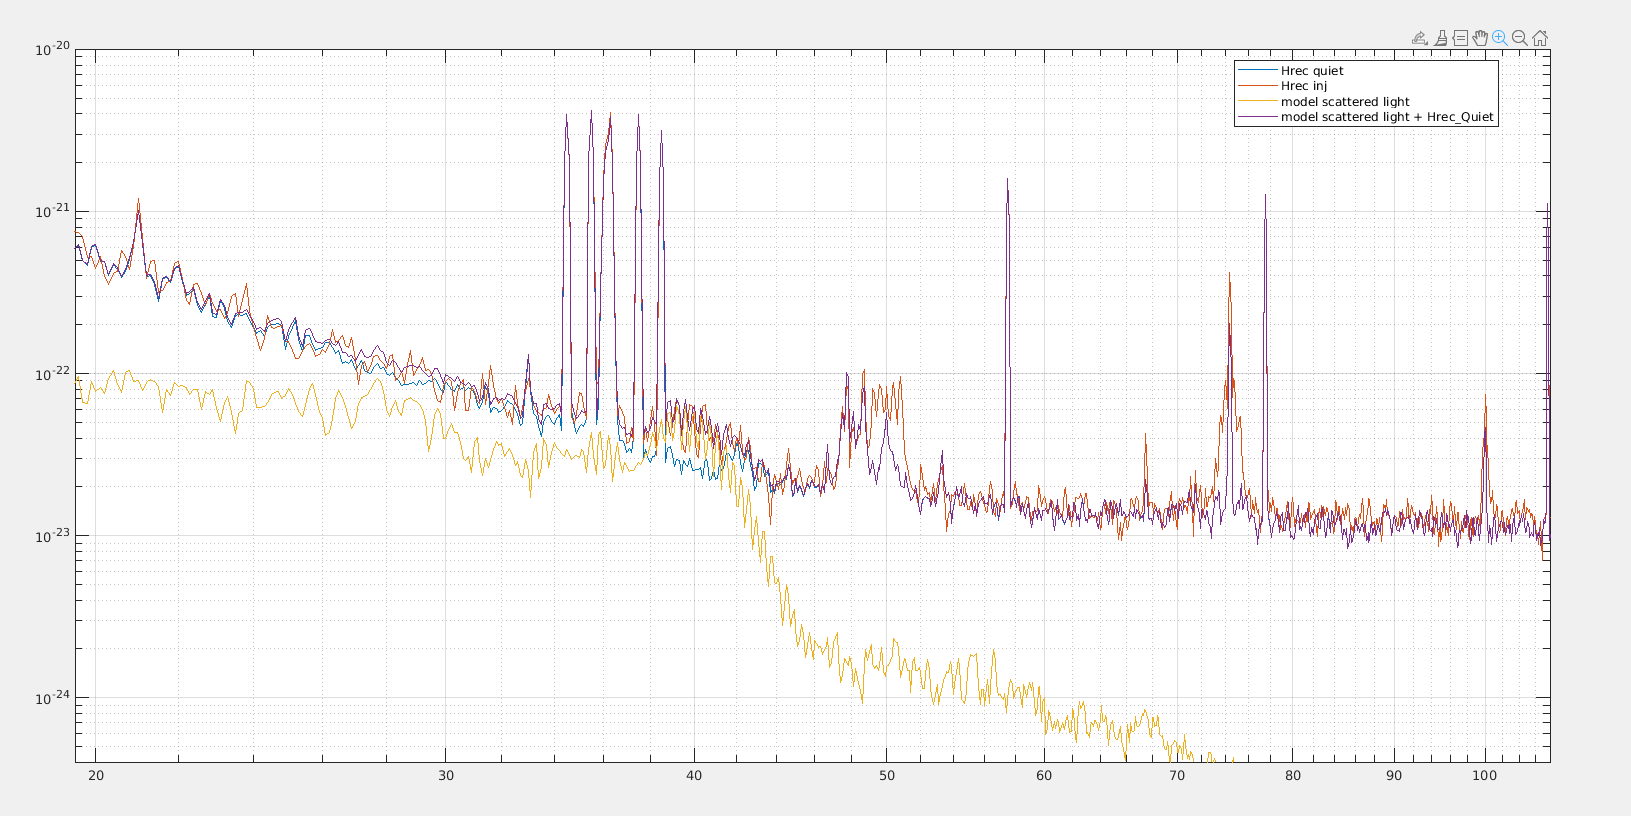
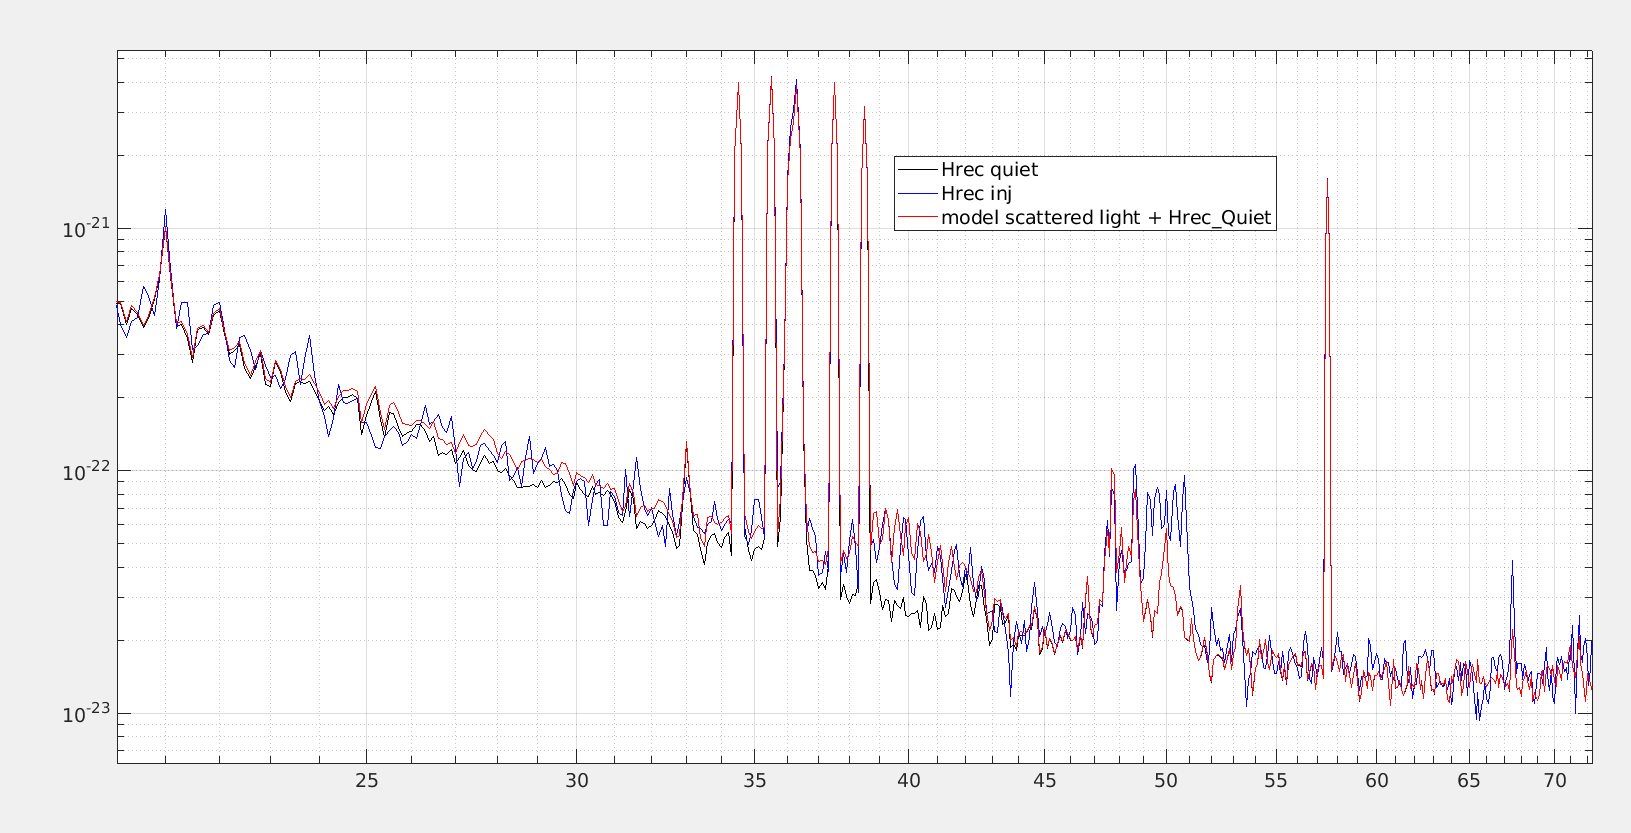
Then, applying the well known SL model, I adjusted the multiplicative "G" factor in order to match the arches (which here appear as a "shoulder") in the Hrec spectrum: Figure 3 or Figure 4 (Figure 4 reports just the measured data (blue), and (red) the SL model quad-summed to a low-microseism data taken on May 21 00:00). The derived G value is 1.0E-21. This gives a measure of the "amount of scattered light" from the unknown scatterer.
Last, I applied the SL model with the same G value to the measured data during our tappings at the WE cryo-baffle location. The displacement signal of the "pseudo-sensor" is reported in Figure 2, violet color. Figure 5 shows the measured hrec data during the tapping (blue), and superposed the SL model (yellow). It seems interesting that the modelled noise is close to reproducing the bumps excited with the tapping action.
In my opinion this is not a proof that baffle is the scatterer, but is telling us that with our tapping actions we were "stimulating" the same scatterer that is responsible of the arches during high microseisms.... or better, if not the same, a scatterer that scatters the same amount of light.
The fact that the frequency of the measured bumps somehow correspond to the model (Figure 5), and considering what Maria posted in the previous comment, the cryo-baffle, or something else that moves together with the exterior chamber of the WE cryo-trap, seems to be a good candidate.
During the last tapping test done on June 25 with the shaker in the 40-200 Hz band, there was some coincident noise in h(t), around 110 Hz
and also some higher noise in h(t) below 50 Hz.
We installed the accelerometer ENV_WE_HRSIDE_ACC_Z on the cylindric vacuum pipe. Due to an issue with WE HVAC (elog #64913) and WE suspension (elog #64910), the WE scattered light investigation could not be performed.

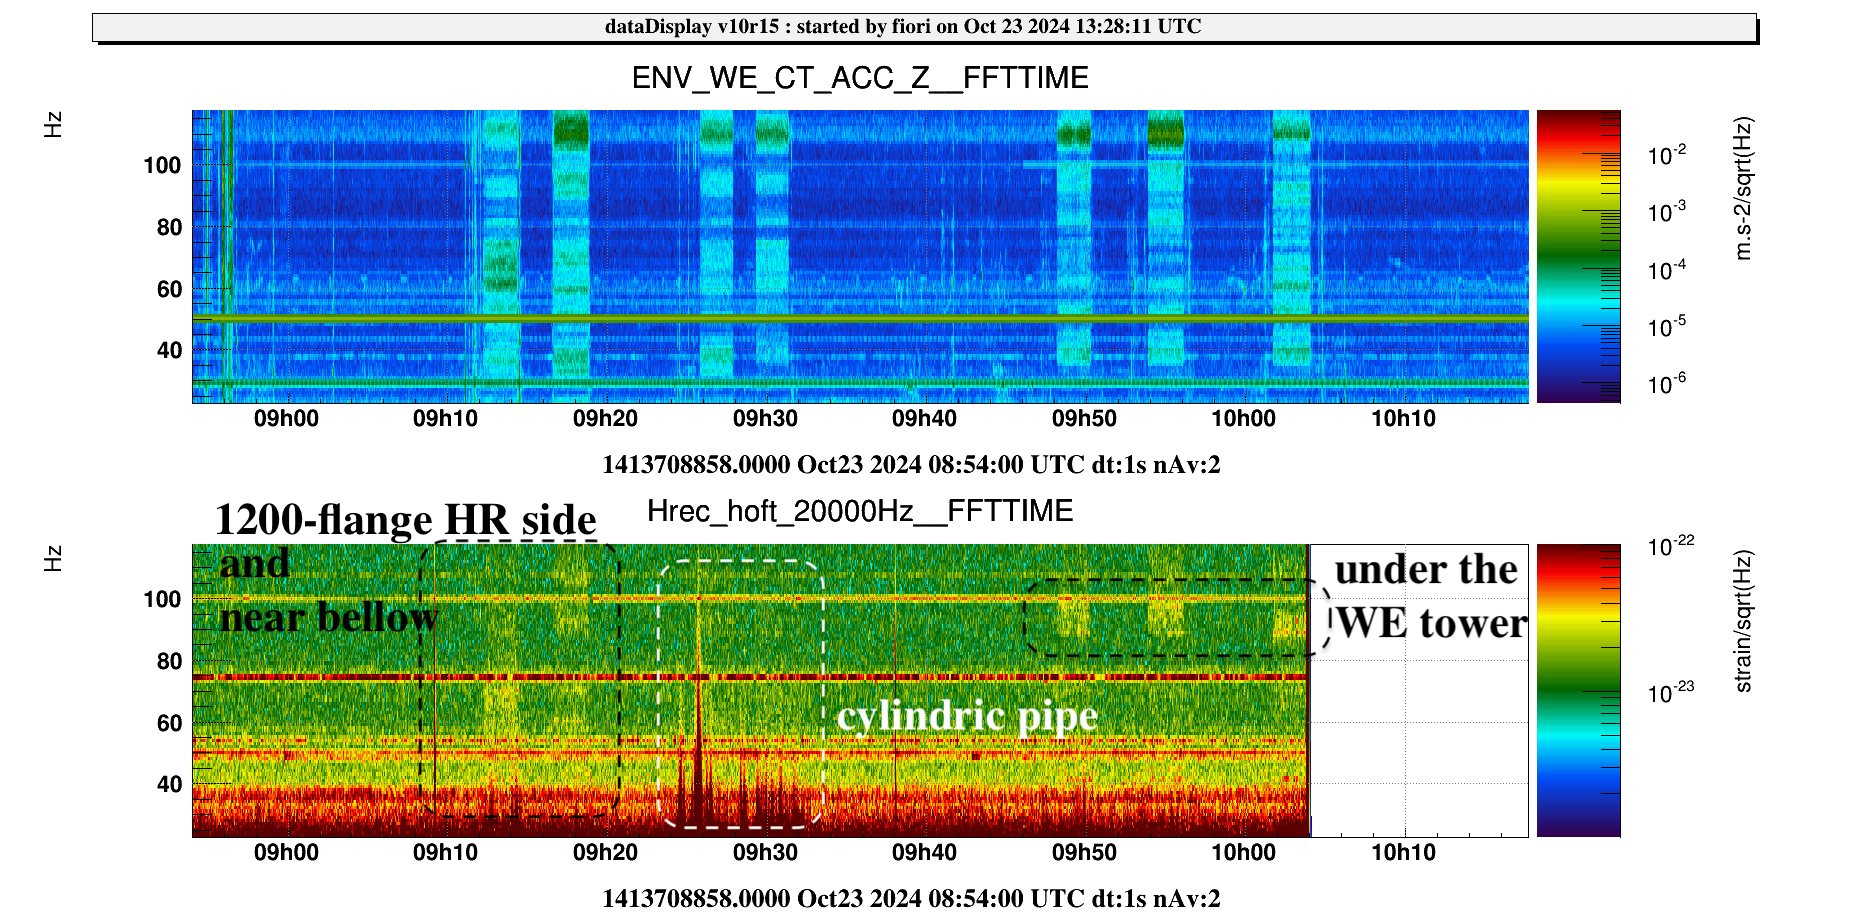
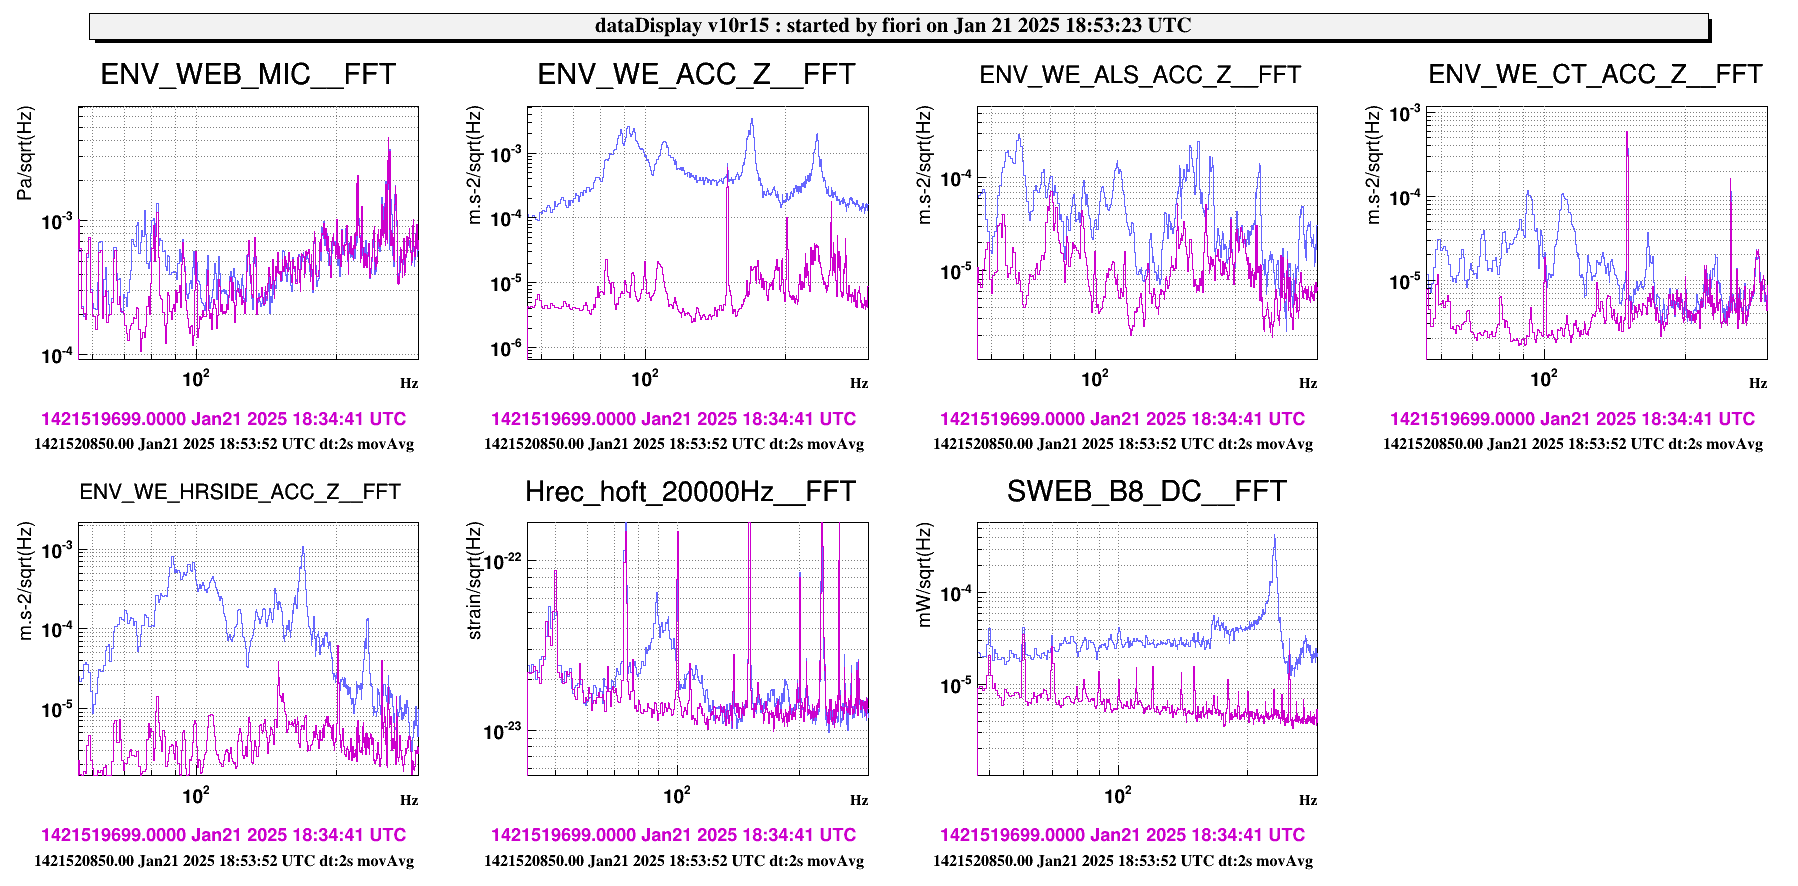
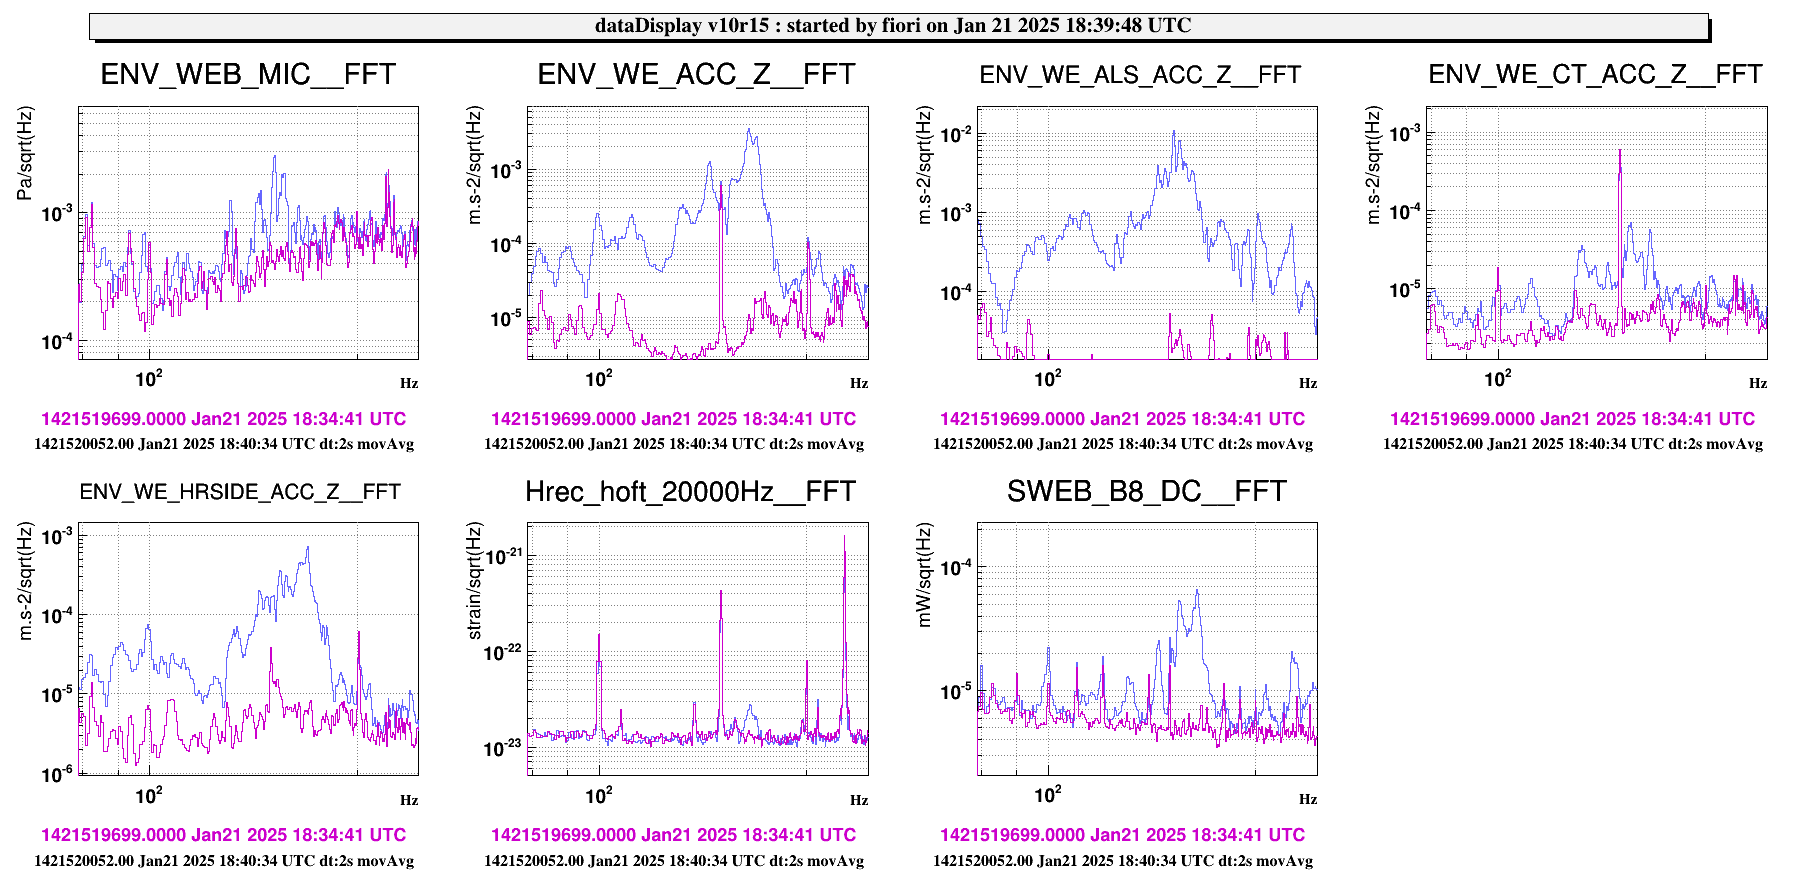
We returned to WEB and performed tappings in different locations. Each tapping consists of 2 minute long sequence of fast hits with the hammer tool. Accelerometers on the cryotrap vacuum chamber (ENV_WE_CT_ACC_Z), on the 1200 flange AR side (ENV_WE_ACC_Z) and on the symmetric flange on HR side (ENV_WE_HRSIDE_ACC_Z) are used as calibrated monitors of how much vibration propagates to the different parts.
We tapped in the previously tested locations excluding those that did not produce effects, plus locations under the tower that were not tested before. This time we have the accelerometer monitor on the 1200-flange HR side.
We then went to NEB and repeated a similar (reduced) set of tappings.
The WEB tapping locations are:
- near VAT flange
- structure around cryo-trap holding points (4 of them) both in horizontal and vertical direction (PICTURES)
- cryotrap chamber in correspondence of the cryo-baffle (south side (near CT_ACC) and north side (opposite of CT_ACC))
- near bellow (tower side)
- 1200-flange HR side
- cylindric vacuum pipe (two locations)
- under tower: HR side, HR side gap, AR side (PICTURES)
The NEB tapping locations are:
- near VAT flange
- structure around cryo-trap holding points (only 1) both in horizontal and vertical direction
- cryotrap chamber in correspondence of the cryo-baffle (east side (near CT_ACC))
- near bellow (tower side)
- 1200-flange HR side
- under tower: HR side, HR side gap, AR side
Some preliminary concluding notes:
- Tappings at NE did not produce effects in Hrec (apart from a little structure at 128Hz when tapping under the tower, to be confirmed if correlated to our actions)
- Tappings at WE:
- the lagest effects in hrec is seen when tapping on the cryotrap chamber (cryo-baffle position and "holding point structure")
- in some locations (holding points, FIGURES) the CT ACC seems a good witness of the frequency of the scattering bump in hrec.
- sometimes also harmonic peaks are seen in hrec (FIGURES)
- on the tower side and under the tower the hrec is excited less, and mainly in the region below 60-100Hz and around 100Hz
.jpg)
.jpg)
.jpg)

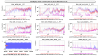
A few additional plots:
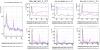
WEB tappings
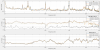
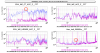
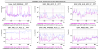
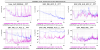
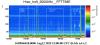
- very clear non linear effect is visible when tapping on structure of CT holding point NE (Figure 1): the 200Hz excitation sensed by the CT accelerometer correlates to peaks at 200, 400, 600 and 800Hz in hrec (nothing seen by accelerometers on tower side)
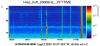
- another clear non linear effect when tapping on structure of CT holding point NW (Figure 2): the 170Hz excitation sensed by the CT accelerometer correlates to peaks at 170 Hz and 340 Hz in hrec
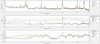
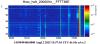
- tapping on the SW holding point structure excites a close pair of main peaks at 220 and 230 in the CT accelerometers, this matches to a pair peaks in hrec, but also other peaks are excited in hrec: 90Hz, 130 Hz, 145Hz (Figure 3)
NEB tappings:
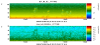
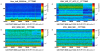
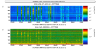
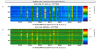
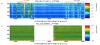
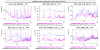
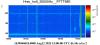
- spectrogram overview of NEB tappings (Figure 4): no visible effects in Hrec, except for ...
- a 128 Hz narrow peaks that excites with tappings under the tower HR side (Figure 5)
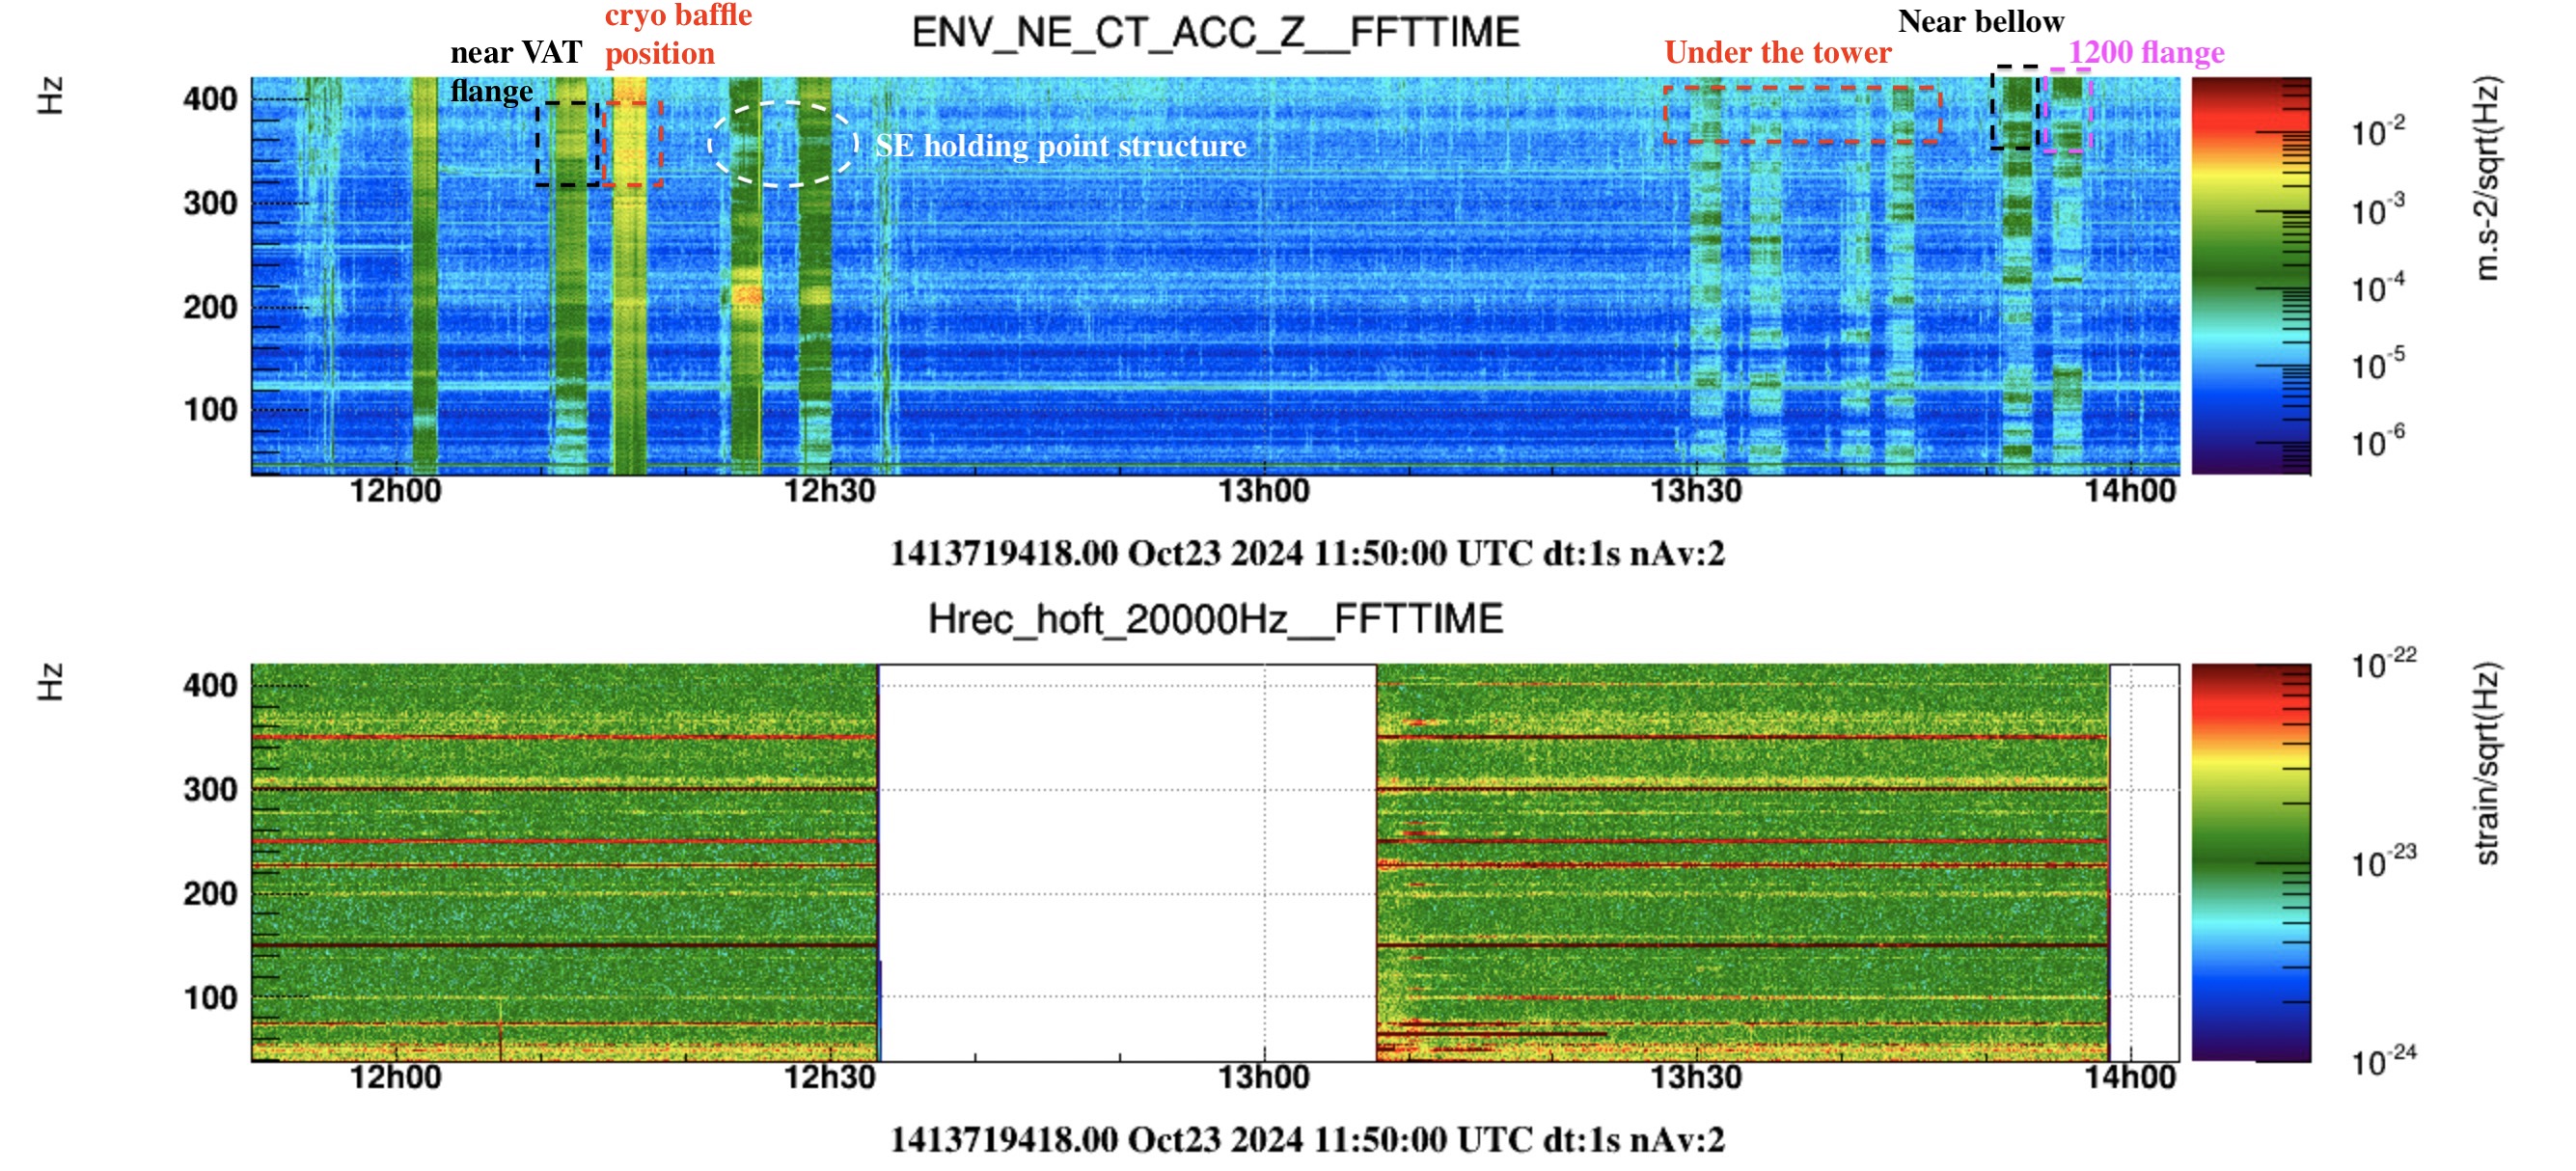
- Figure 6 shows the tapping on SE holding point structure, evidencing that the main excited vibration sensed by the CT accelerometer is around 210 Hz, similar to what occurred in WEB (cryotraps excite in similar way).
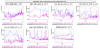
The objective of today's campaing is investigating the 123 Hz bump . We performed the following actions:
- Figure 1. repeated broadband acoustic injections in the sme configuration. This time the peaks excited in hrec are evident and similar to what observed in the past. Confirming that the broadband excitation observe in https://logbook.virgo-gw.eu/virgo/?r=65839 was most likely do to the effect of high microseism. A small structure at 123Hz is likely present
- Tappings in several locations (60 s each). Details are in the attached log file. A summay is the following:
- SW NE and NW metallic structure around holding point - we find similar results as in the past
- SWEB flange facing WE mirror - excited 165 Hz peak in hrec - Figure 4
- link pipe - no effect in hrec
- SWEB chamber - no effect in hrec
- Viewport on AR side - bump at 90 Hz in hrec, 230Hz peak in B8: similar frequencies are excited in WE accelerometers; Figure 2
- WE tower belly, excited at 90 and 167 Hz in Hrec and B8, Figure 3
- Sound beating:
- we tested a few frequencies around 120 Hz (123, 123.5, 120, 133...). We observed in all cases a corresponding modulated excitation in Hrec. Data are to be analyzed to find correlation with modulation in accelerometers.
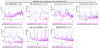
We performed a set of tappings in order to asses the status of scattered light noise at the WE after the installation of the new WE mirror with the front coated baffle in place. We tapped the same positions done in 65378. Specifically:
- positions on CryoTrap side: CT holding points (Nort-East, North-West, South-East) , VAT flange
- positions HR side: bellow, 1200 flange, cylindric vacuum pipe
- positions AR side: cylindric vacuum pipe, 1200 flange, viewport
All times of tappings and notes are listed in the attached file. Each tappping lasted 120seconds.
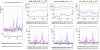
Some observations we made:
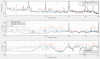
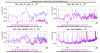
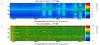
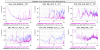
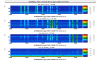
The CryoTrap side is much quiter than before, in fact despite providing approx. the same level of seismic excitation, we do not see significant impact in Hrec (just a tiny peak at 195Hz when tapping on the SE holding point) and associated to a peak in CT accelometer. See Figure 1. Also, tiny peaks around 100Hz and at 195Hz when tapping on the VAT flange. See Figure 2.
The position on the tower at the HR side cause some some excitation in hrec around 100Hz, a bit louder when tapping on the 1200 flange. When tapping close to the bellow, in addition to small noise structures around 100Hz we also caused the rise of hrec noise below 30Hz: Figure 3 and Figure 4 (spectrogram showing the set of the three tappings HR side)
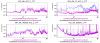
The AR side instead looks more touchy. Tappings on AR side excited similar peaks as Before (66031). In Particular at 90Hz, 167 Hz and 42 Hz (narrow). We observe that the peak at 167Hz looks a resonance of the flange, since it gets very loud in the accelerometer (AR flange) in which a residual is present also during the quiet, see Figure 5. When tapping on the viewport we notice a similar correspondence between the 90Hz peak in Hrec and the accelerometer: Figure 6.
The overall impression is that while we mitigated the sensitivity at the CT side, the AR side remains roughly the same. Some scattering (low level) seems to happen at the AR side, maybe the flange.
Figure 7 is an overview.
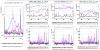
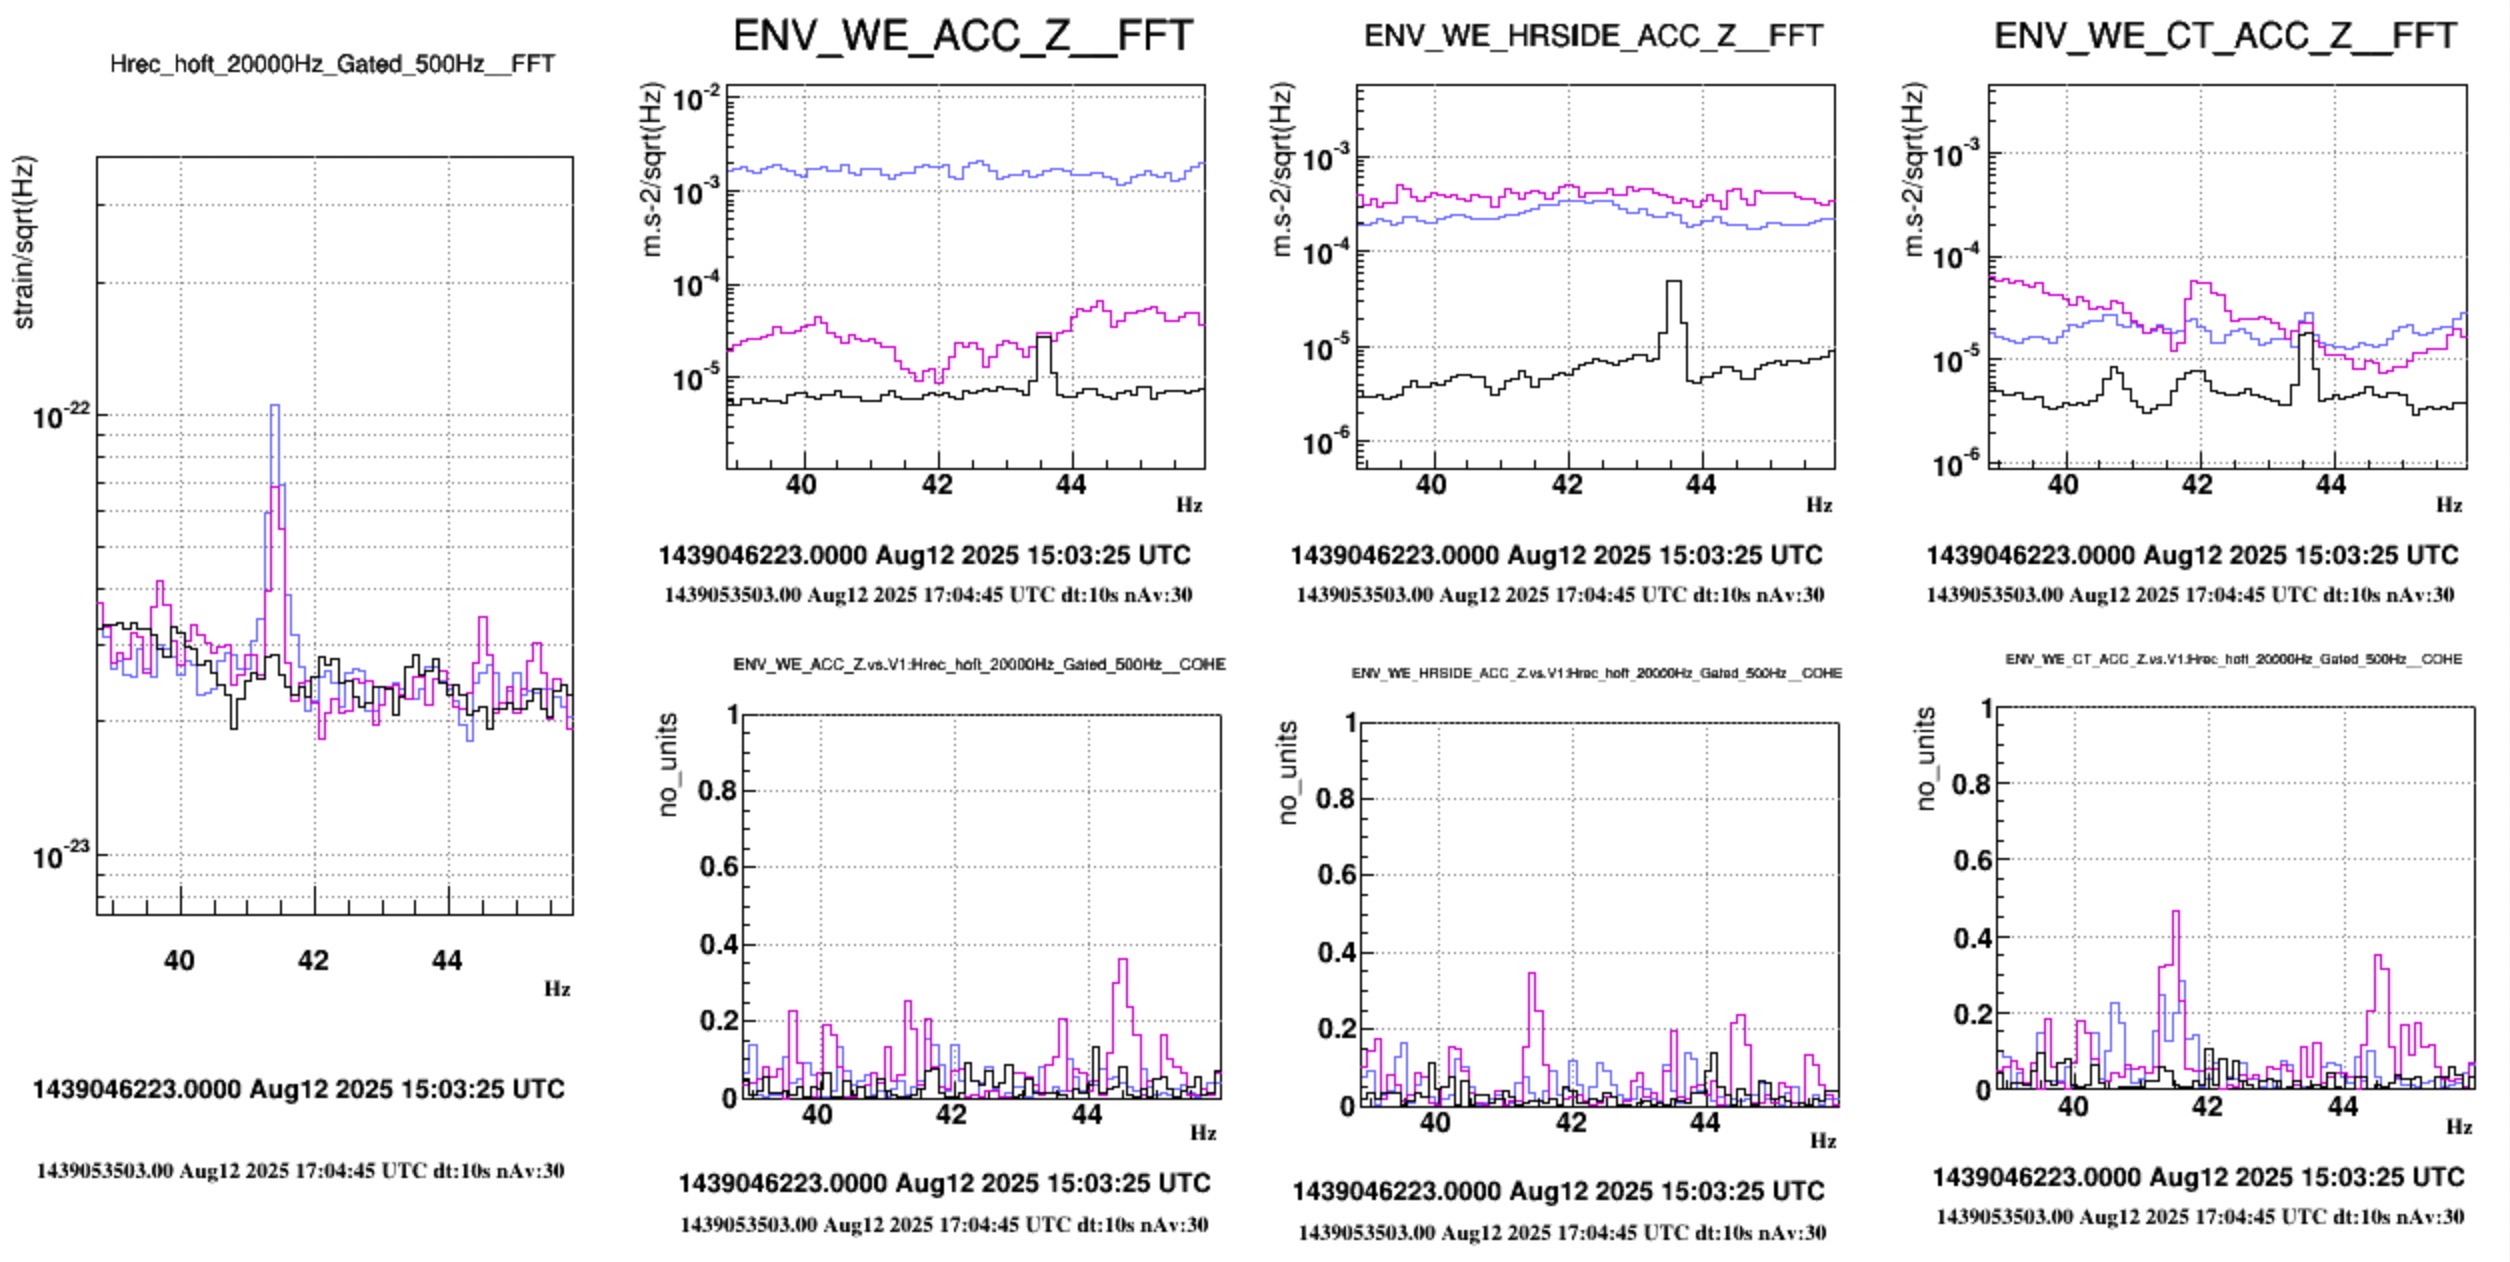
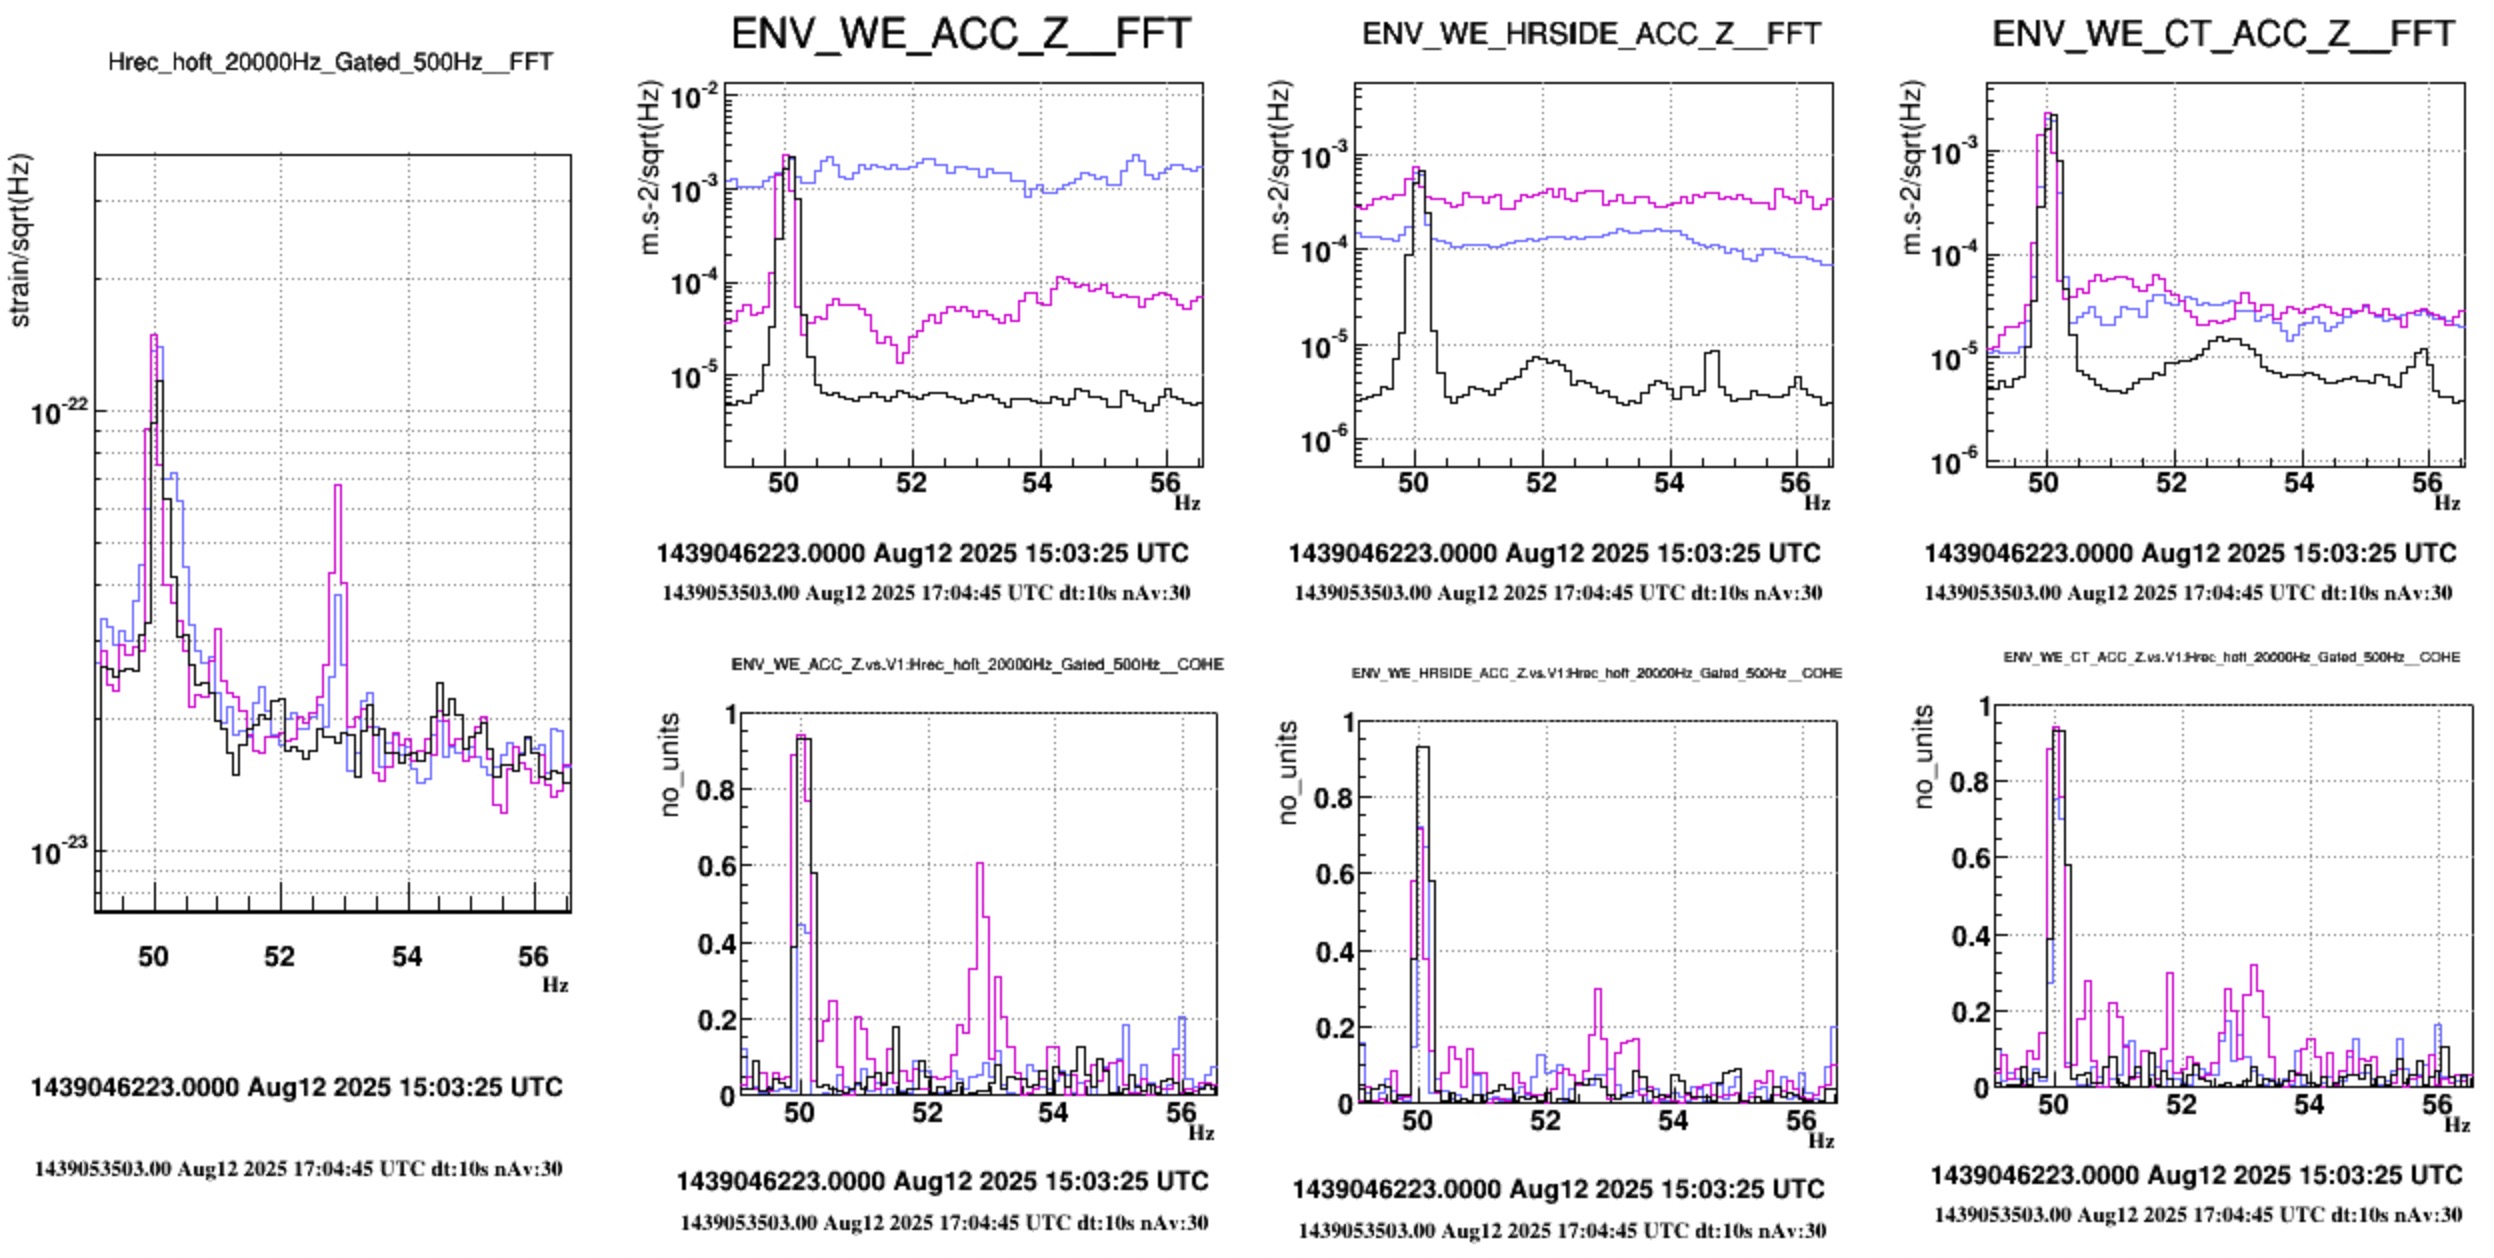
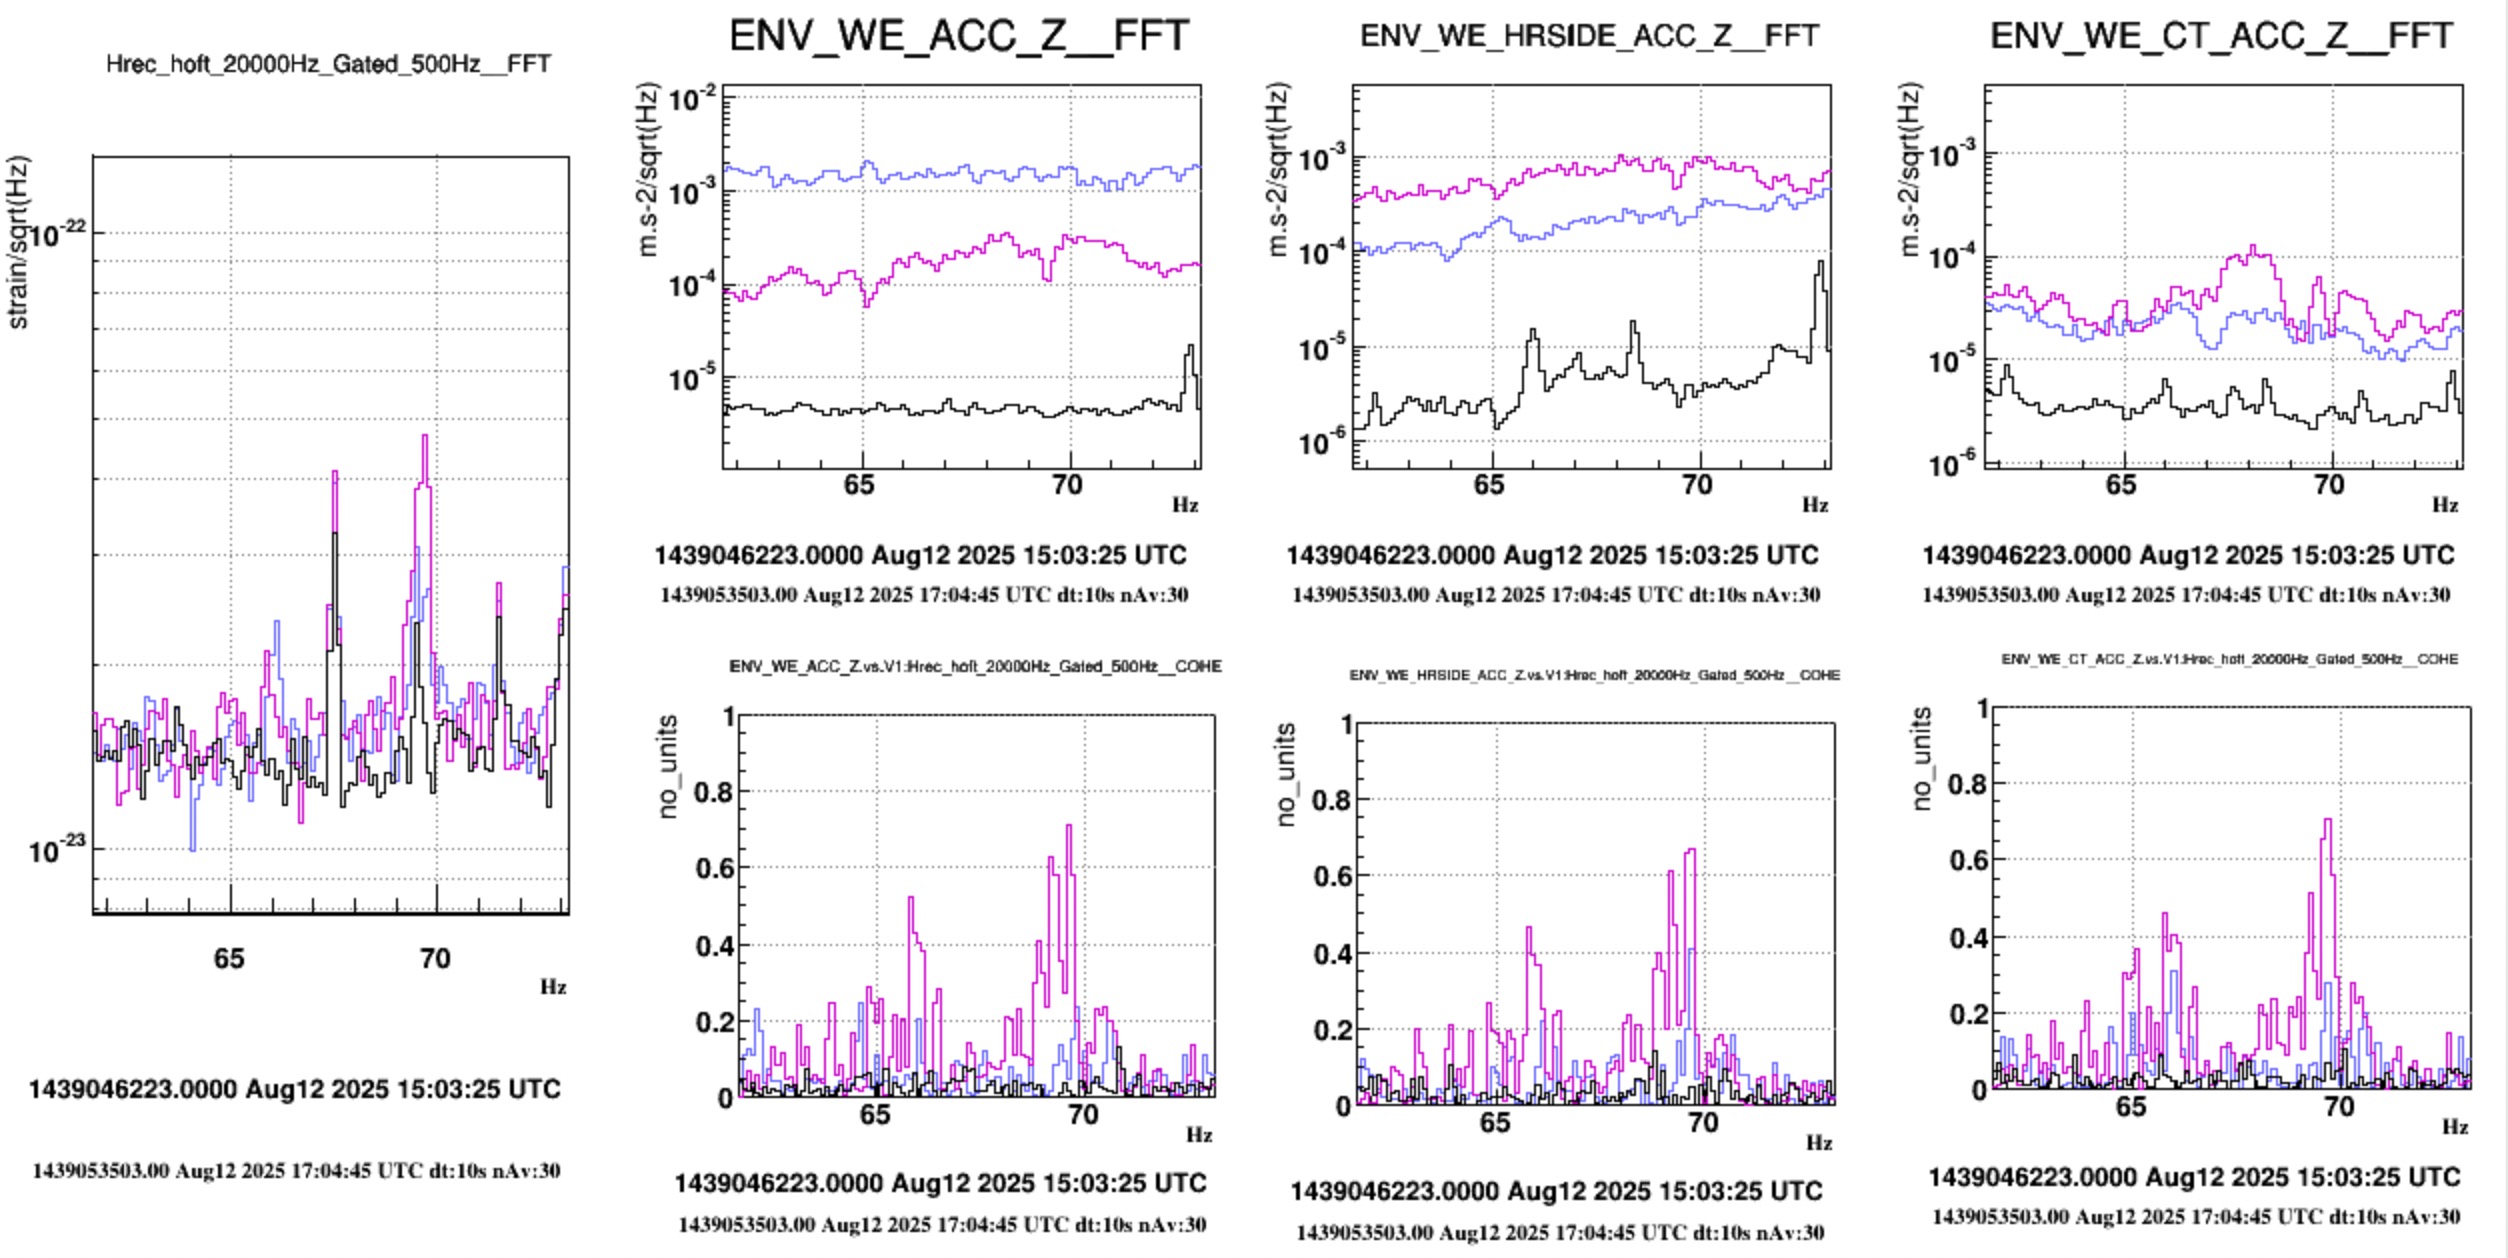
With a deeper examination of the Hrec data during the WE tapping sequence we notice a characteristic pattern that got excited when tapping from some of the locations.
The pattern, shown in the attached figures, consists of a family of narrow spectral peaks at precise frequencies (Hz) :
- 41.4
- 44.5
- 52.9
- 66.1
- 69.7
- 88.9
- 97.2
- 105.0
- 120.3
This pattern gets excited when tapping on locations at the tower chamber, not from CT locations. Most peaks are more excitable when tapping on HR side, but the 88 Hz is much louder in hrec when tapping the viewport on the AR side (the 41 Hz has a similar behaviour). Some coherence with accelerometer is present for all of them, pointing to a mechanical structure attached to the tower that gets excited by the tapping.
Tapping on the AR viewport also excited a clear peak at 167Hz which clearly associates to a corresponding peak in the AR flange accelerometer, as already noted in the previous.
Other notes:
- the excess noise appearing sometimes below 30 Hz and always lasting exactly 4 minutes, is now understood to be due to a reassessment of the Hrec online computation after a large impuse noise, sometimes due to our action: these are indicated with magenta circles and magenta arrows in Figure 1. Indeed the same noise is not seen in DARM. Thanks to Francesco DiRenzo for explaining this to us.
- we also notice a faint structure around 180Hz that was present during the first part of the shift apparently not correlated with our actions, in Figure 4.
.jpg)
.jpg)
.jpg)
As noted in https://logbook.virgo-gw.eu/virgo/?r=47107 a peak at 41.3 Hz was excited when doing a sweep-shaped shaking of the WE chamber, during O3.