Following the analysis initiated in logbook entries #61944 and #62161, I report here the plots of some of the glitches included in the dataset in logbook entry #62965 for the mini-Engineering Run.
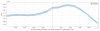
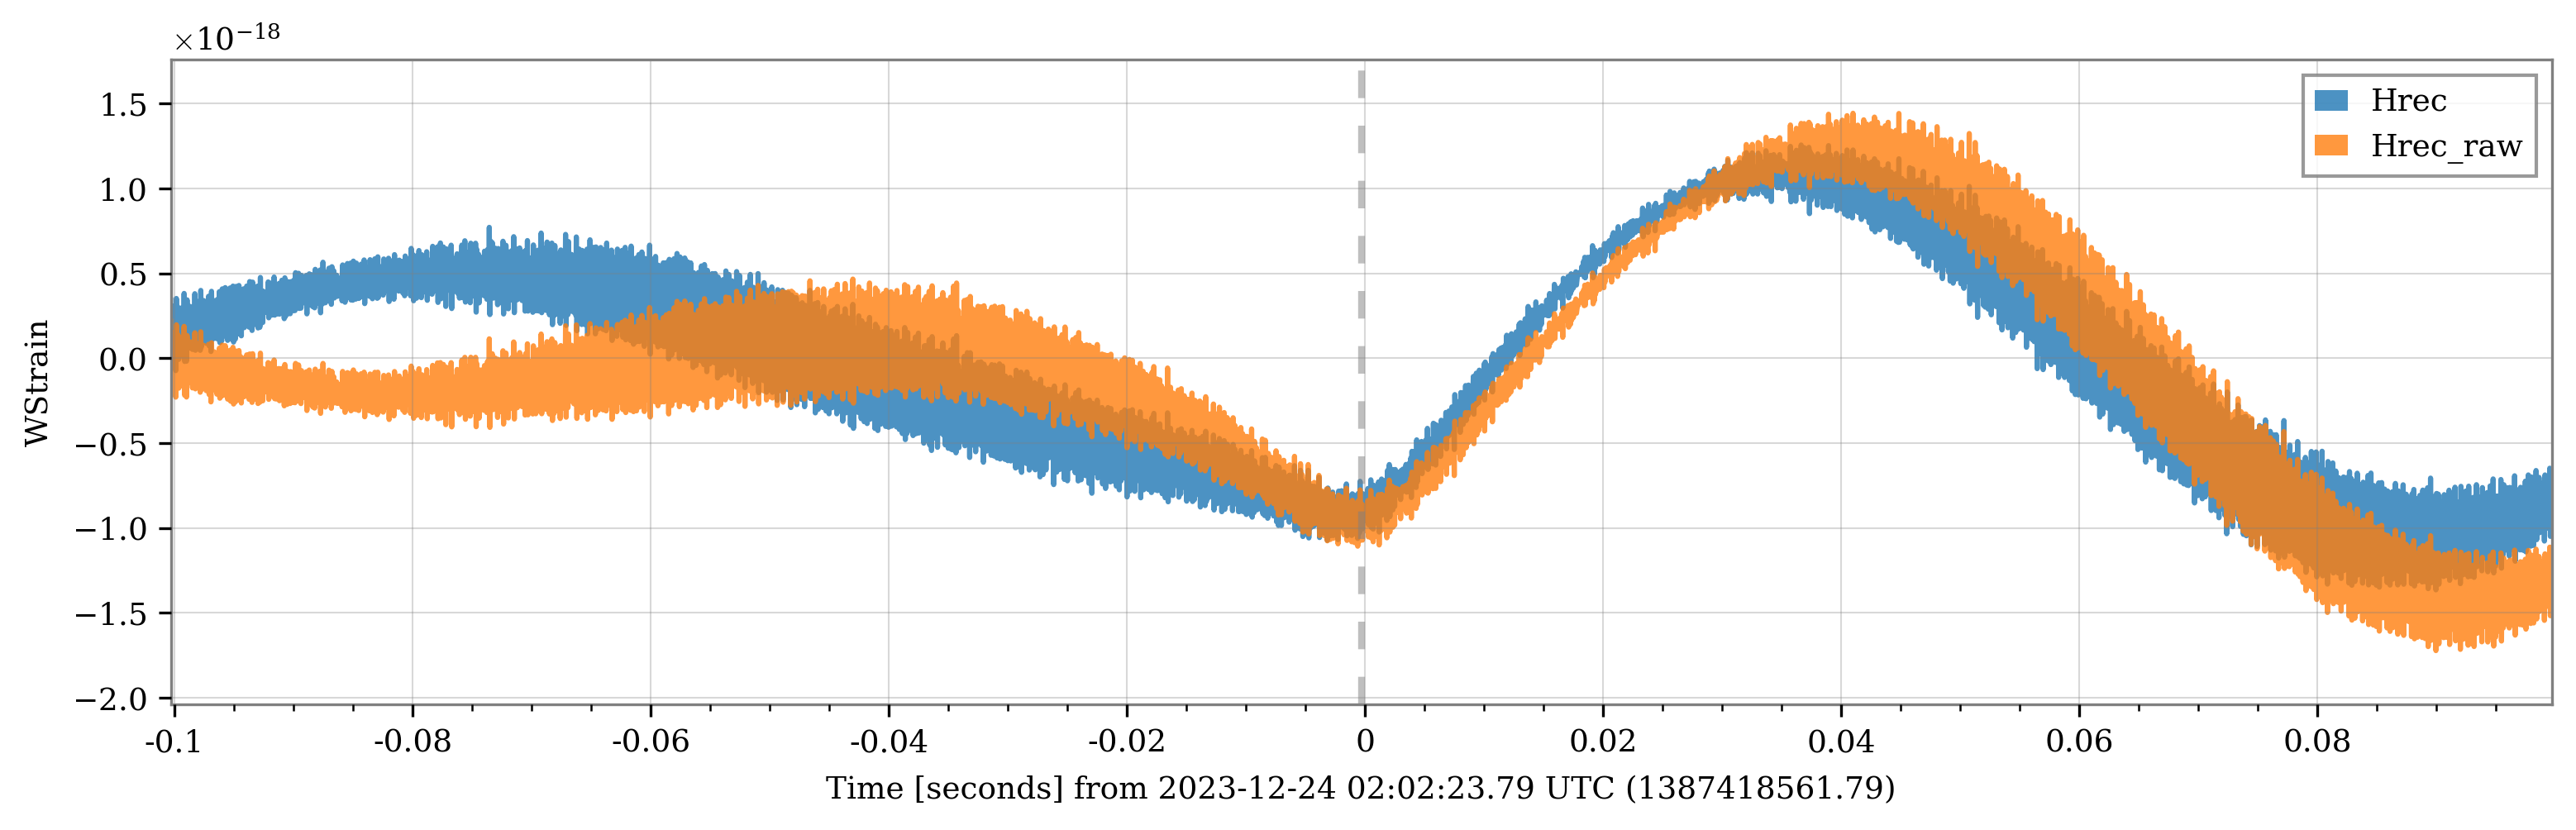
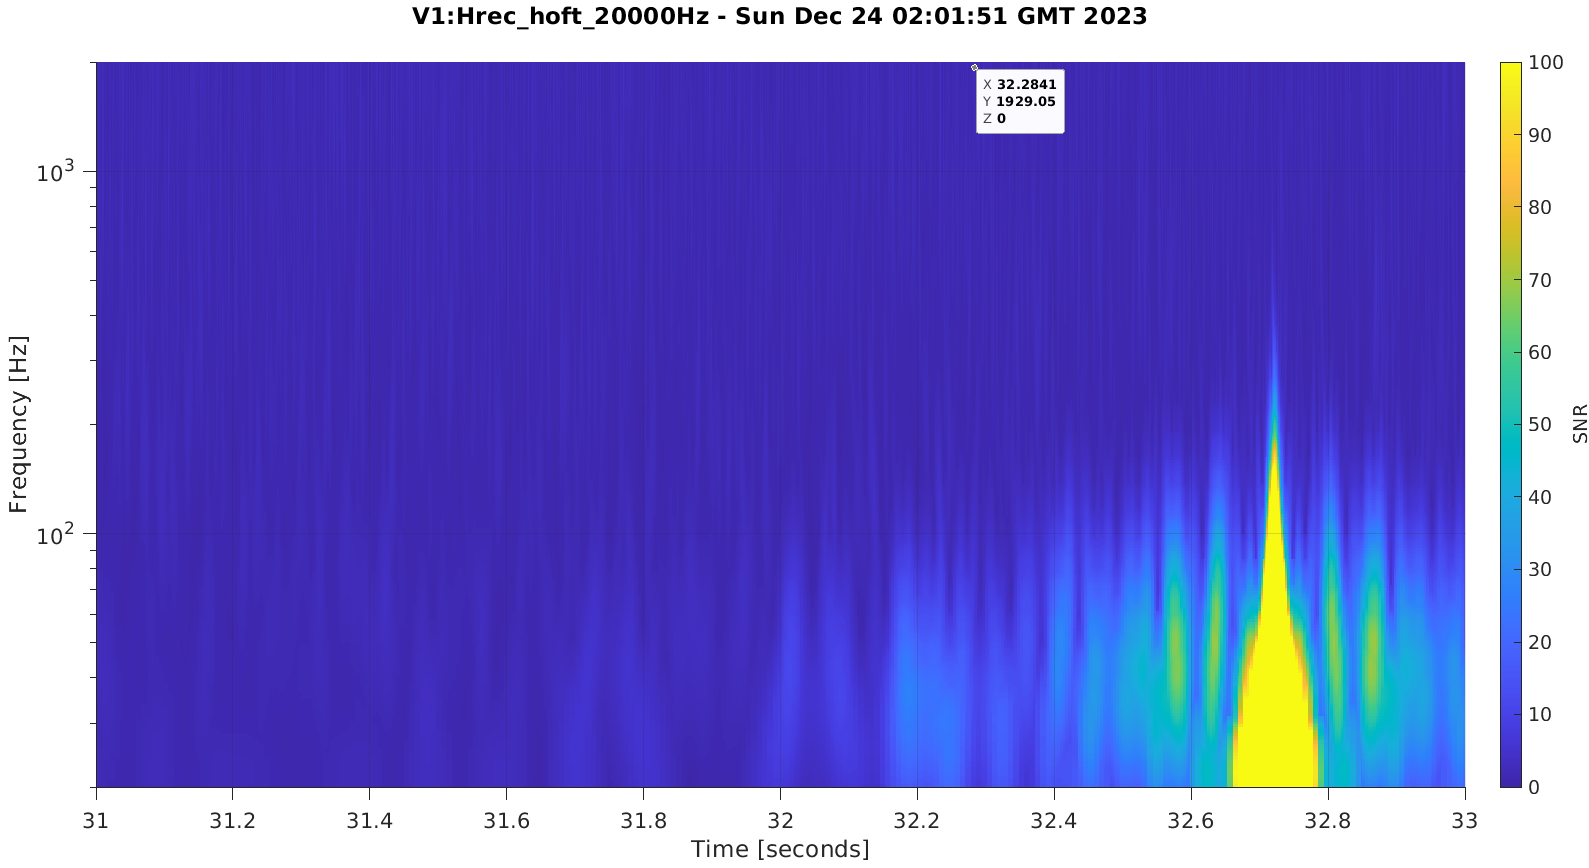
Figure 1 is an animated GIF with the first 20 glitches in the miniER dataset for the raw channel V1:Hrec_hoft_20000Hz. No filters have been applied. They almost all show some steep turnings at the times marked by the dashed line, which gives them an "elbows-like" waveform. Not sure if it matters but this turning seems to be "always" upward... Notice also that the time of the dashed line has been triggered by the excess energy in the whiten data, and it is slightly delayed from the omicron trigger time reported in the dataset. I assume the latter to be a characteristic time of the tile corresponding to the glitch.
Figure 2: the same behaviour is observable in Hrec_raw, for all the glitches.
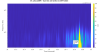
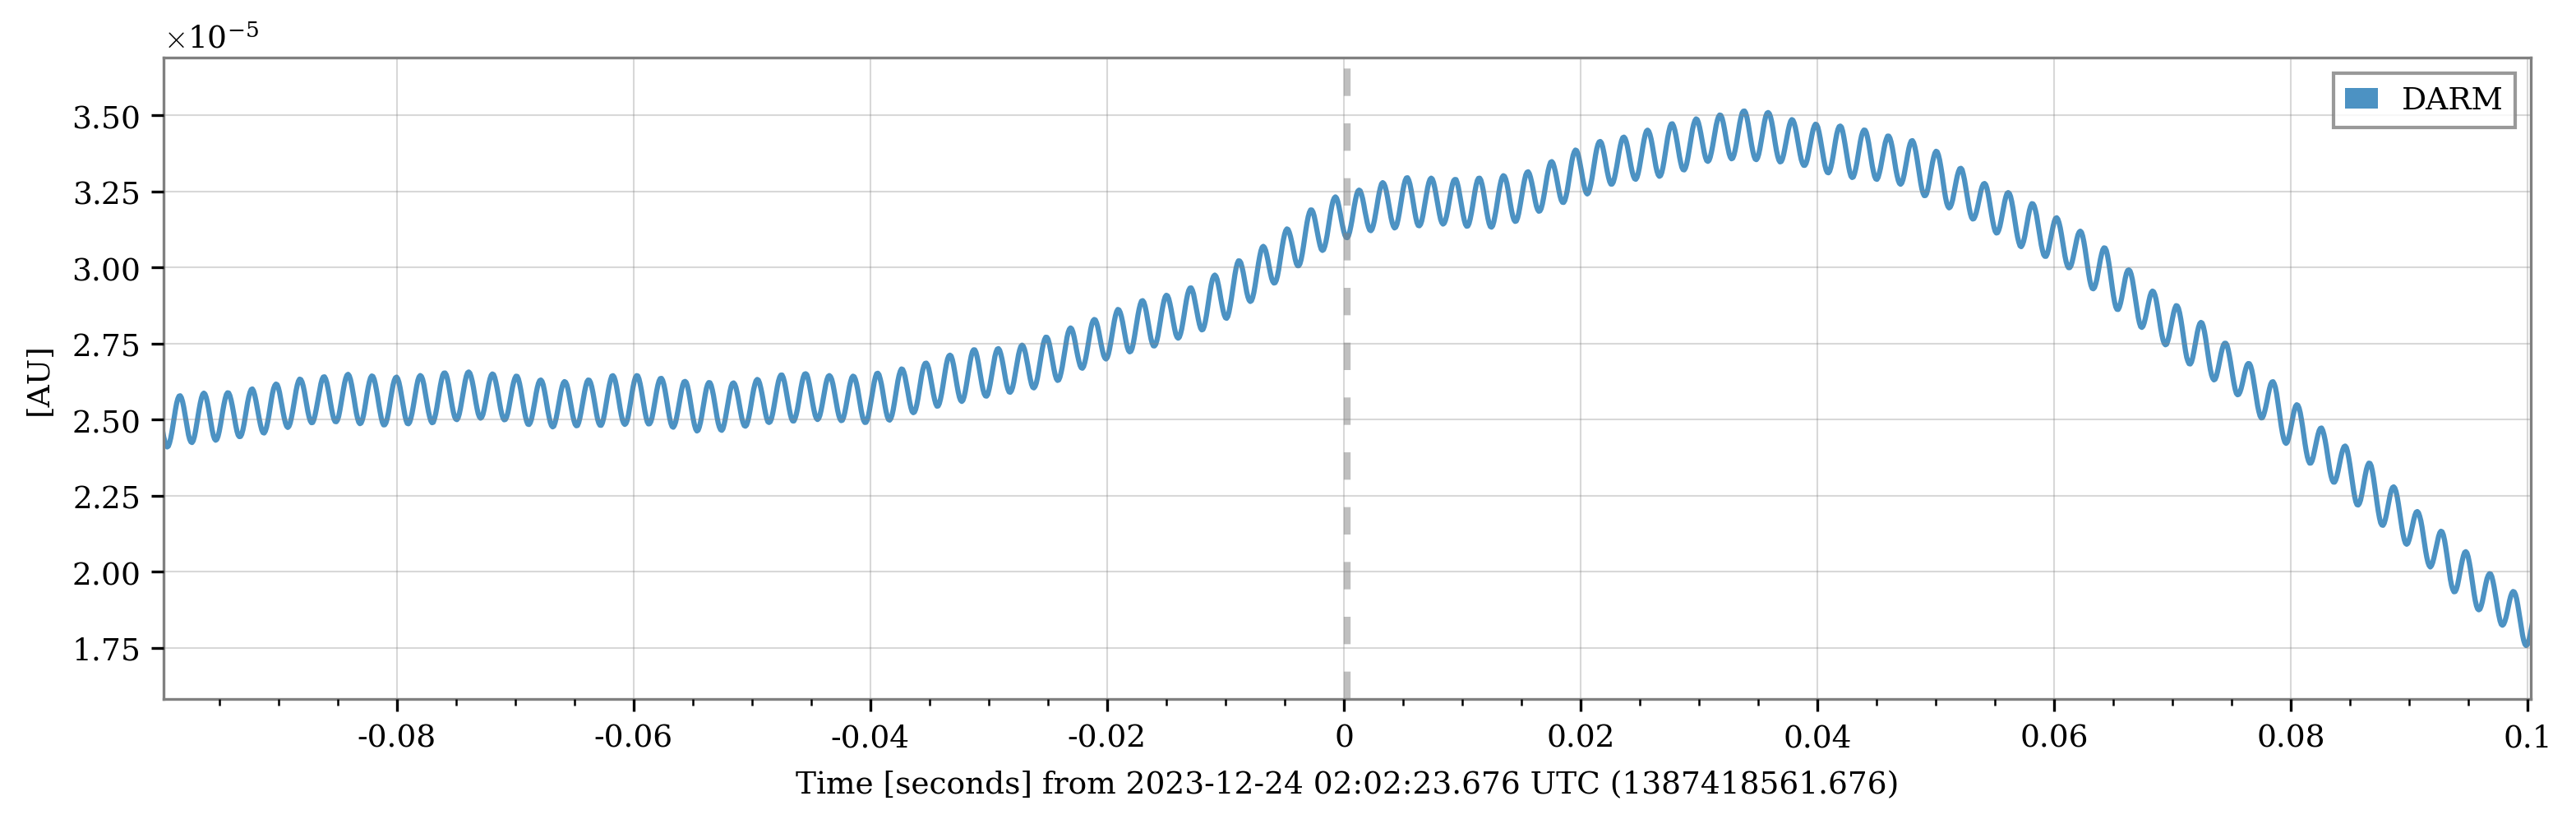
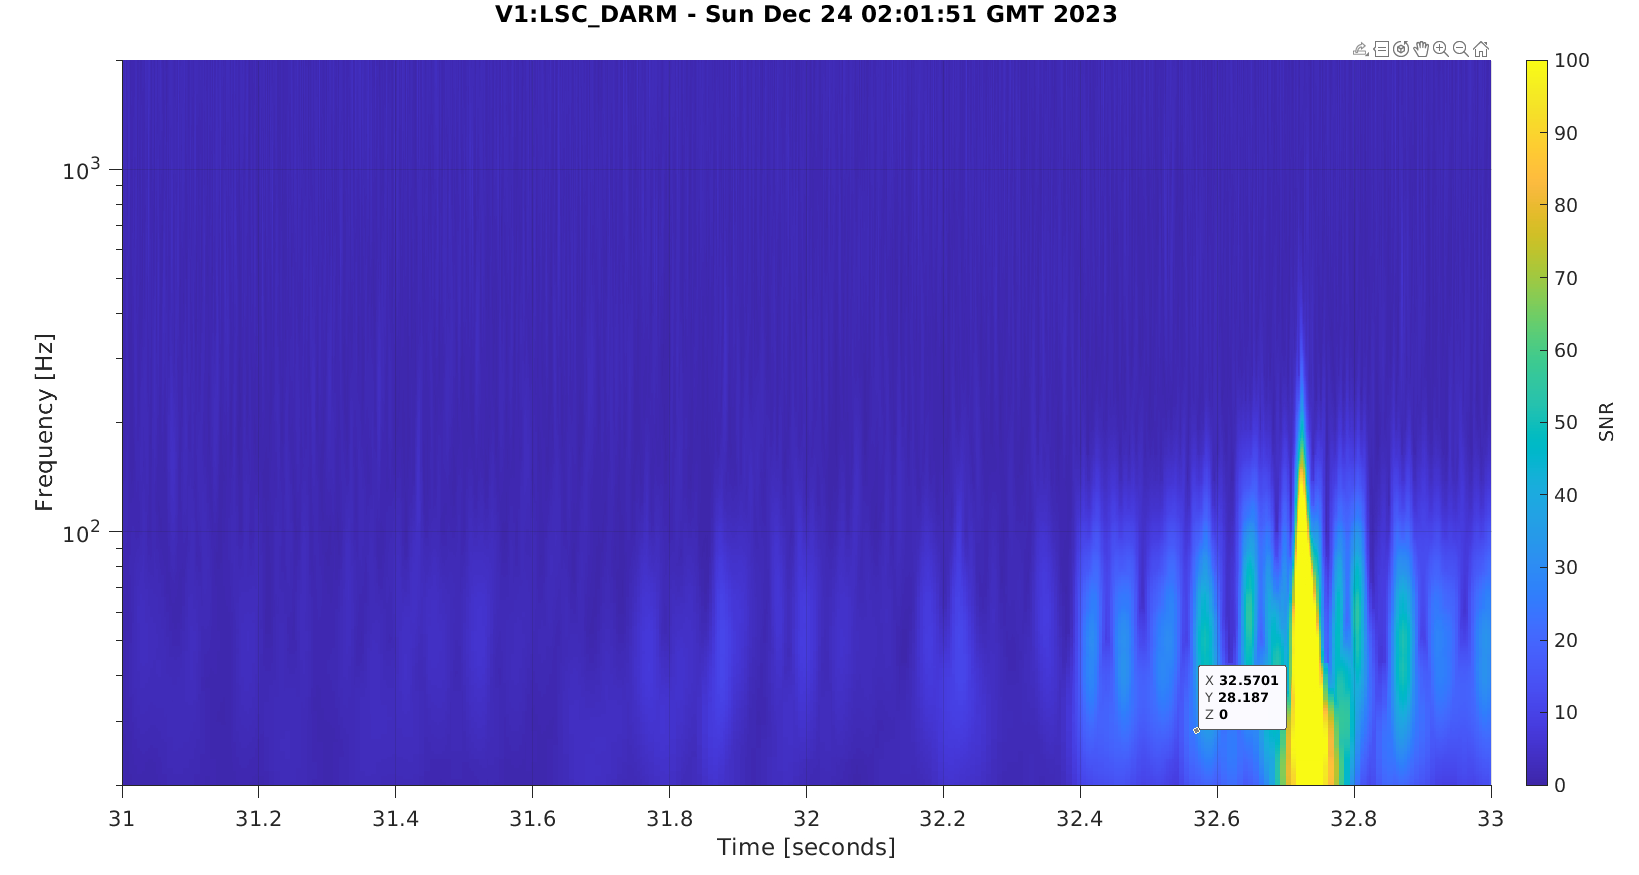
Figure 3: unfortunately, the glitch presence is a bit less recognizable in DARM. (the fast oscillations seem to correspond to the frequencies of the violin modes ~450 Hz) The one shown in the figure corresponds to that in the previous figure for Hrec. Notice one peculiar thing, shown in the next figure...
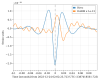
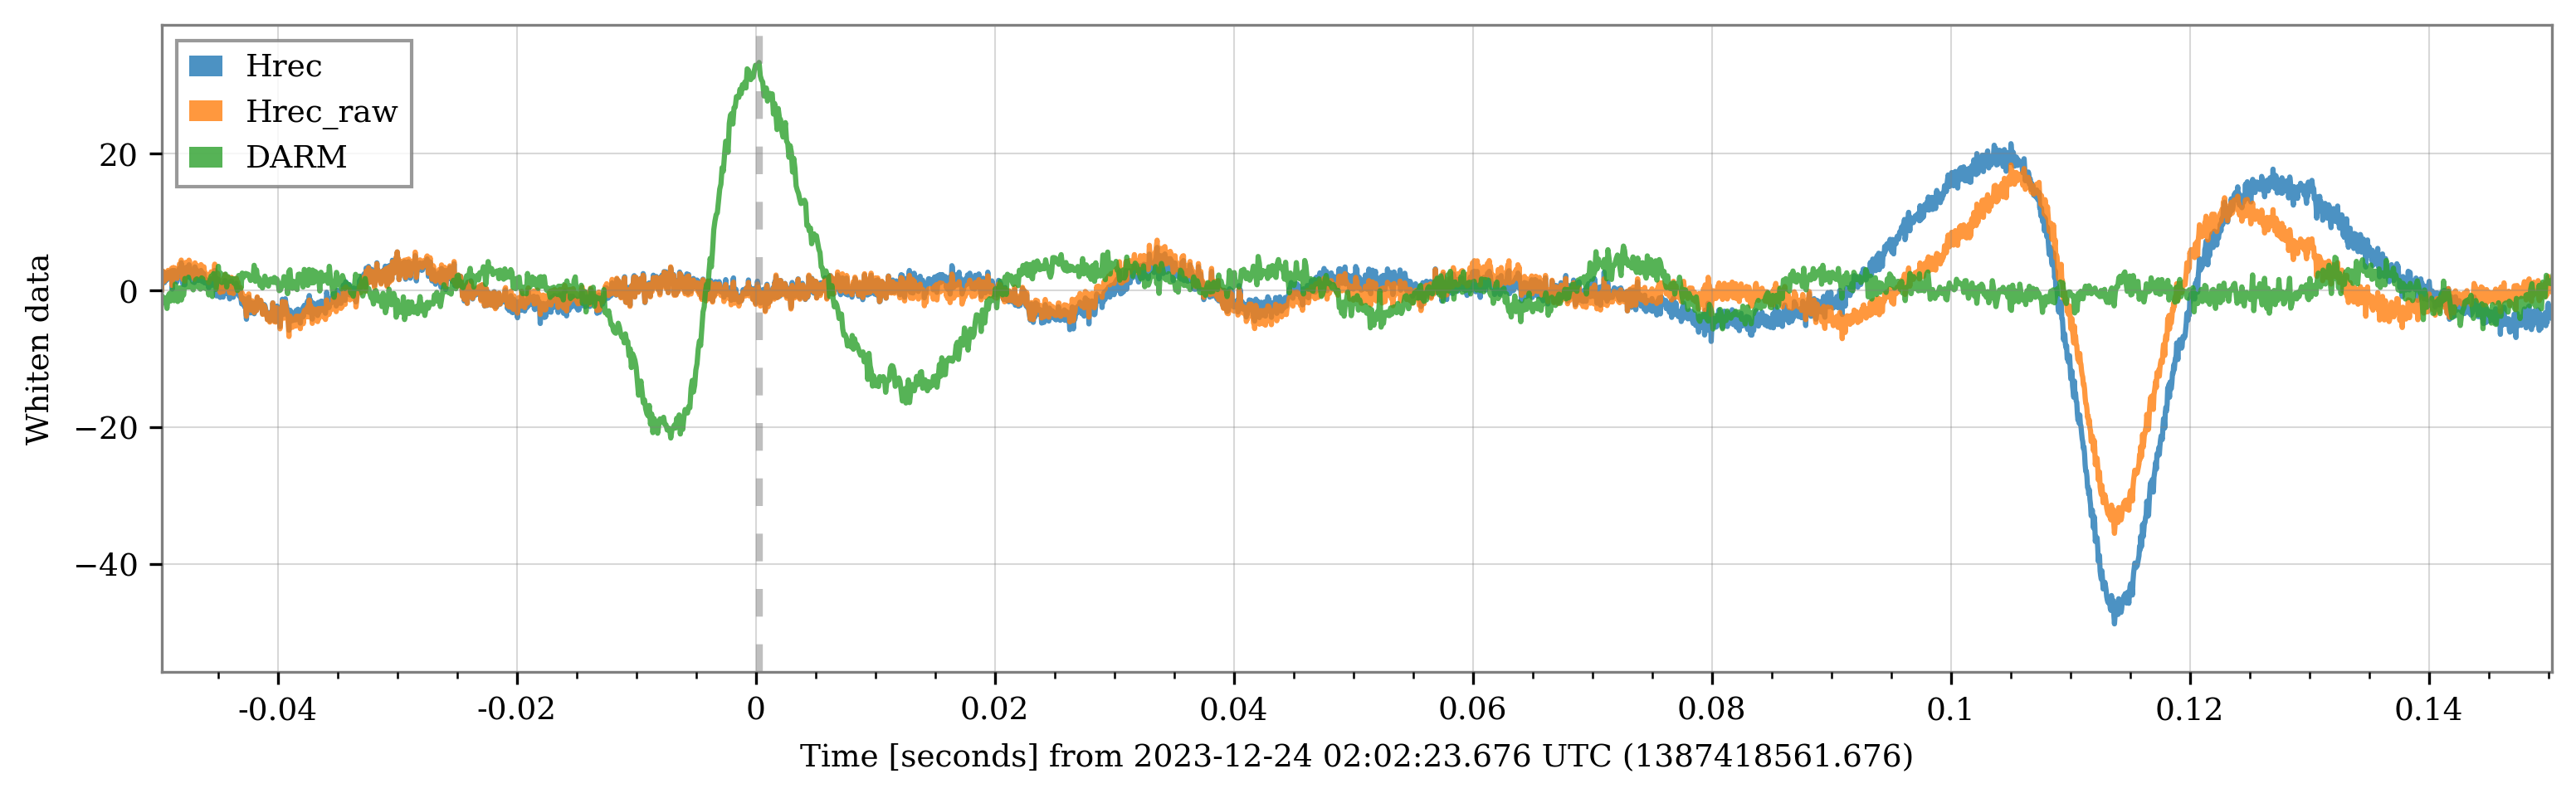
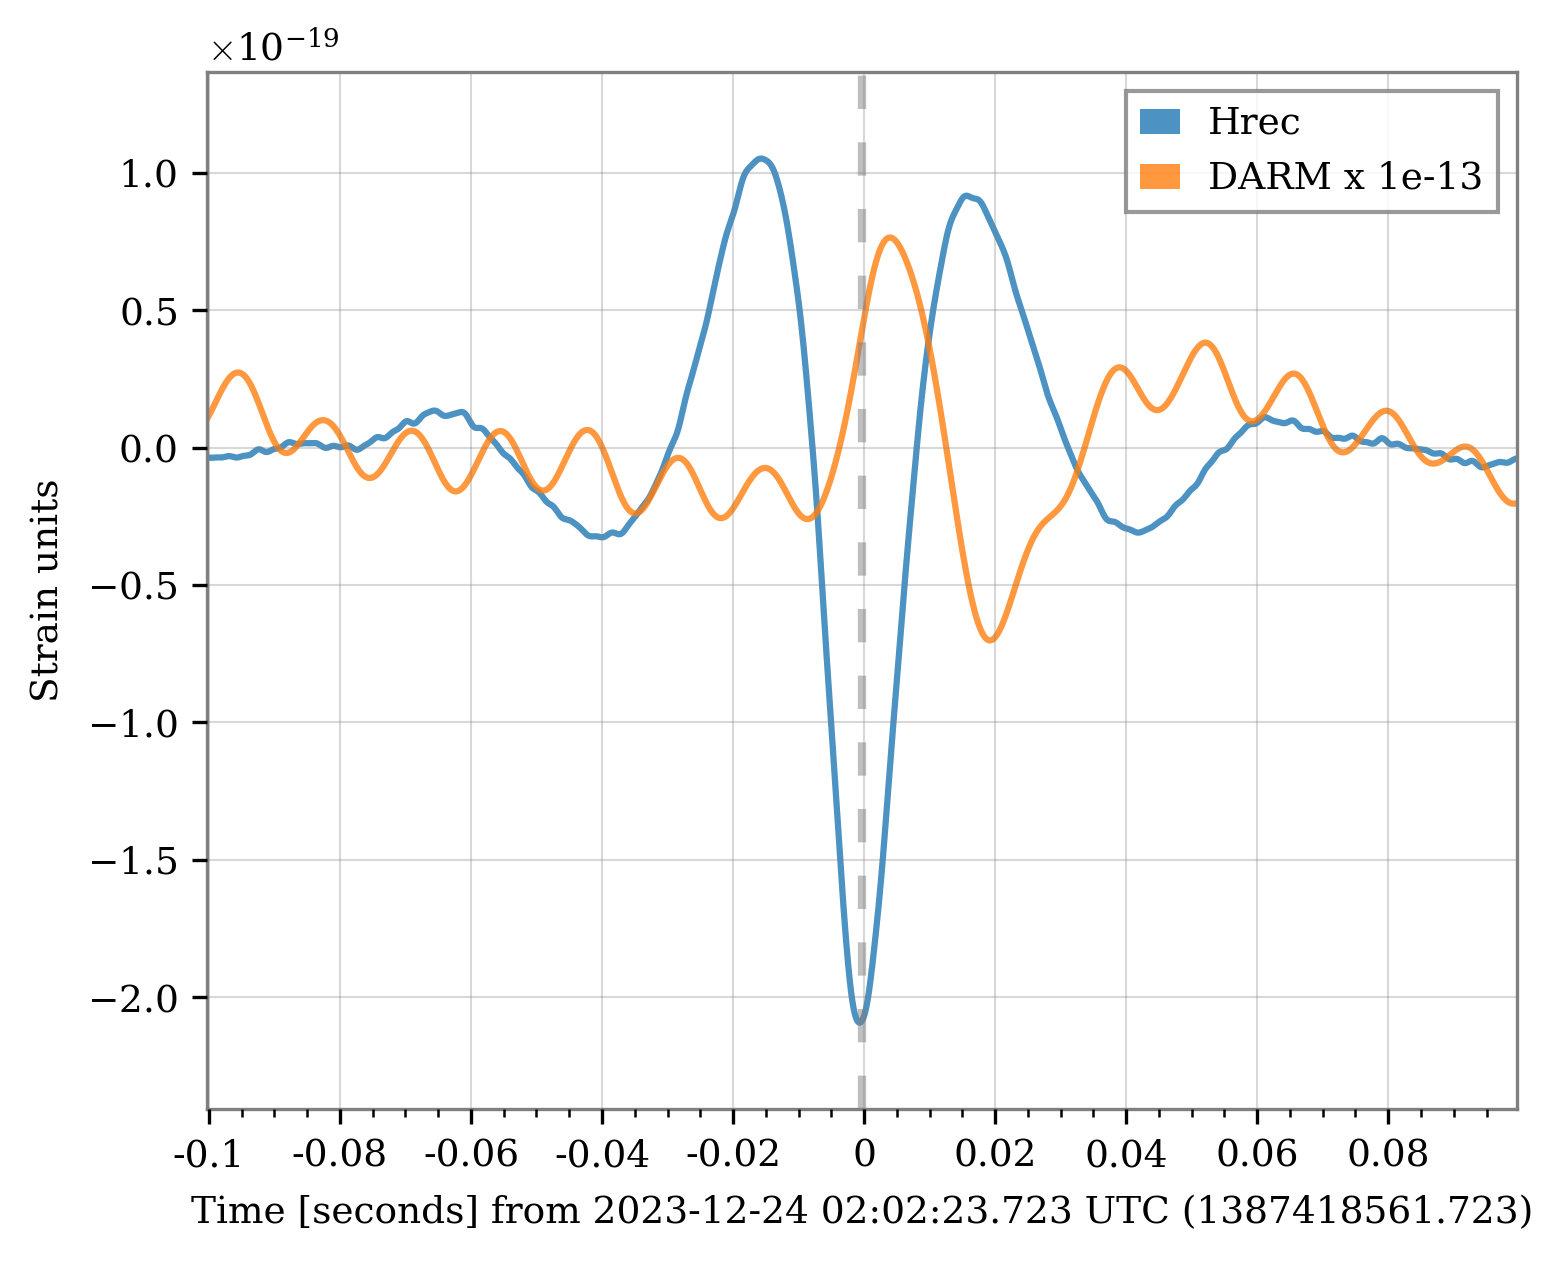
Figure 4: whitening the data, for better visualizing the glitches, we can notice that the glitches in Hrec are delayed 1145 ms from those in DARM. Additionally, the phase seems to be the opposite: upward turnings in Hrec convert to downward ones. These seem to be general properties of all the 25-minute glitches examined. I don't know how expected or informative is this observation. Maybe reconstruction experts can comment further...


