Reports 1-1 of 1 Clear search Modify search
Detector Characterisation (Glitches)
direnzo - 0:17 Monday 15 January 2024 (62965) Print this report
Timing of the annoying 25-minute glitches during the Decmeber 23 mini-Engineering Run

To facilitate the analysis of the annoying 25-minute glitches, I am sharing a CSV file containing the omicron glitch triggers observed during the days of the mini-Engineering Run; from 16:00 UTC on Dec 24 to 7:10 UTC on Jan 1, coinciding with the time of the Japan earthquake. Please note that I had to modify the file extension from .csv to .txt, as the former format was not accepted. Feel free to change it back to .csv after downloading.

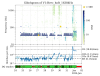
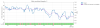
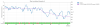
To narrow down the triggers of interest from the total of omicron recordings during this period, I applied the following criteria: a frequency at peak in [30, 80] Hz, and an SNR > 60. This resulted in the selection of a total of 441 glitch triggers. These criteria are supported by the glitchgram reported in Fig. 1 for the examined period. No cuts were made based on the ITF mode flag. Additionally, considering the fast nature of these glitches, I thought to add also some requirement on the duration and/or the Q of these glitches but this had no impact in practice. Following a preliminary analysis with a histogram depicting the time difference between consecutive glitch triggers, I further made a refinement by excluding glitches occurring closer than 15 minutes to their neighbors. This reduced the number of glitches from 441 to 431. While it is not guaranteed that the result includes all and only the glitches belonging to the 25-minute family, it should serve as a representative sample.

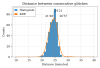
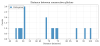
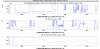
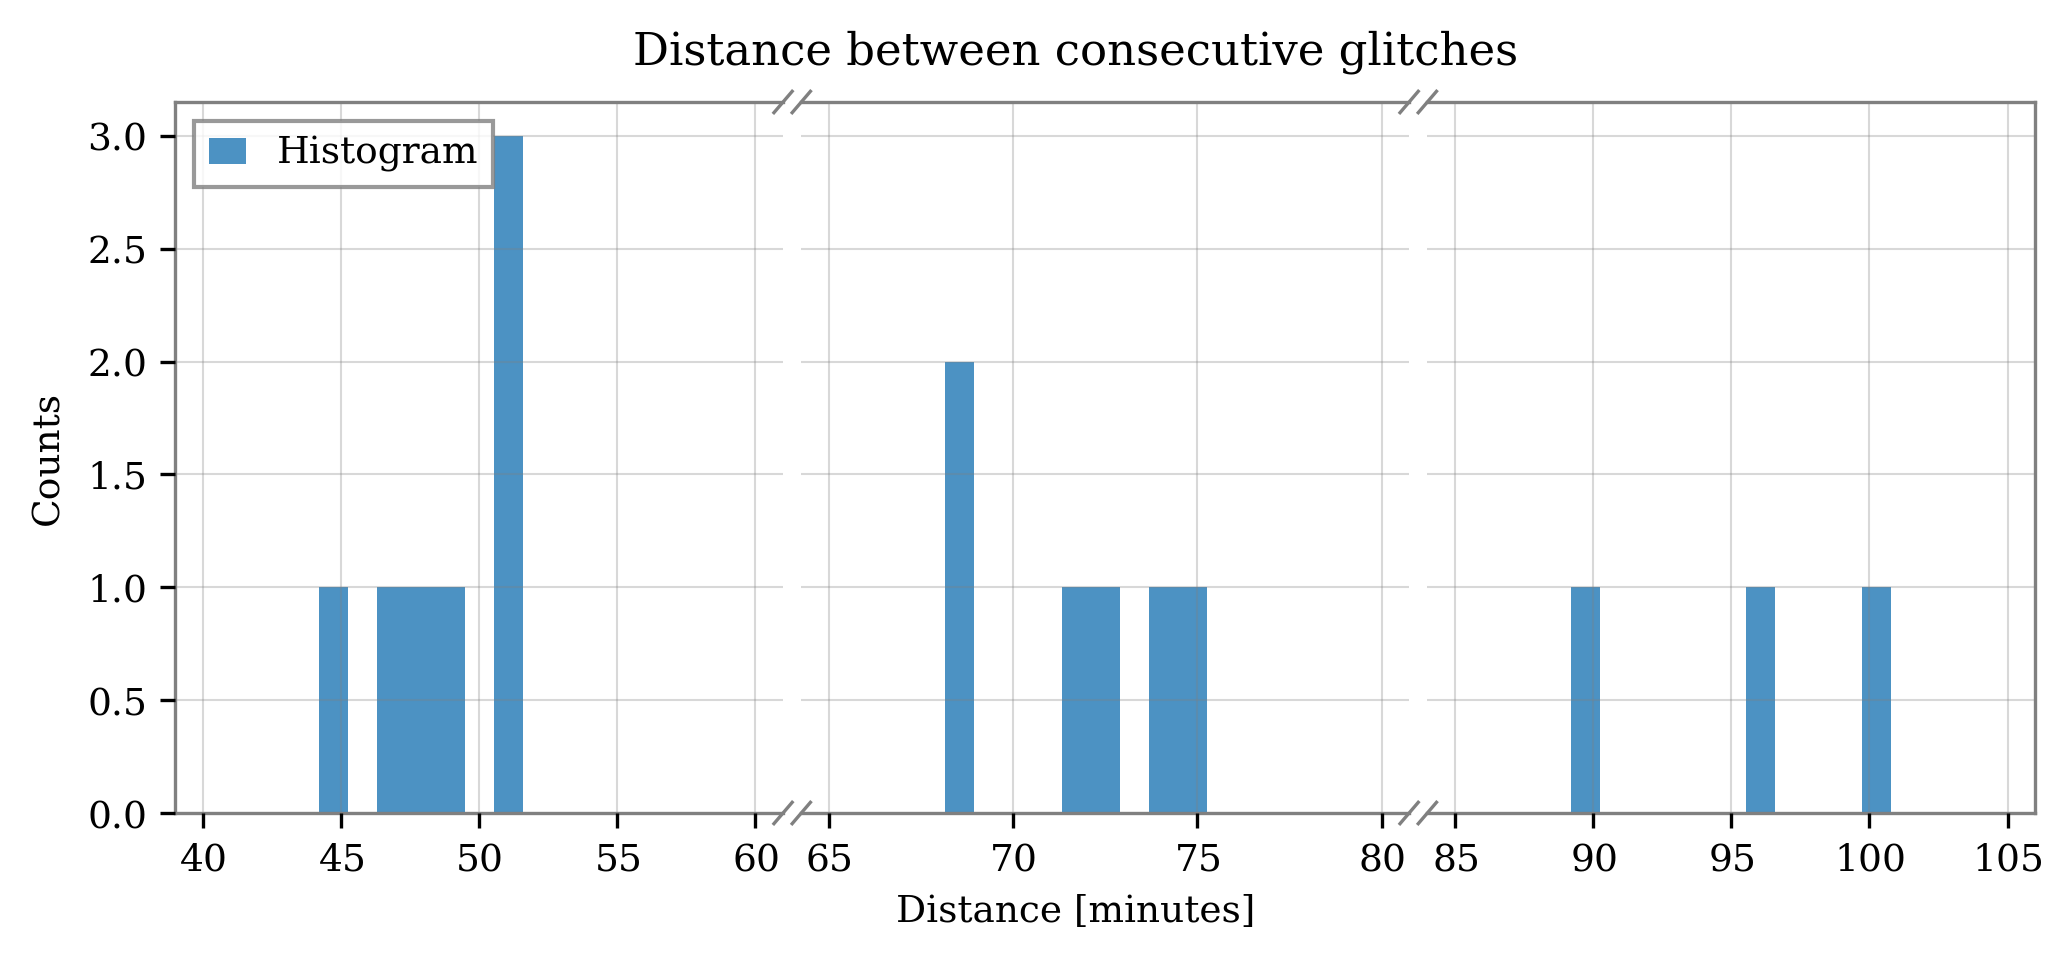
Figure 2  displays a histogram of the difference in GPS time between two consecutive glitches, with dashed lines indicating the median (24 minutes and 21 seconds, with characteristic fluctuations of 2.5-3 minutes) and the 5th and 95th percentile values. The orange curve represents the distribution function estimated using the kernel density method. Notably,  Fig. 3 reveals three small clusters at approximately 48, 72, and 96 minutes, supporting the hypothesis that the glitches are "GPS-locked" rather than "lock-locked." Following an unlock, the time for the next glitch aligns with multiples of 25 minutes after the GPS time of the last glitch before the unlock.

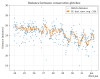
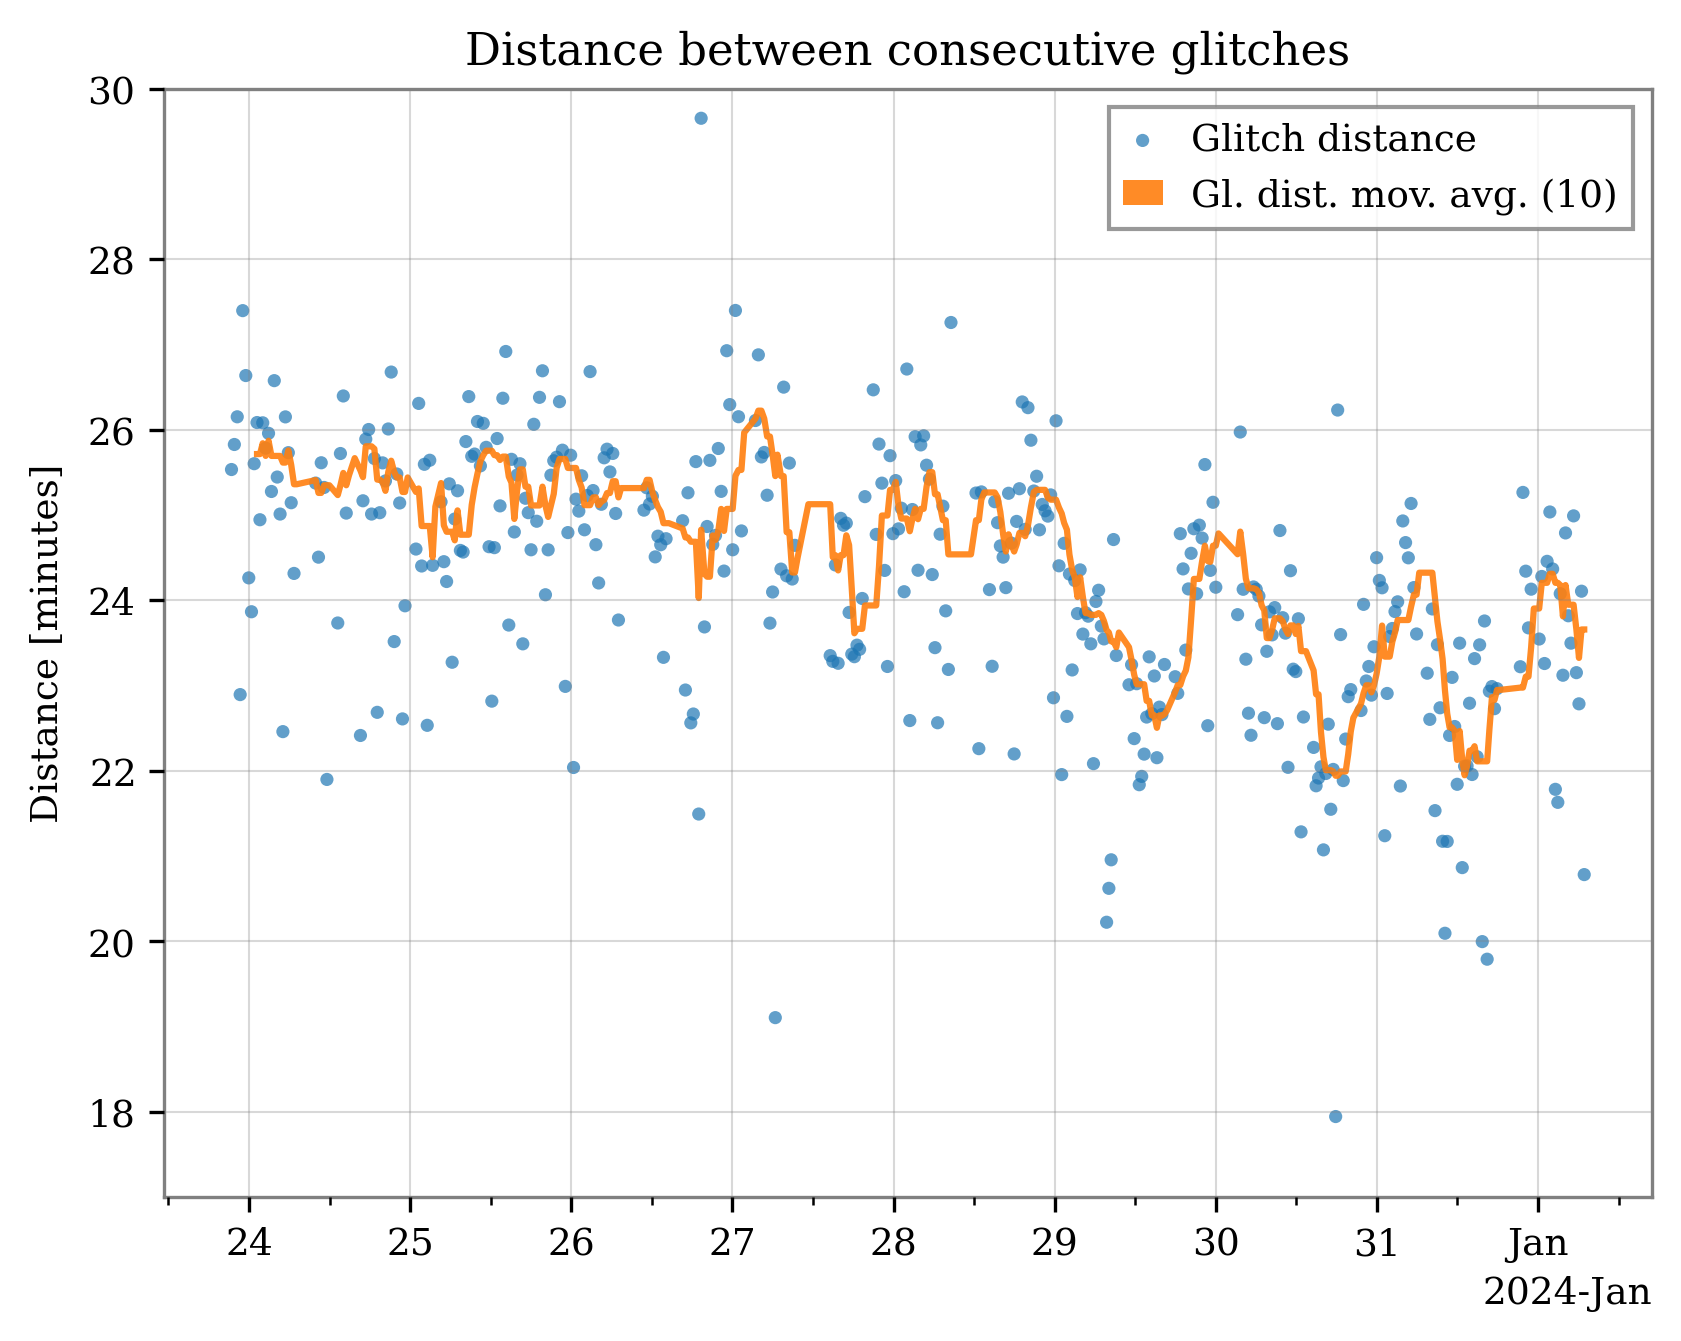
Figure 4  resents a scatterplot illustrating the time evolution of the distance between two consecutive glitches, with the orange curve indicating the moving median computed over 10 glitches (approximately 4 hours).

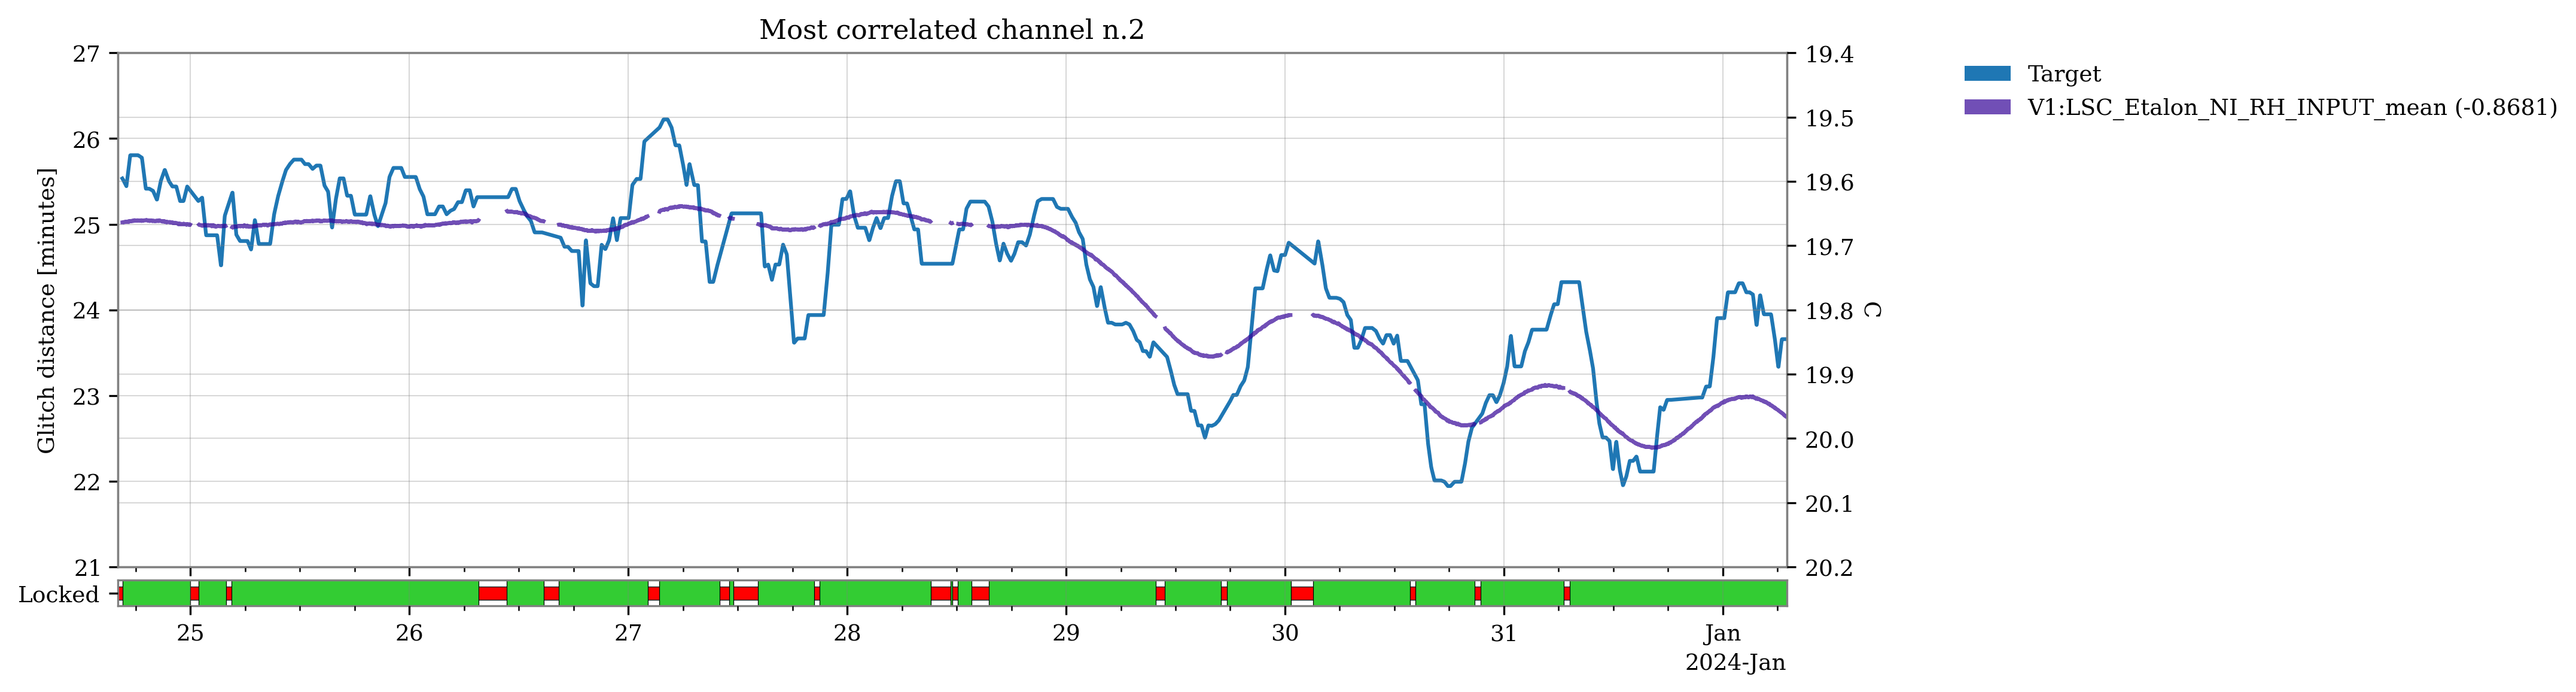
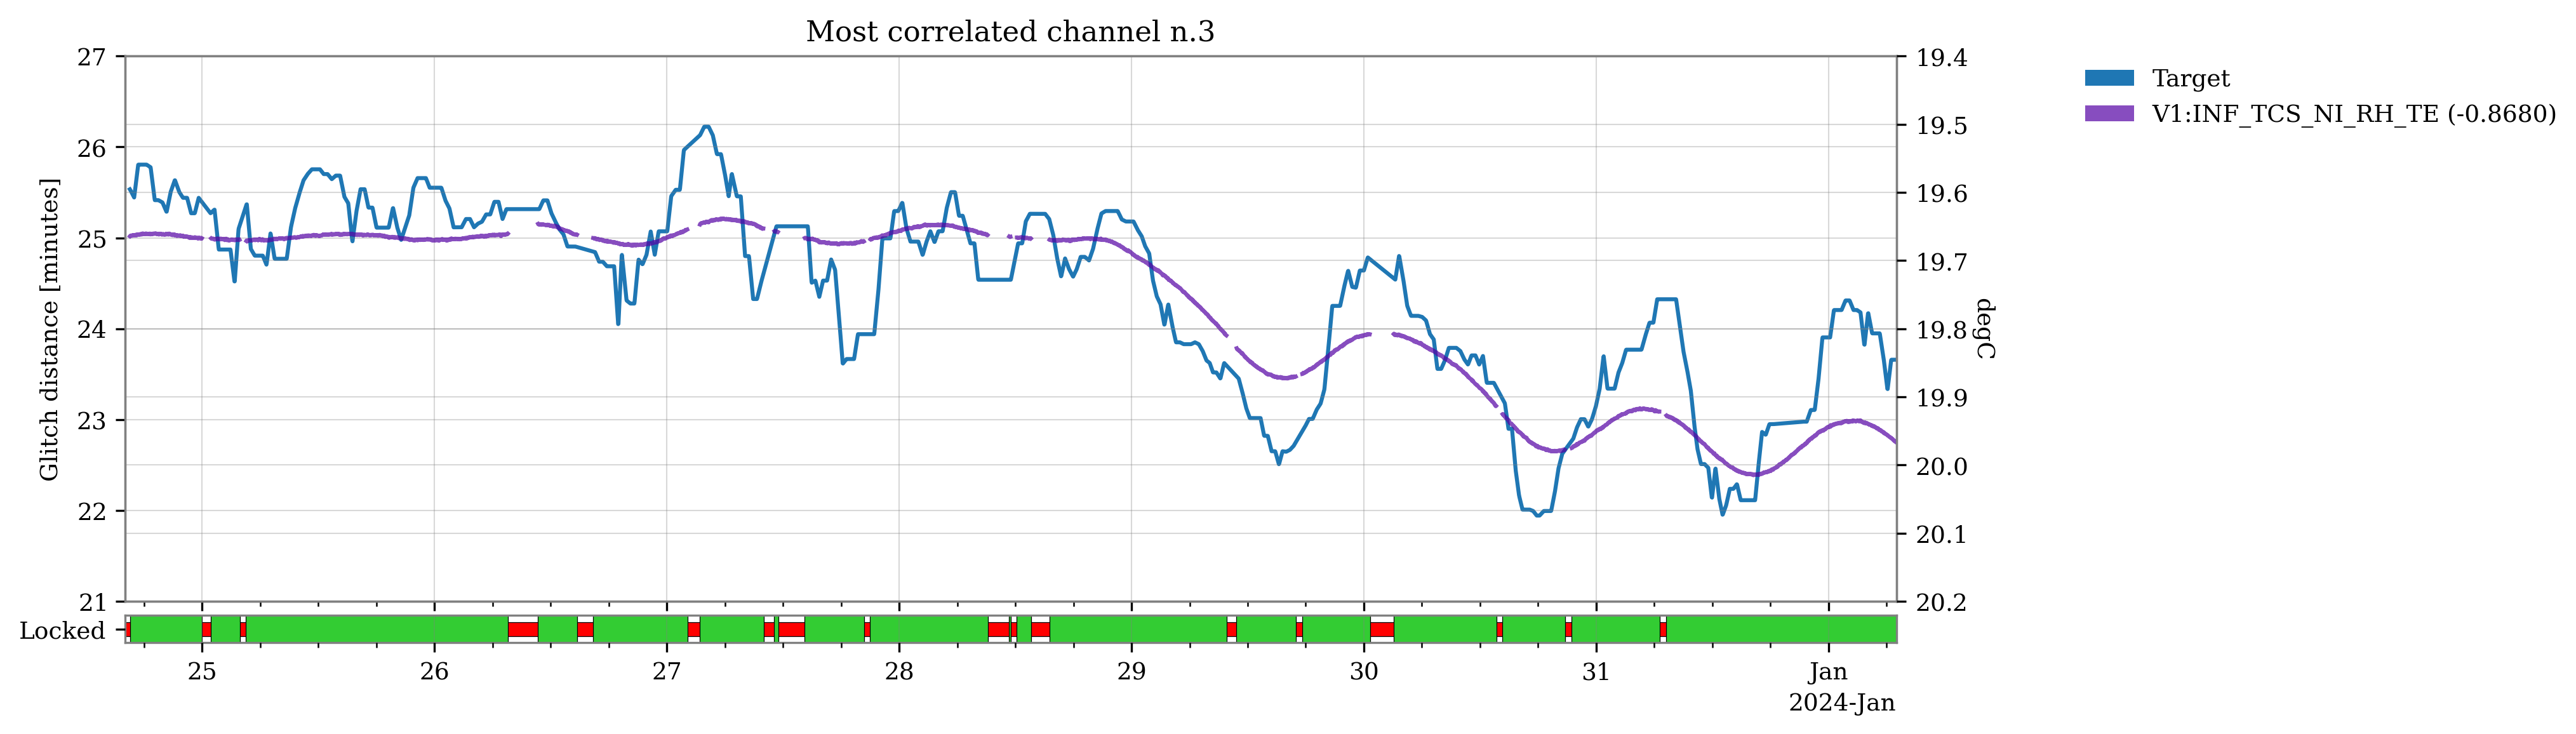
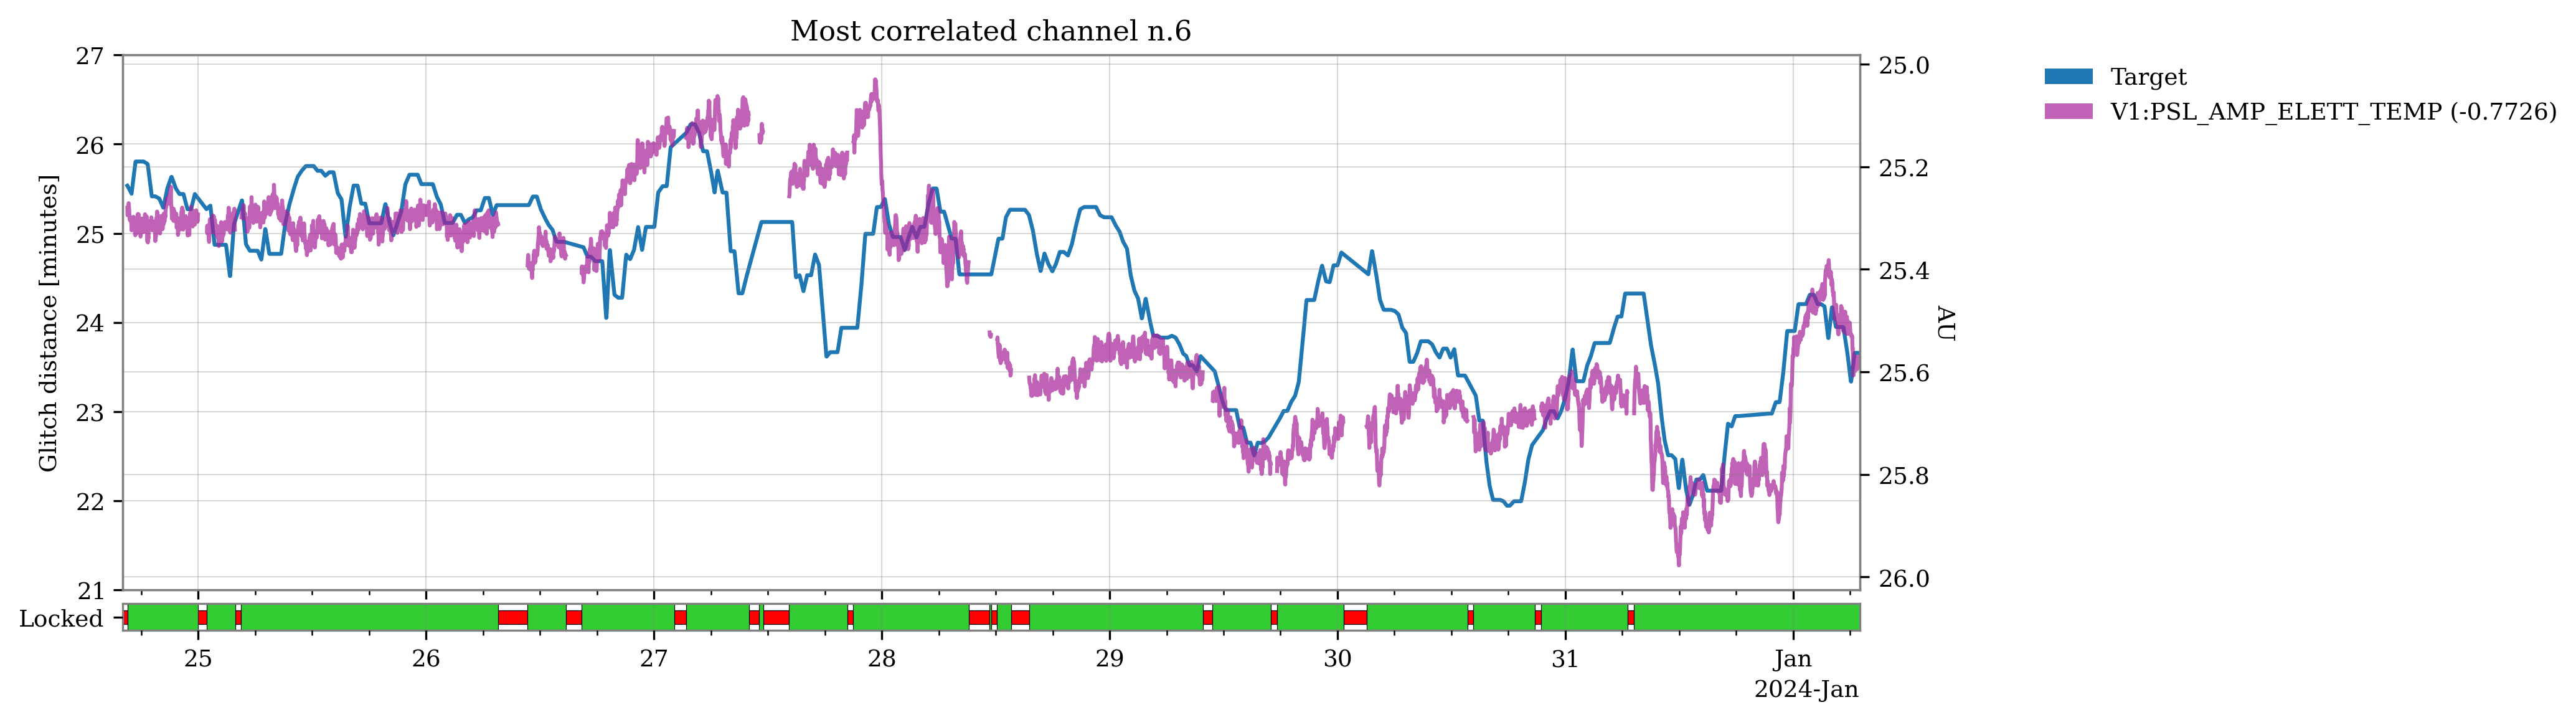
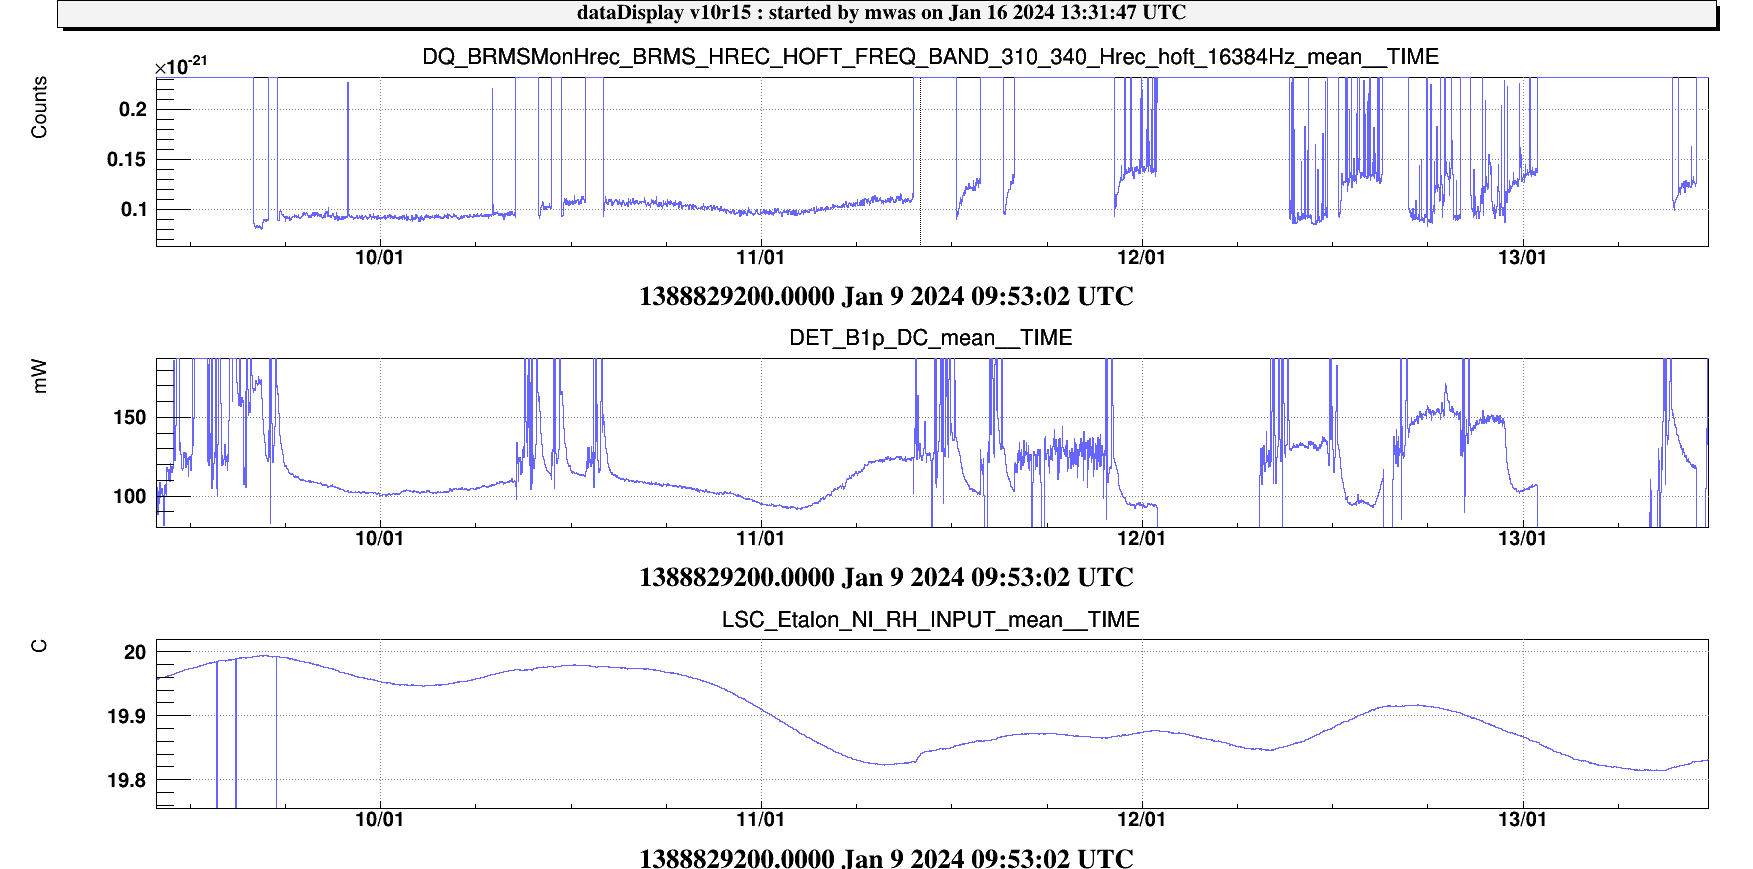
In the next steps, I will explore correlated channels with the time series of the glitches and their time differences.

Images attached to this report
Non-image files attached to this report
Comments to this report:
direnzo - 19:25 Tuesday 16 January 2024 (62992) Print this report

As anticipated earlier today at the Commissioning meeting, I report a preliminary analysis of the channels correlated with the glitches. Specifically, I considered the time series representing the evolution of glitch distances (the orange curve in Figure 4 of the main entry) and I correlated it with all the thermometers and channels related to the Etalon control system present in the trend frame: "V1:*_TE*","V1:*_Etalon_*", for a total of 1310 channels. The attached text file includes all the (300) channels that possess a Pearson correlation coefficient exceeding 0.2 with the glitch distance series, arranged in order of significance.

As is customary in correlation analyses, this result alone tells nothing about the probable origin of these glitches. It is just "a filter" for those channels that exhibit some similarity with the target in their time evolution, whether they are related or not. As commented by Michal at the Commissioning meeting, some intentional temperature variations at the NI related to the Etalon scan may suggest an actual relation with the mechanism producing the glitches. For example, the curve of the glitch distances exhibits a downward trend, especially from December 29, similar to the average temperatures in a large part of Italy. These have arguably no direct effect on the glitches, although the process/device generating them appears to be sensitive at least to some temperatures. 

I add the plots of some possibly interesting correlations of the target (blue, left axis) and the above channels (right axis).

Figure 1: animated gif with the 12 most correlated channels reported in the attached text file.

Figure 2 - 3: correlation with the North Input Ring Heater.

Figure 4: Etalon set point temperature.

Figure 6 - 12: interesting but probably unrelated correlation with the temperature at the PSL amplifier. I leave the floor to the experts to comment.

Further analyses will follow, including additional channels and, possibly, involving directly the glitches time series, not their time differences.

Images attached to this comment
Non-image files attached to this comment
mwas - 19:35 Tuesday 16 January 2024 (62993) Print this report

Figure 1. There was another intentional change in NI Etalon temperature during the night from Jan 10 to Jan 11. So this could be another time to check if the rate of 25-minute glitches changes, there are long stretches of locks before the change, but then for several days the lock are relatively short and glitchy due to INJ glitches, so the analysis can be more difficult. On Jan 15 there should again be more stable data, that can be used to check the efffect of the NI Etalon set point change on the 25-minute glitches.

Images attached to this comment
Search Help
×

Warning

Error

The present report has been modified outside this window. Please check for its integrity in the main page.

Refreshing this page will move this report into drafts.

×