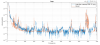
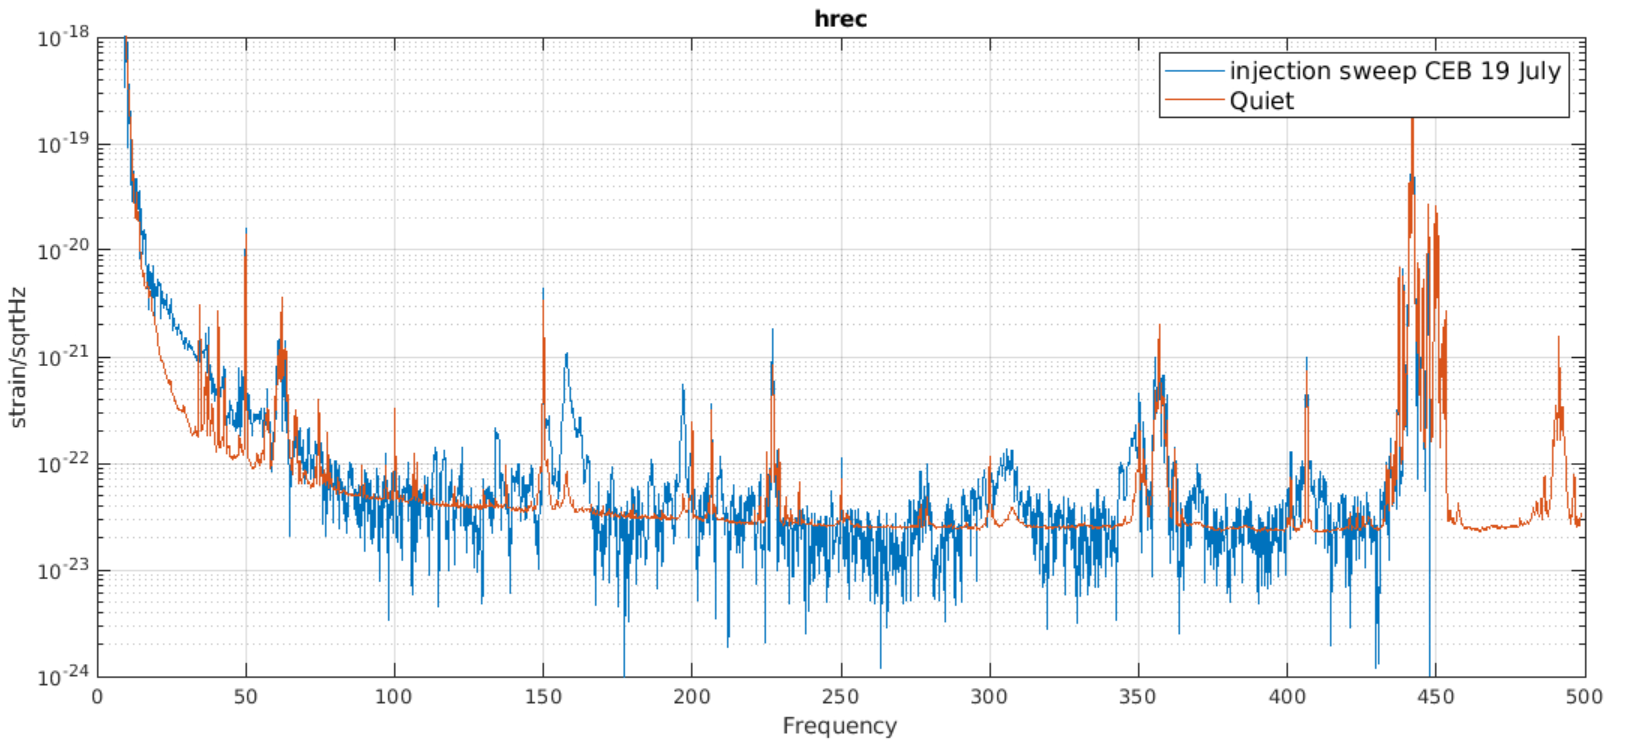
Indeed the sweep was from 8Hz to 500Hz, but we start seeing something in hrec only from 15 Hz.
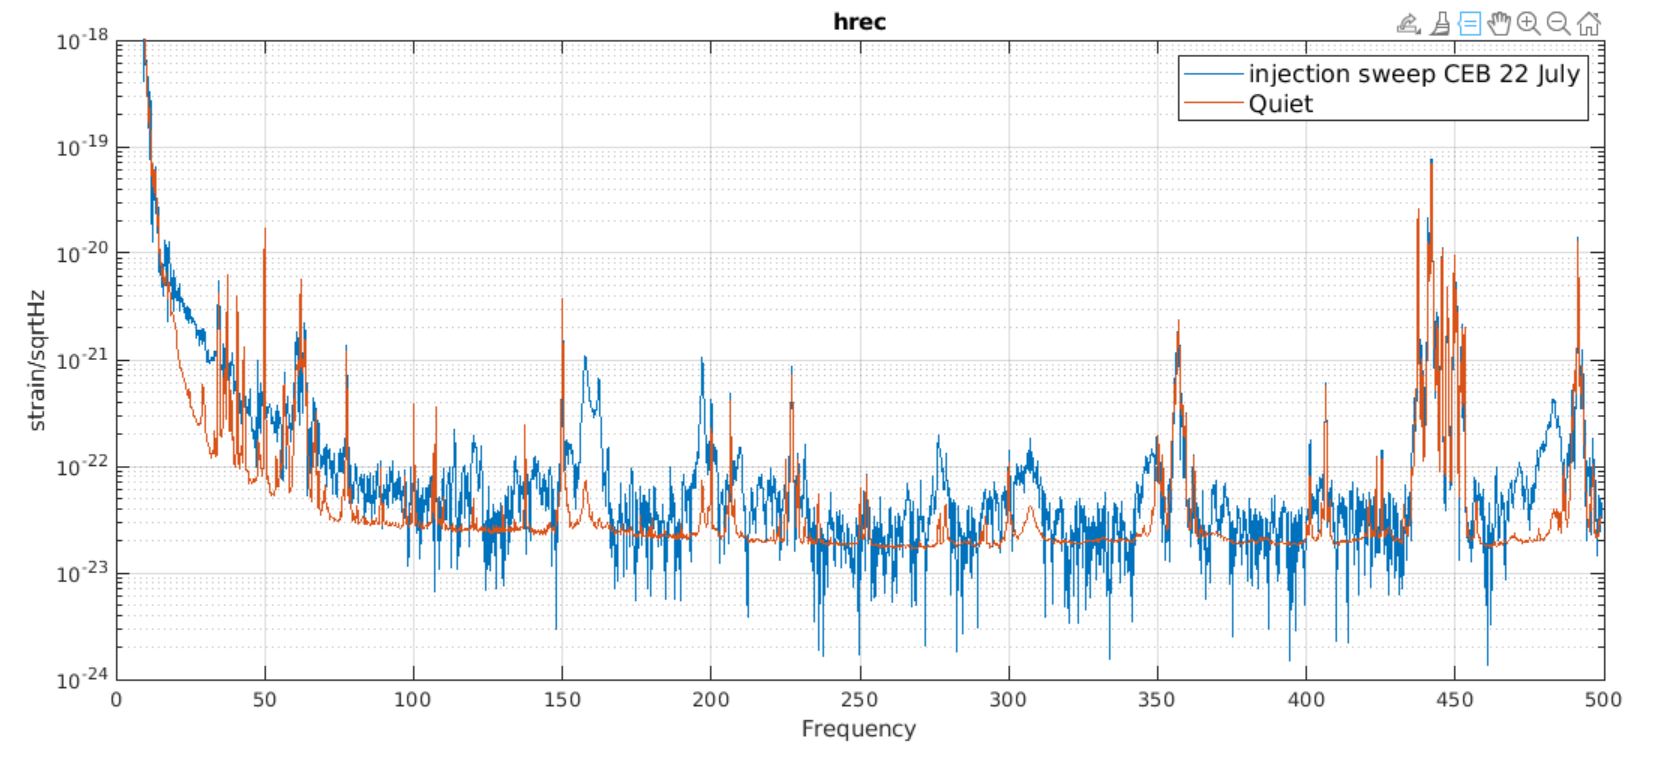
The first plot shows the excited structures in Hrec during the this last injection (July 22).
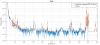
The second figure shows the same for the previous injection (July 19) which was interrupted at about 400Hz because of the ITF unlocked.
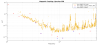
The third Figure shows the computed magnetic Coupling Function normalized to the modulus of the CEB metronix magnetometers. Overlapped are some points (blue stars) and upper limits (red stars) measured with the lines injection.
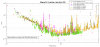
The fourth Figure compares the CF curve measured at different times: April 3rd (lines), the with sweeps: April 17, April 27, July 19, July 22. On April 27 the coupling around 40Hz was a bit larger. But apart from this, the coupling measured with sweeps at 4 different times looks consistent. As already noticed, the coupling measured with the lines is a factor 2-3 smaller.
These hrec structures were excited during the CEB injection:
- 47.8 Hz
- 48.6 Hz
- 157 Hz
- 162 Hz
- 197 Hz
- 276 Hz
- 306 Hz
- 483 Hz