Reports 1-1 of 1 Clear search Modify search
Environmental Monitoring (Environmental Monitoring)
fiori, miritescu, tringali - 16:30 Tuesday 04 April 2023 (59629) Print this report
MAgnetic injections CEB

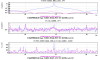
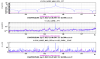
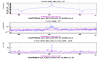
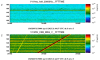
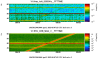
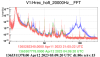
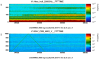
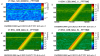
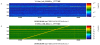
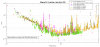
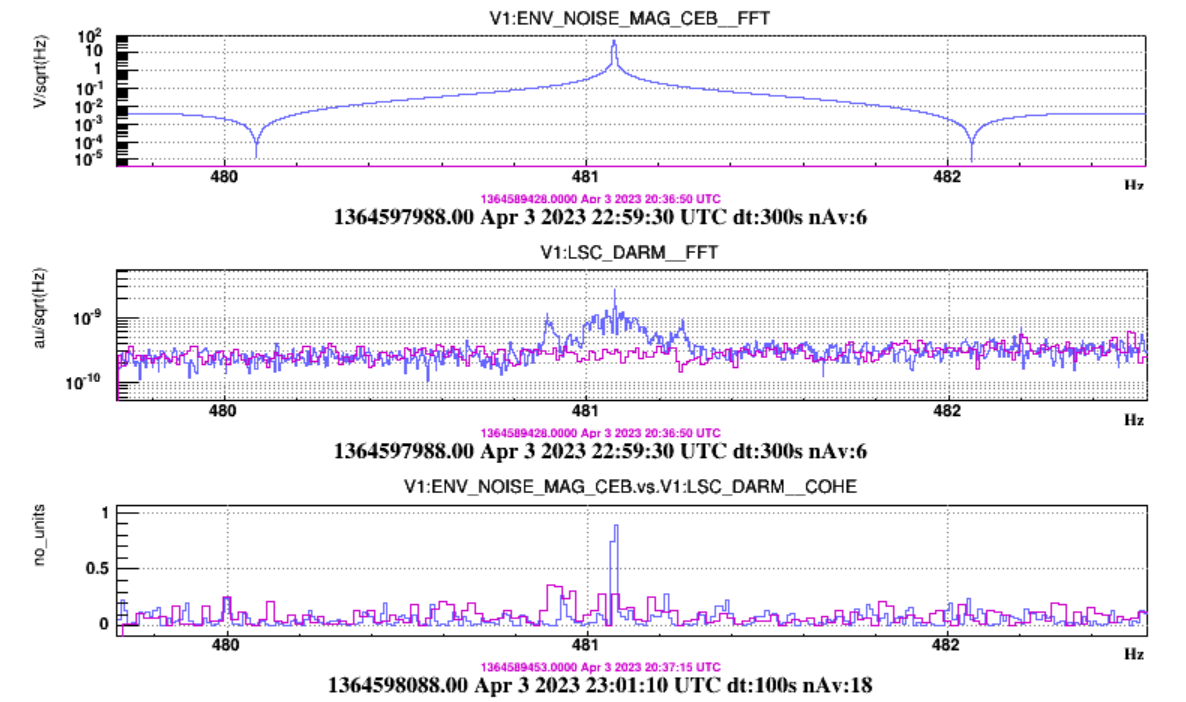
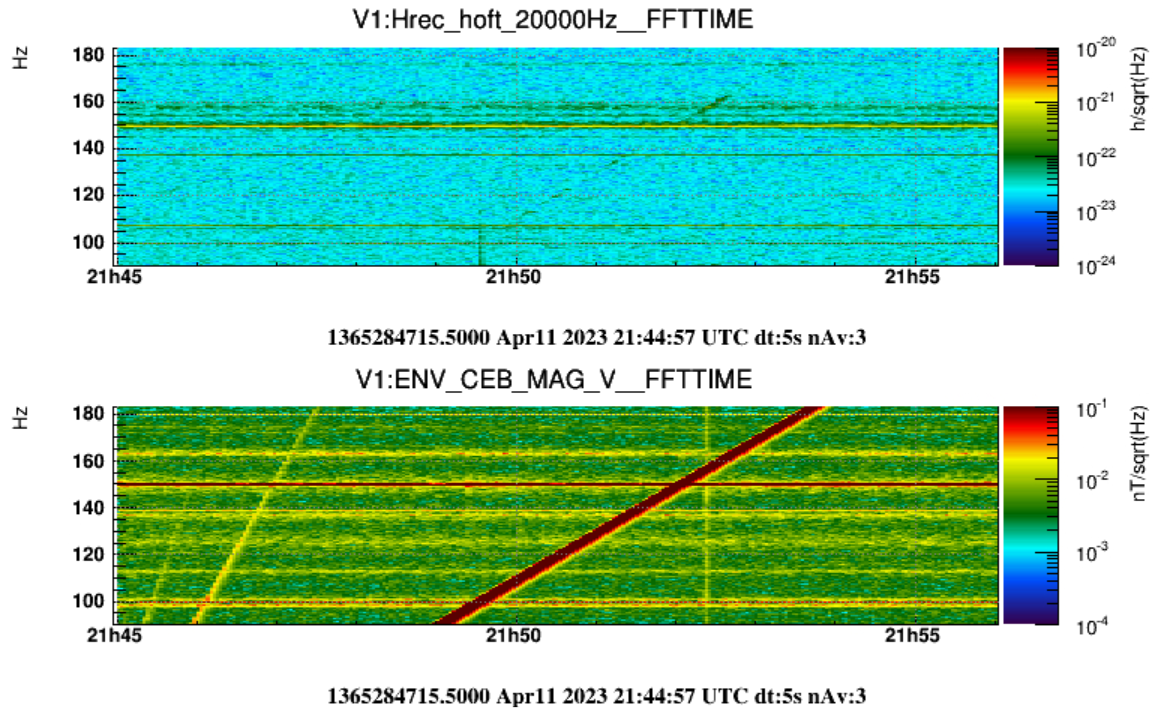
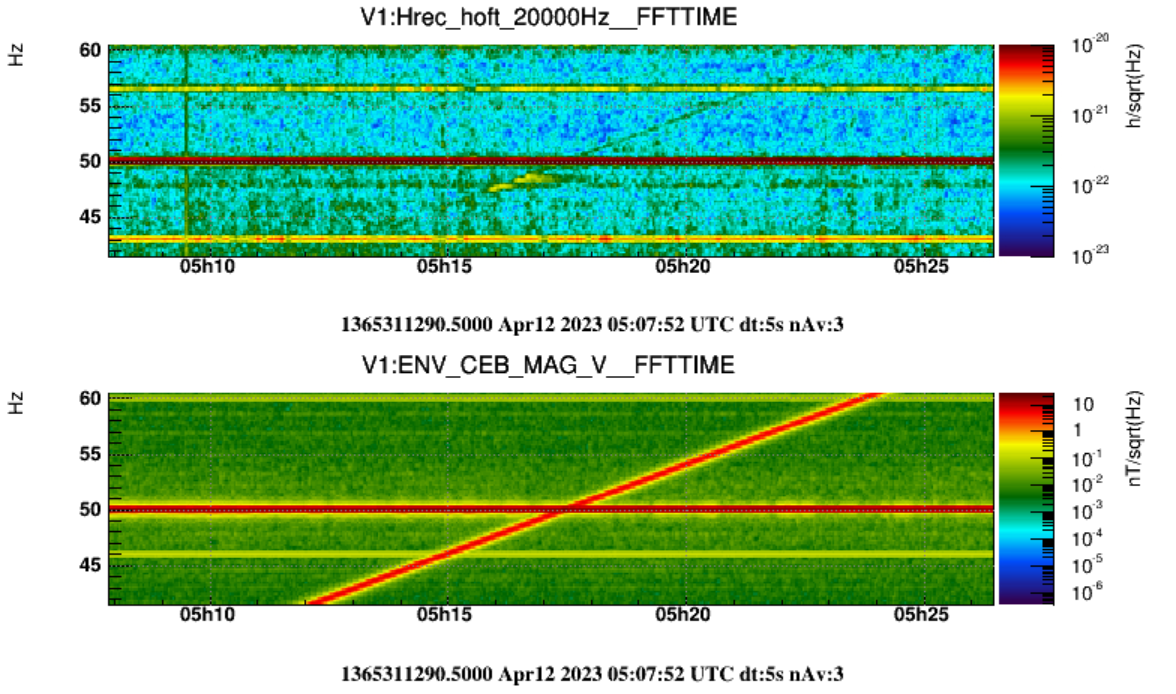
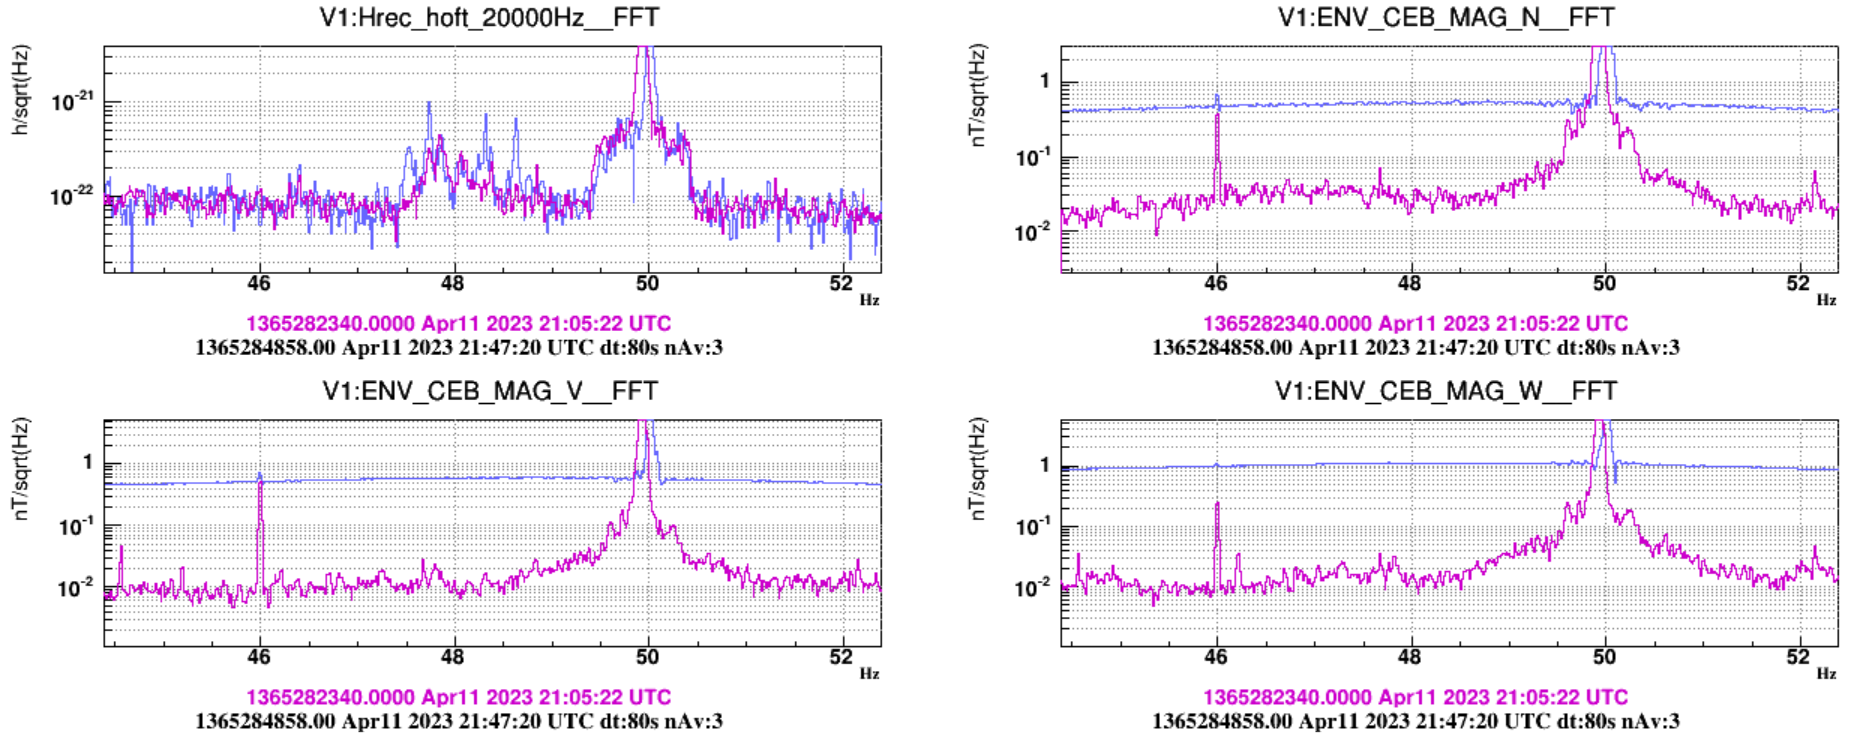
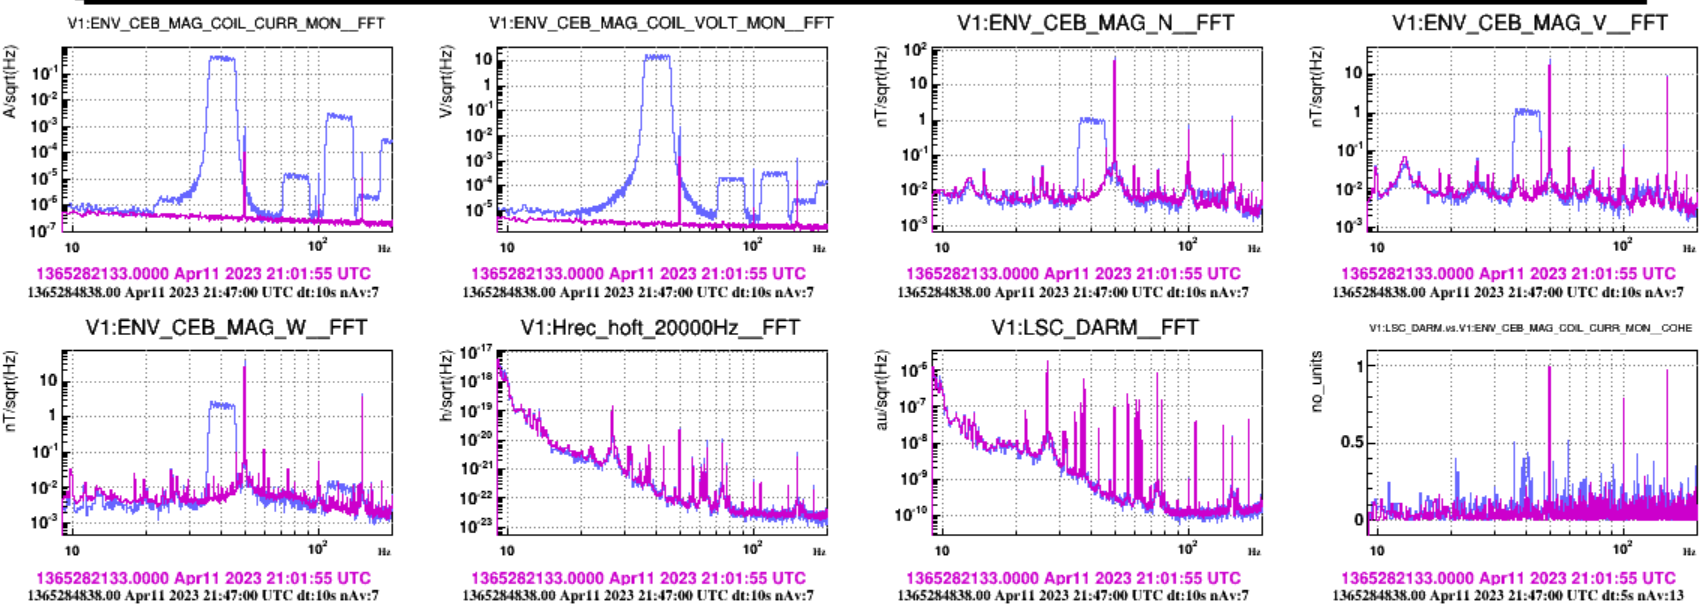
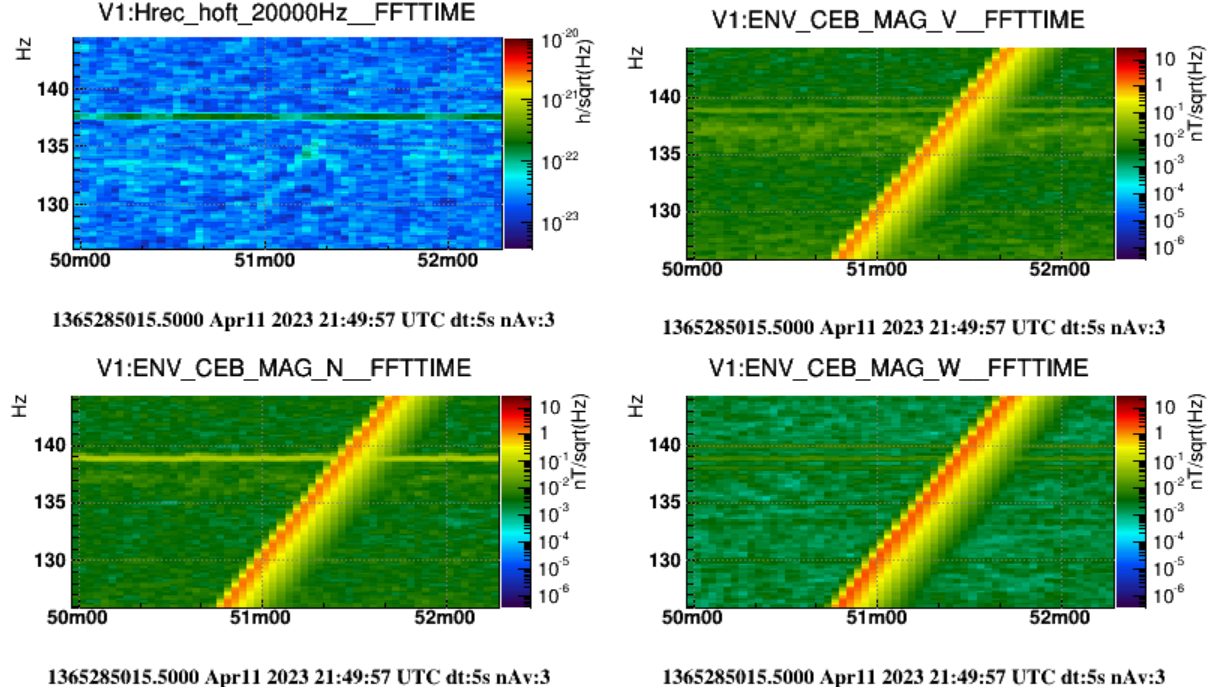
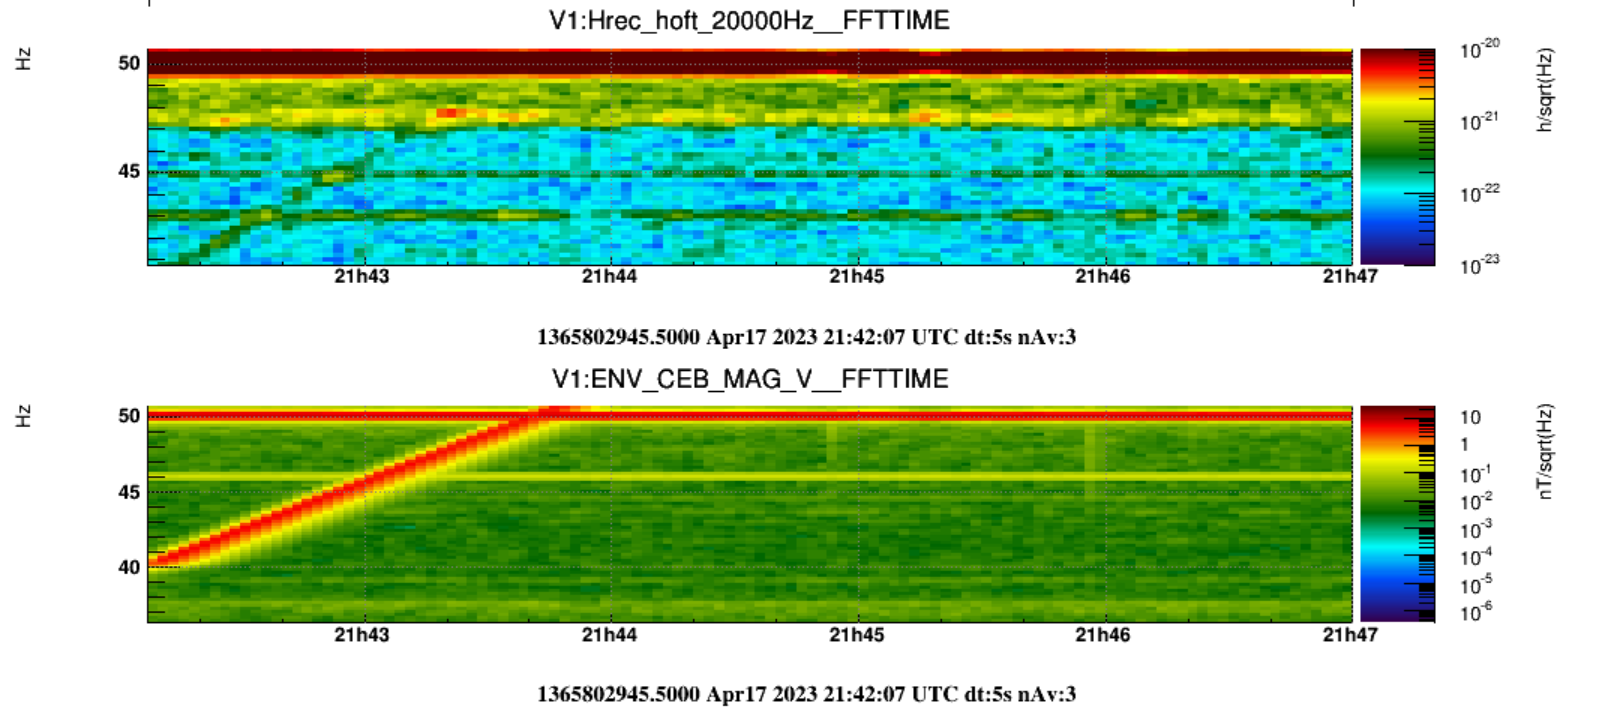
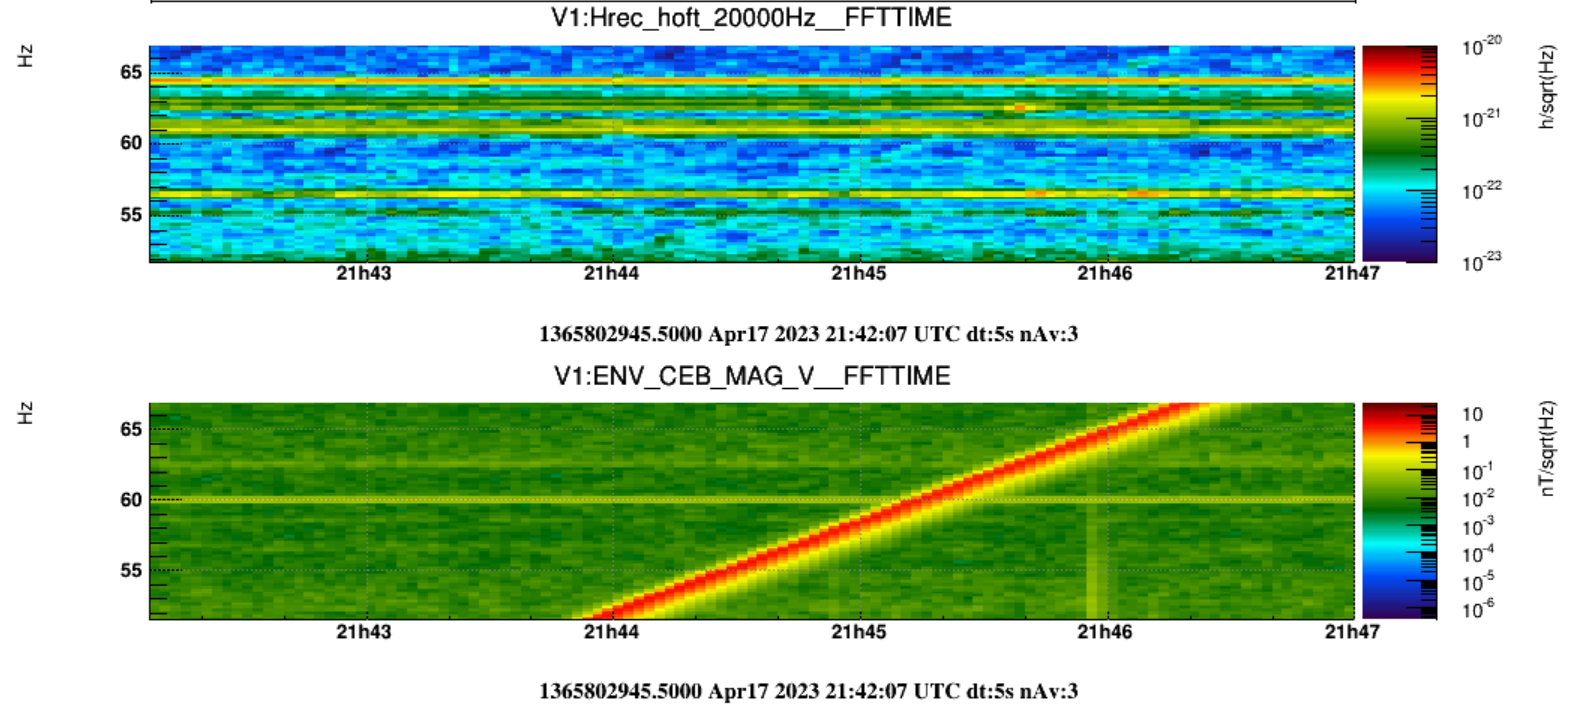
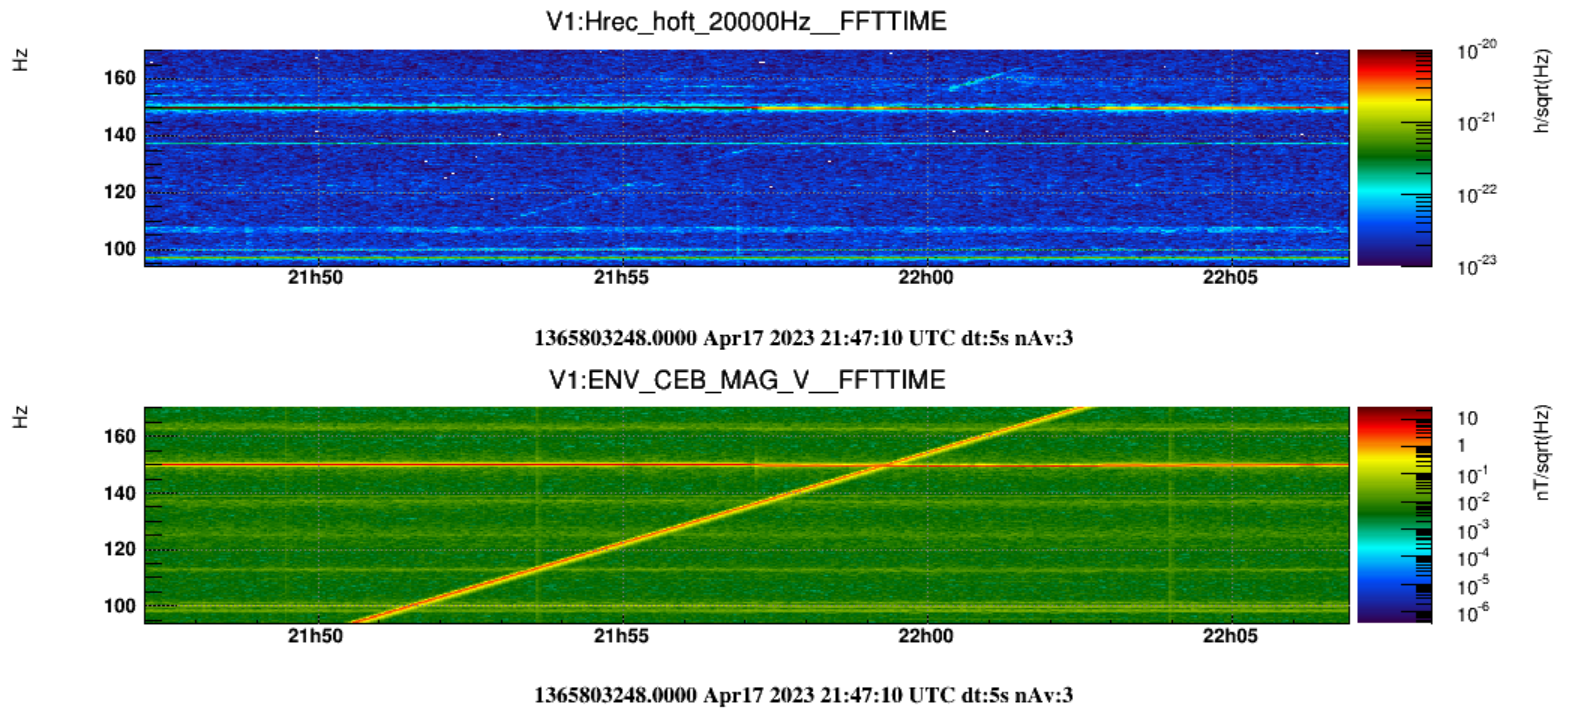
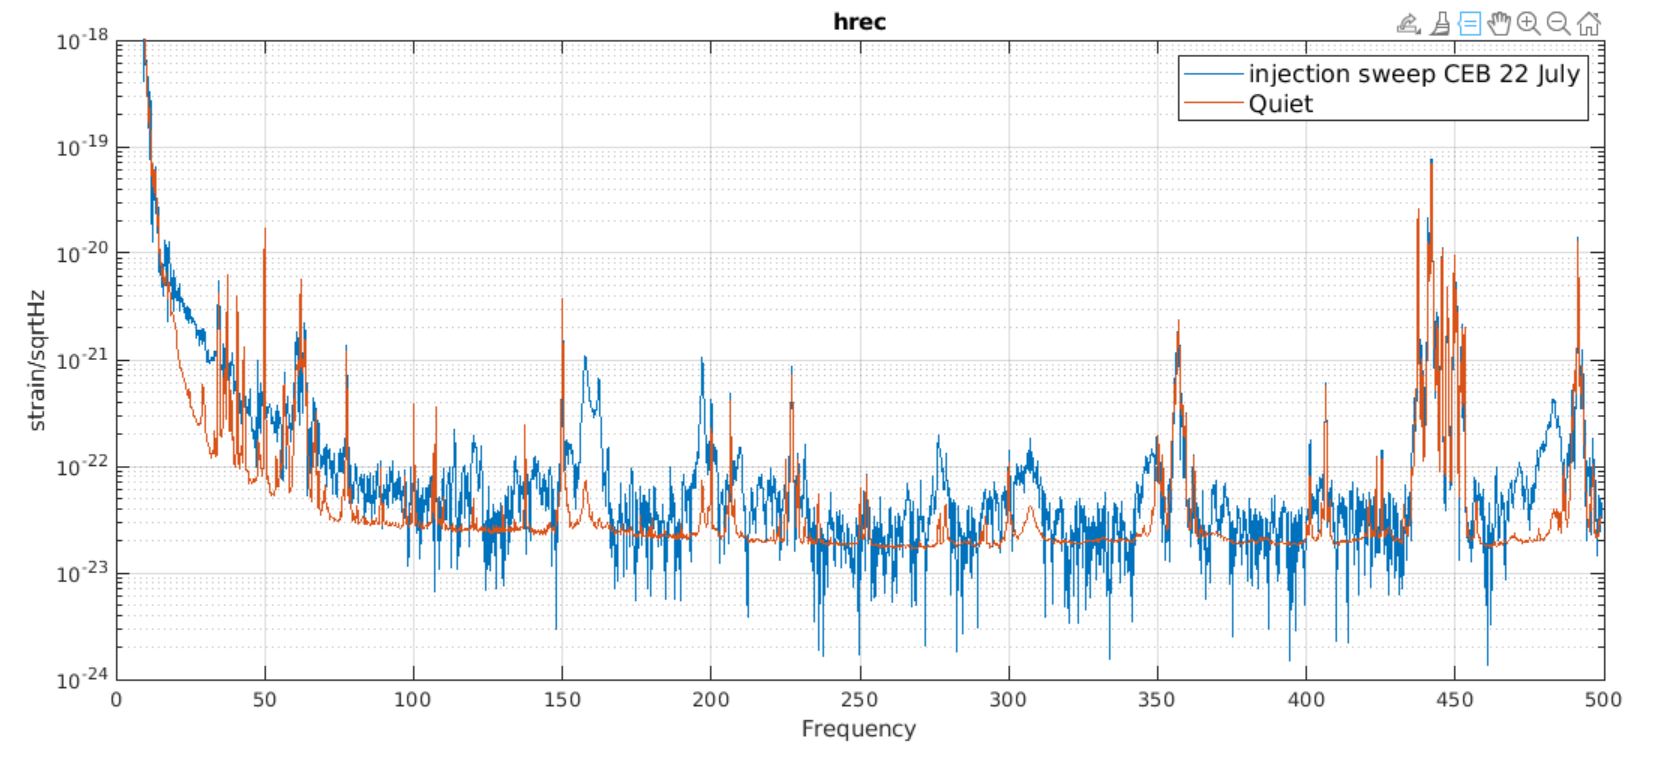
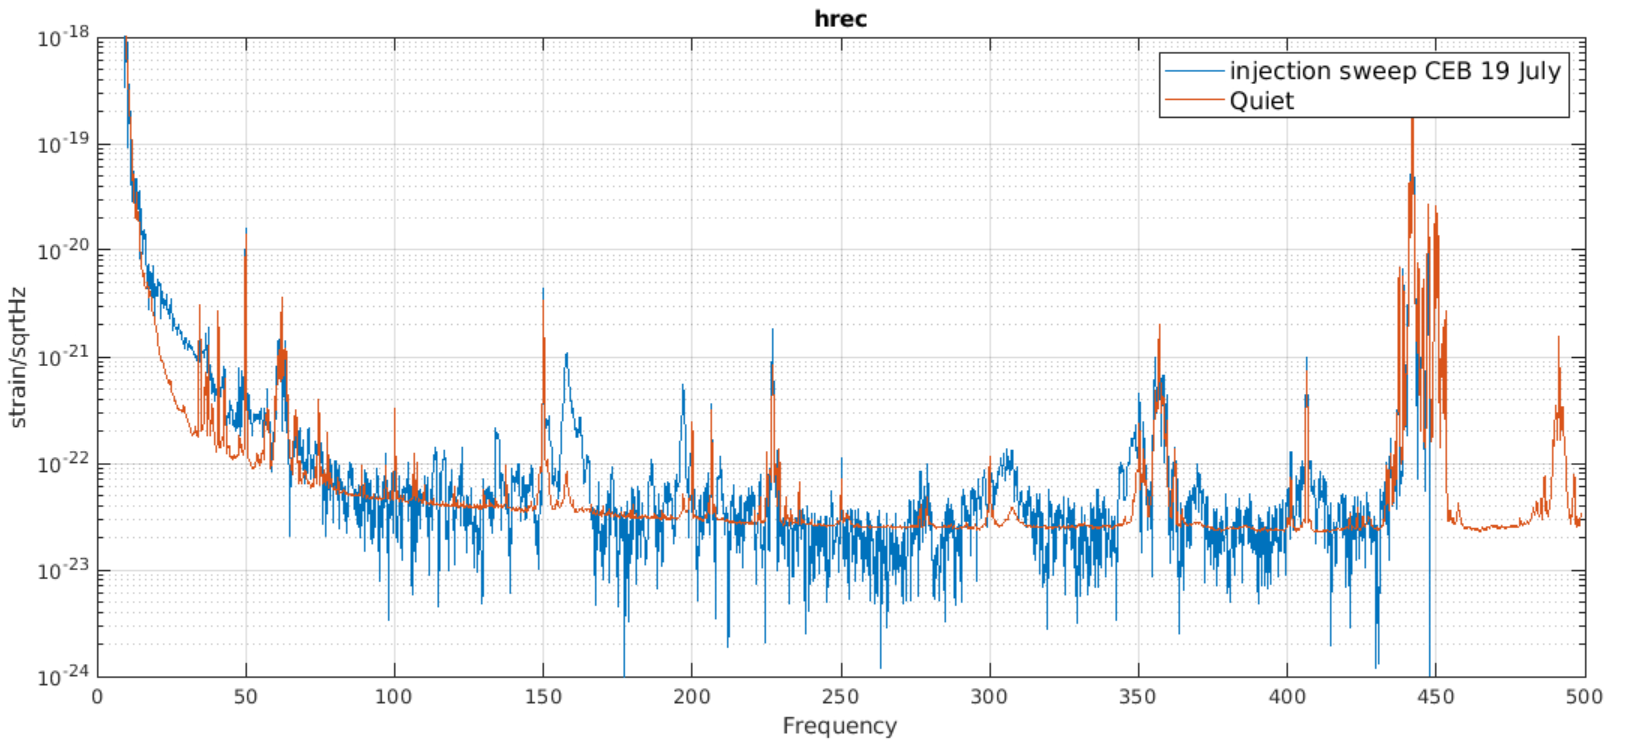
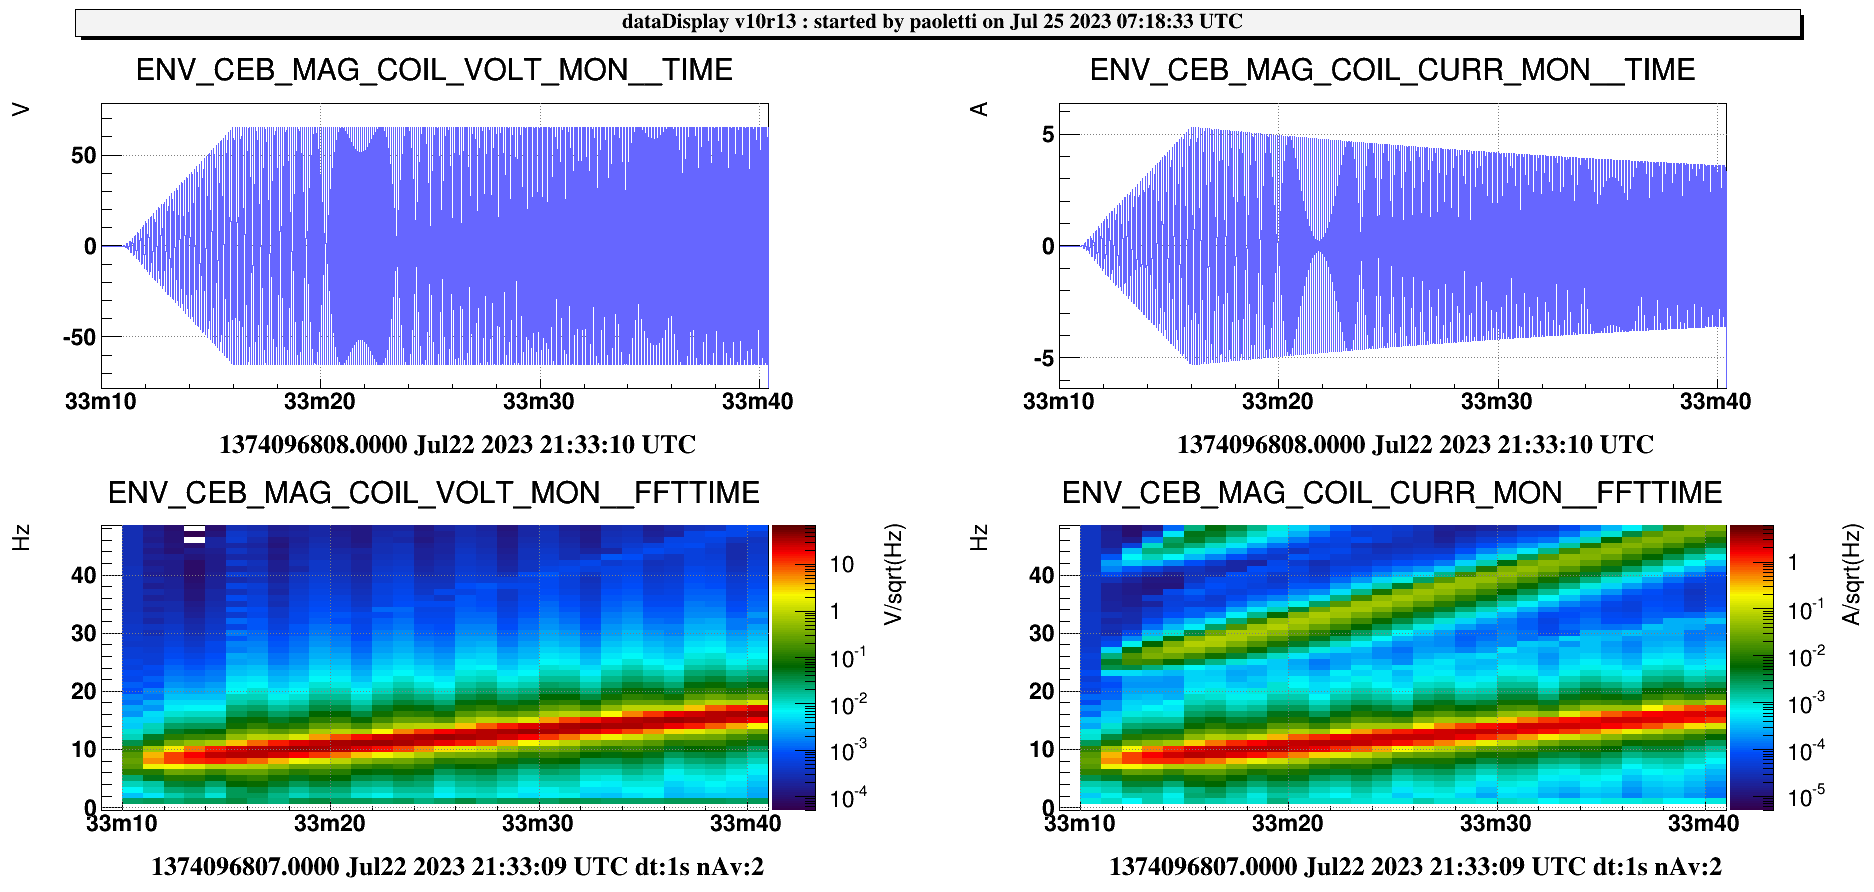
Yesterday night between roughly April 3 20:25 UTC and April 4 3:05 UTC we performed a first injection of lines using the CEB large coil.

It was a set of 20 logaritmically spaced lines between 10Hz and 1kHz, lines 10-100Hz were injected for 300s, lines 100-1kHz were injected for 900s, all at about the maximum current in the coil. The same set was repeated twice.

The log files with the detailed information are attached and can be found in

/virgoData/NoiseInjections/MagneticInjectionsO4/output/ *

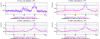
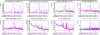
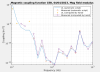
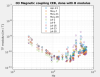
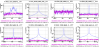
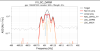
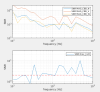
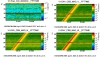
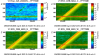
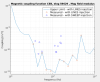
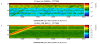
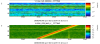
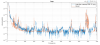
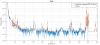
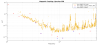
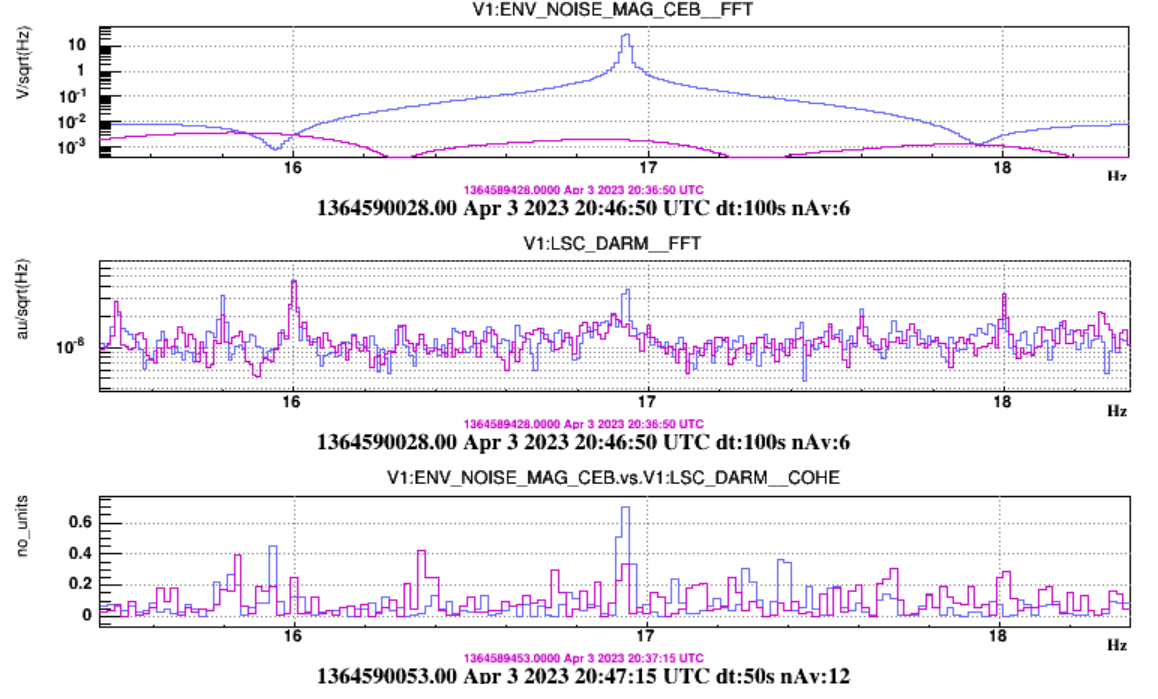
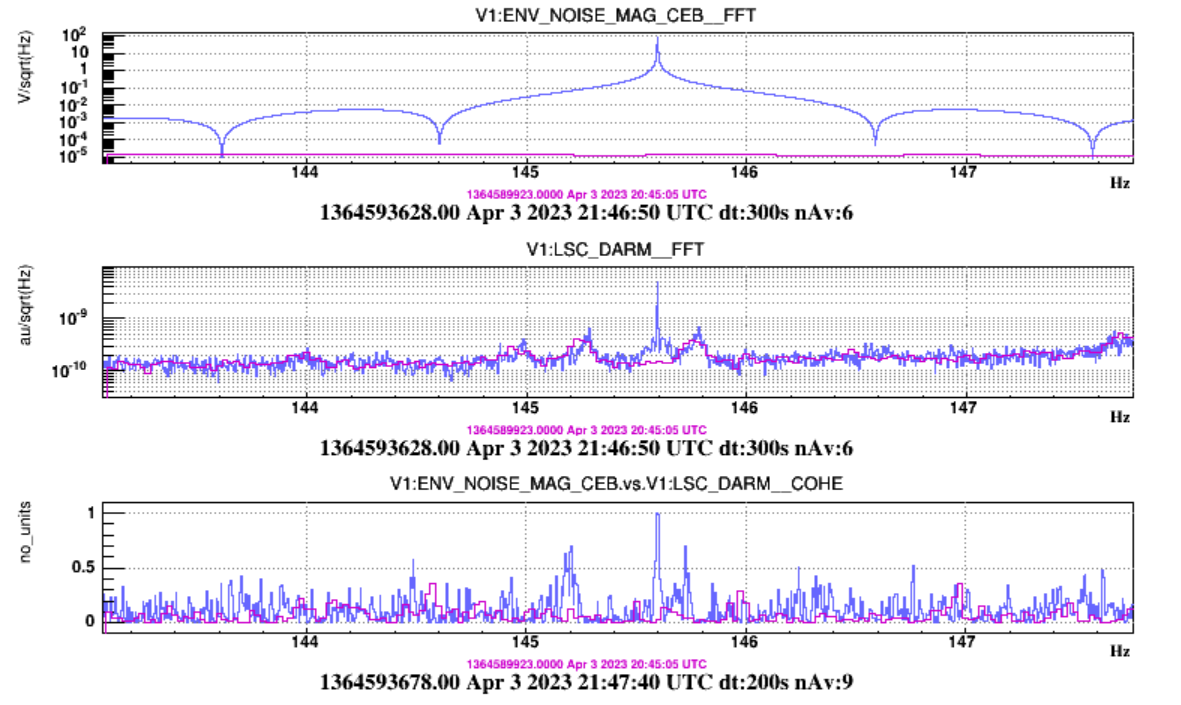
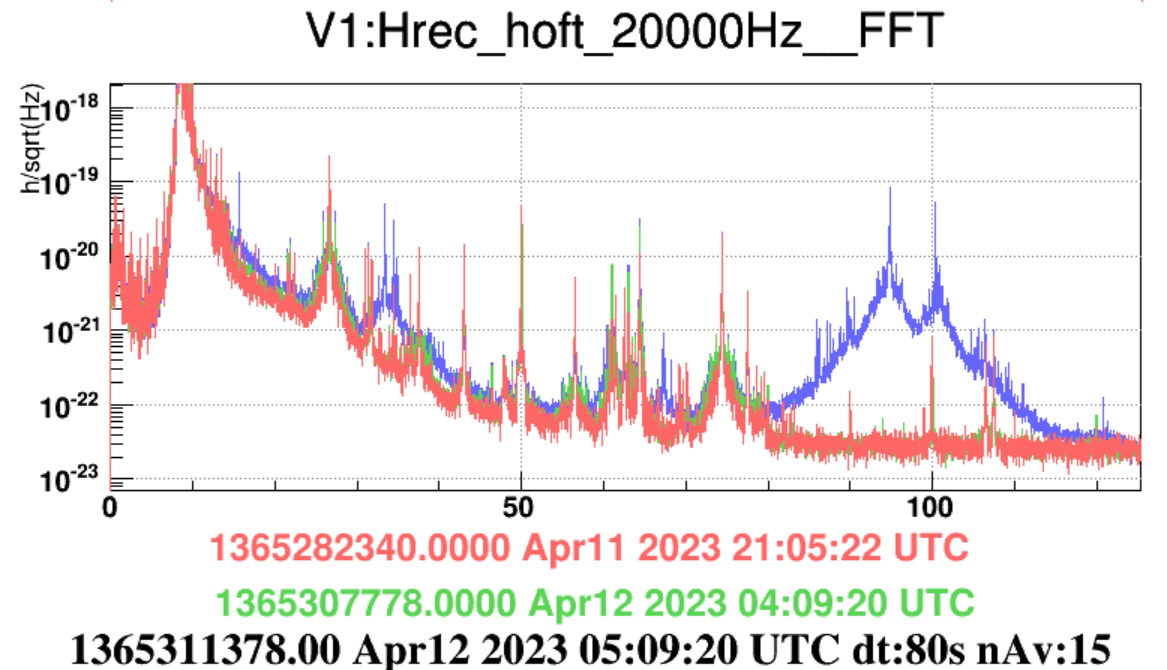
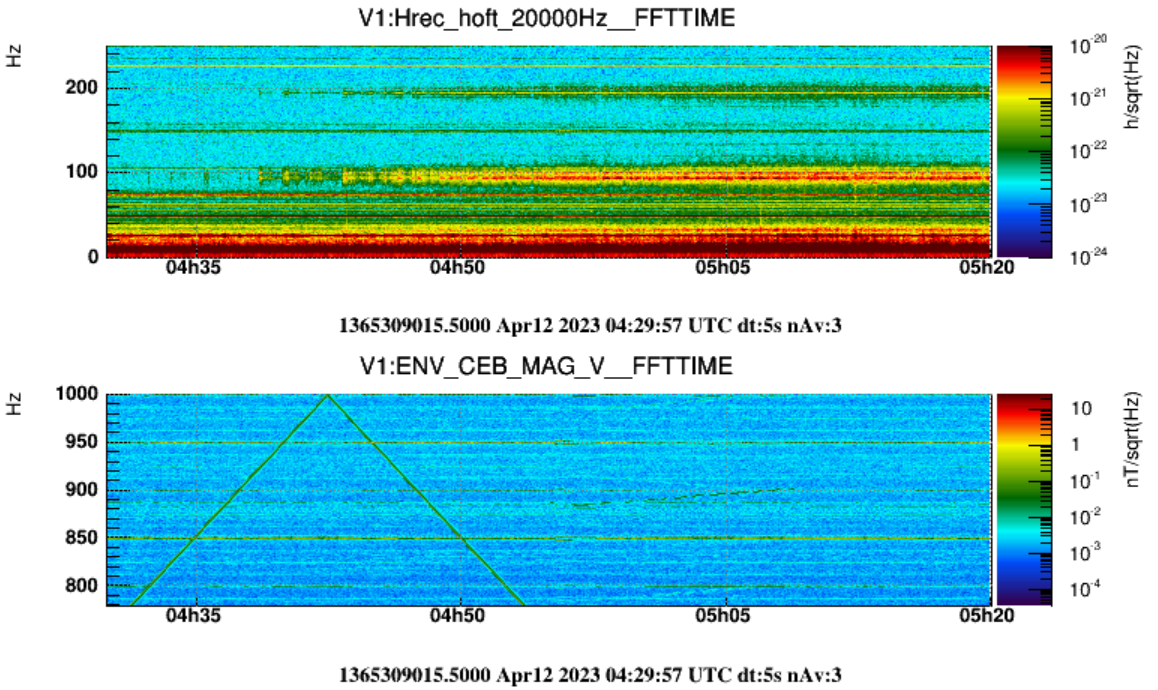
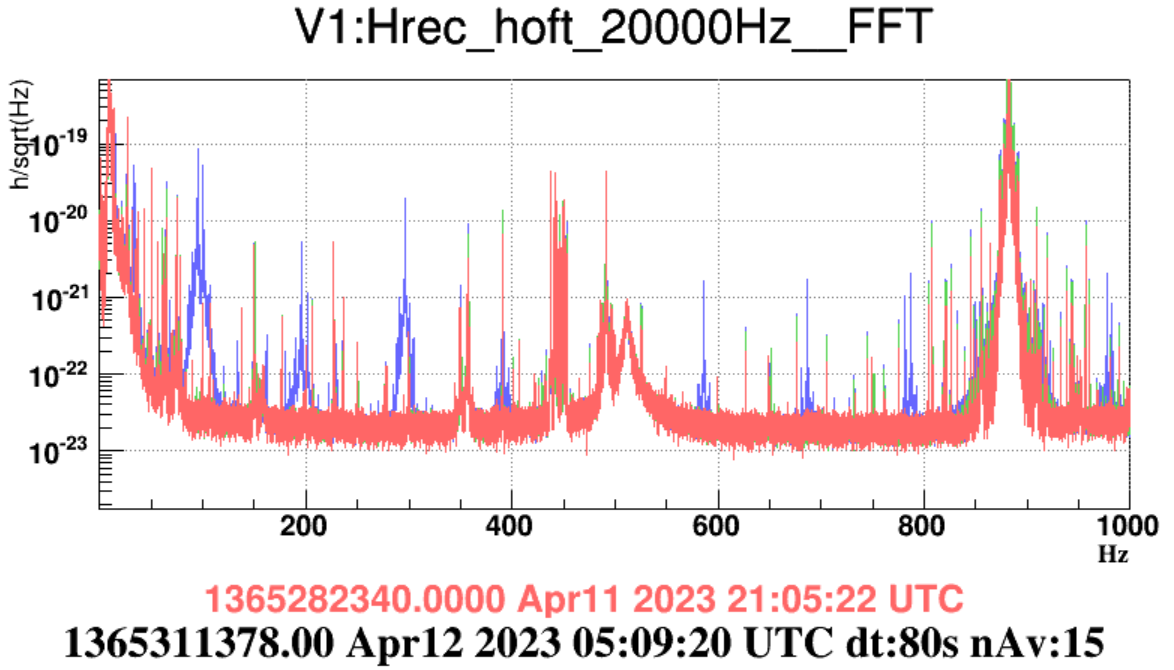
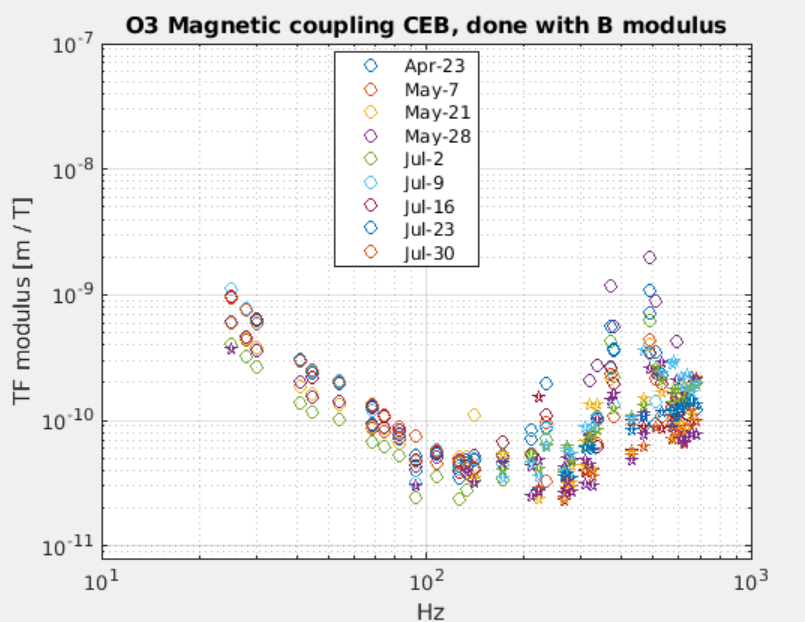
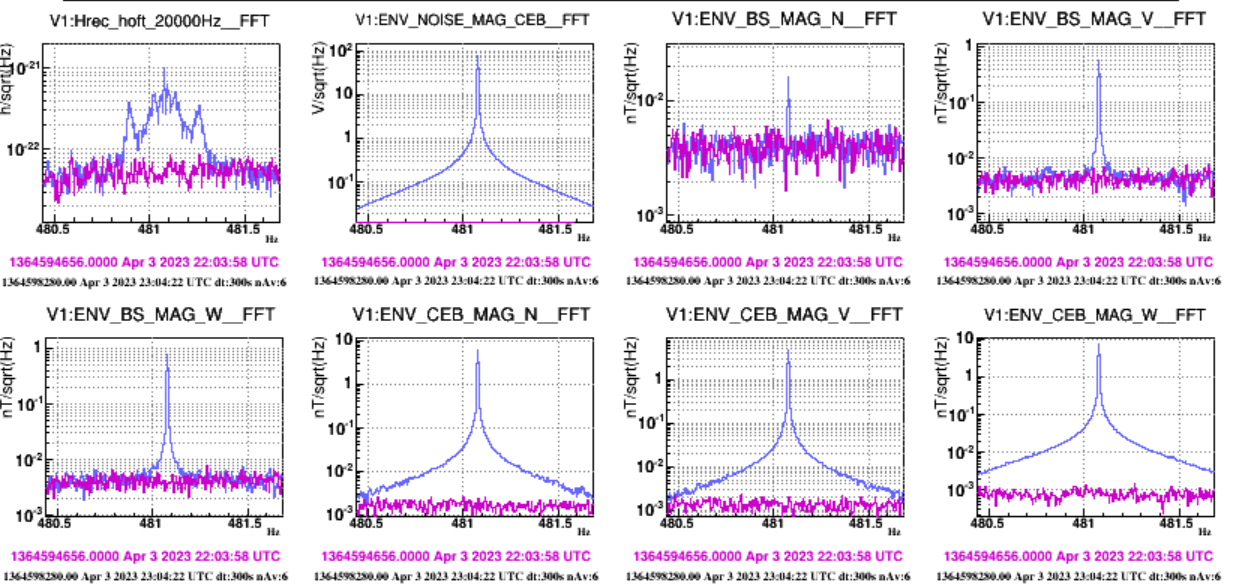
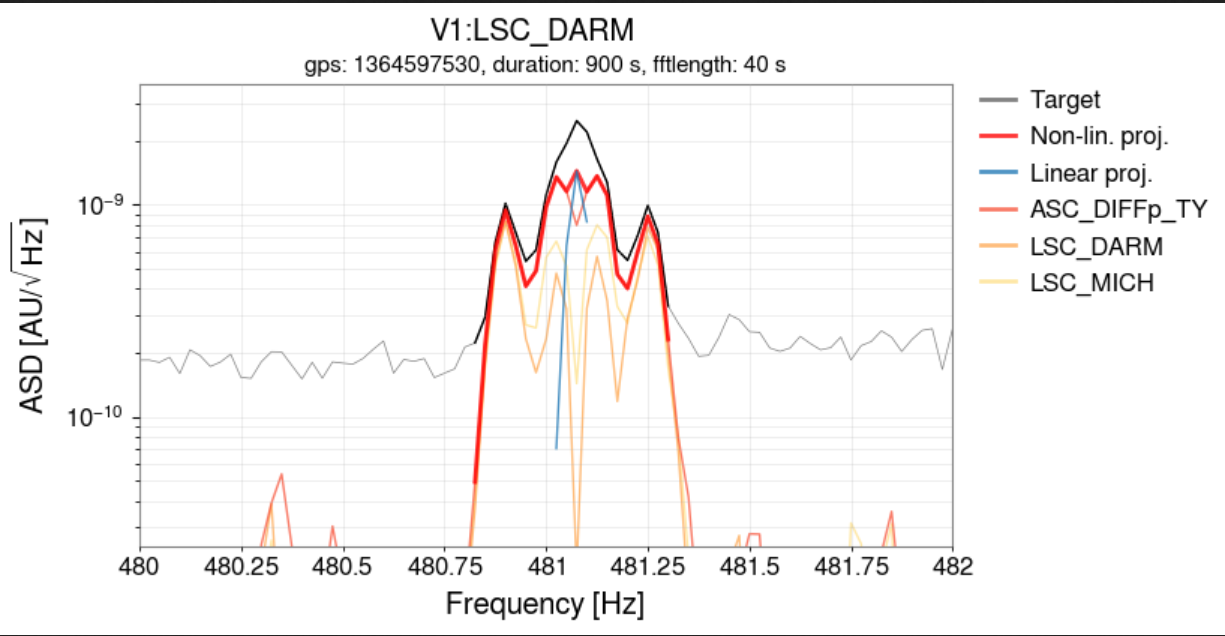
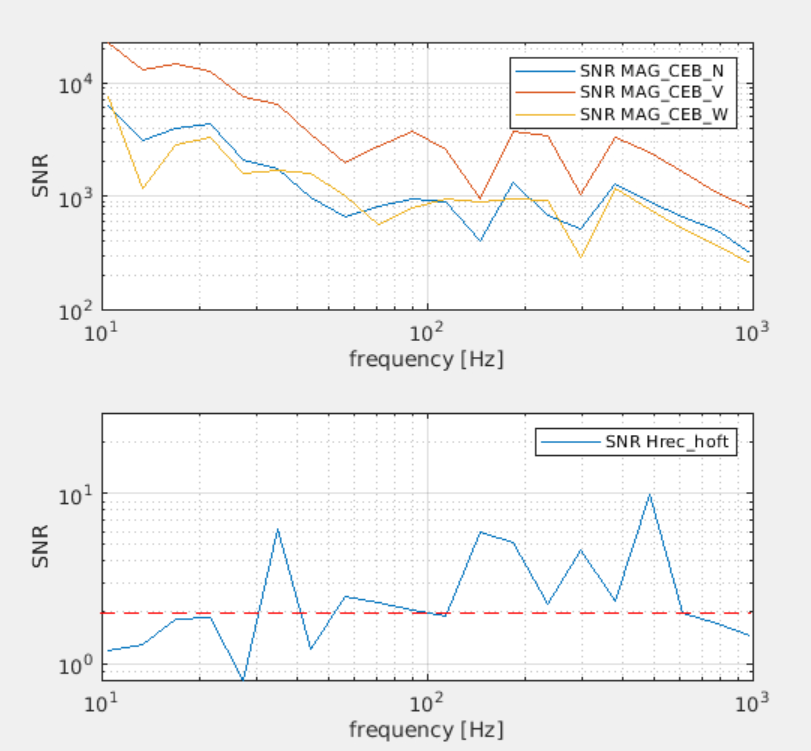
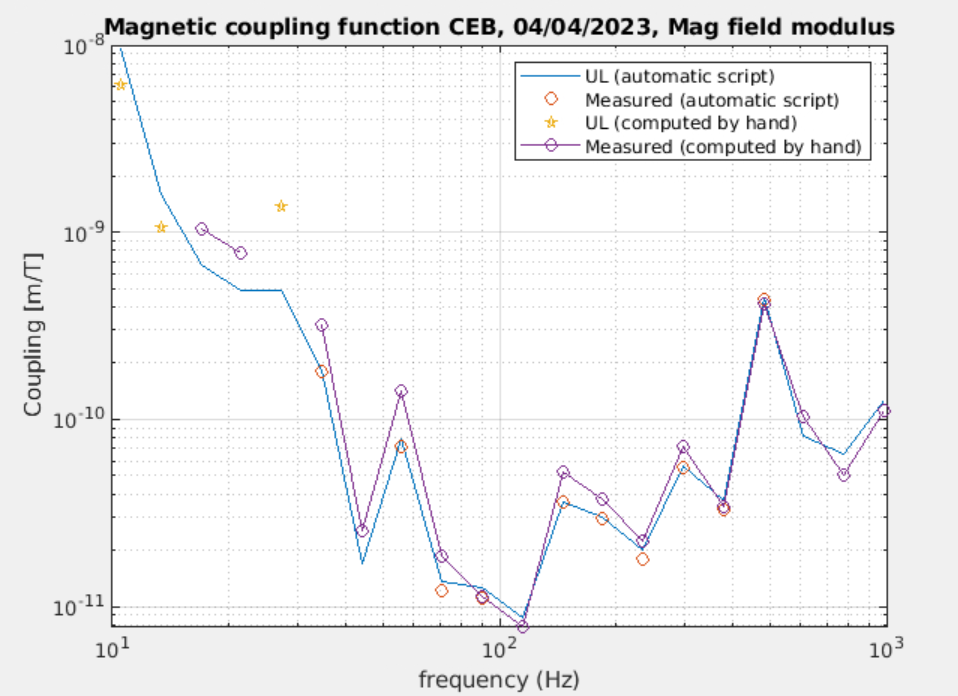
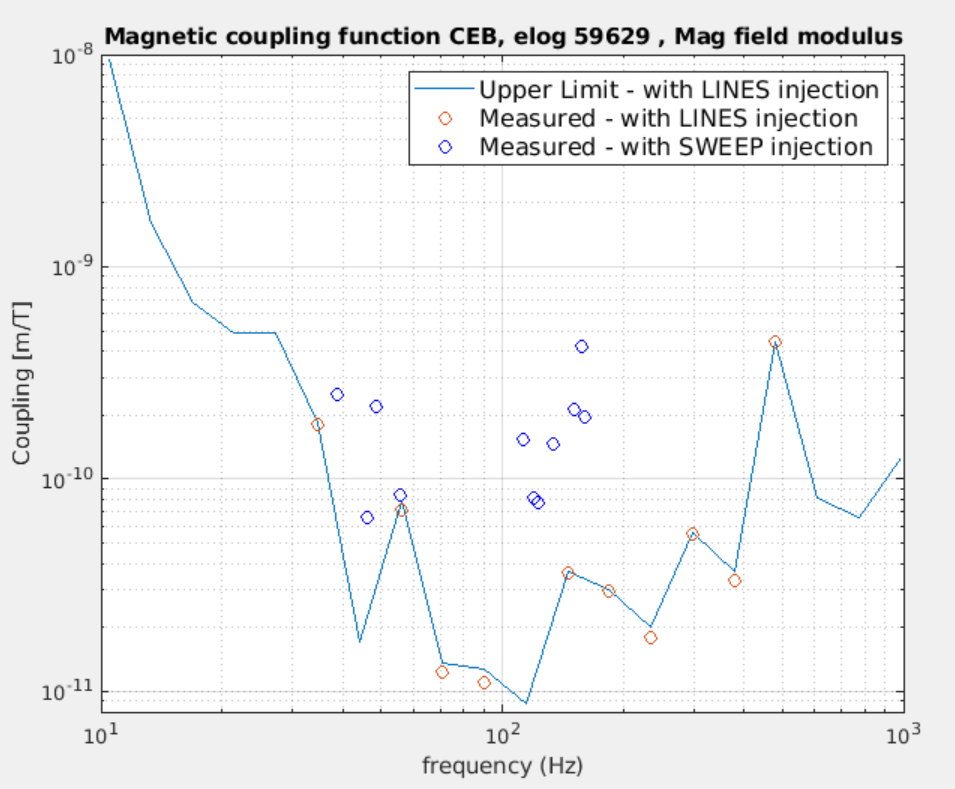
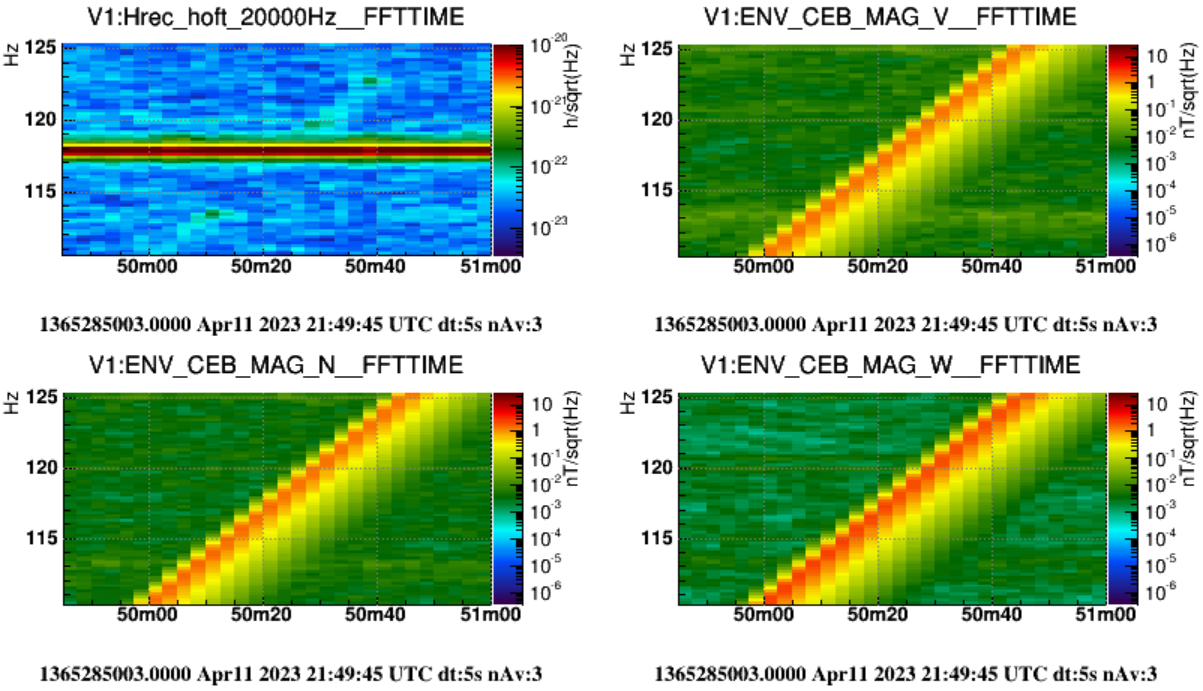
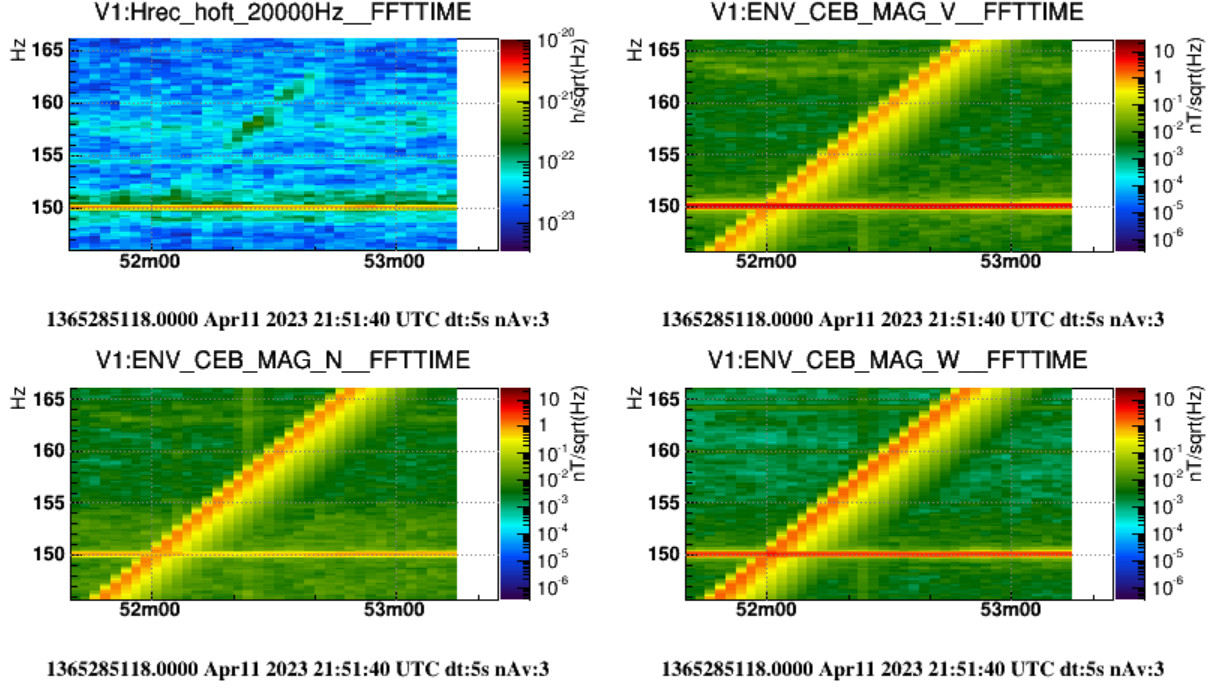
Most of the injected lines were visible in DARM (Hrec): A few examples are attached. The computation of TF will follow.

Images attached to this report
Non-image files attached to this report
Comments to this report:
Fiori, Tringali - 0:09 Wednesday 12 April 2023 (59747) Print this report

This night we performed a magnetic sweep injection in the CEB by means of the large coil.

The injection started at 21:45 UTC: linear sweep from 10 Hz to 1 kHz with a duration of 3600 sec.

The magnetic injection is ongoing and will be stopped (manually) tomorrow before the start of the morning shift. 

fiori, tringali, paoletti - 16:56 Wednesday 12 April 2023 (59761) Print this report

Some results:

  • Along the night the magnetic sweep performed about four 2-hour long cycles from 10Hz to 1kHz and back to10 Hz. Then almost one full 1-hour long cycle from 20 to 100Hz.
  • The effect of the magnetic sweep in the interferometer was feeble.
  • A feeble track in Hrec is seen in the region 100 to 160 Hz (Figure 1) and between 40 and 60Hz (Figure 2, this one is relative to the slower sweep injected during the last hour). 
  • When passing through the 46-48Hz range, the sweep excited a few peaks in the bunch (Figure 3). Namely:  47.74, 48.30, 48.62, 48.83 Hz
  • Despite the fact that the injected noise with the sweep at each frequency was about a factor 5 larger that the white noise injection reported in 59669, we did not reproduce that effect: see Figure 4, showing the 40-50Hz injection time window.

Other effects observed during the night:

  • Along the night the sideband noise around some lines increased: in Figure 5, green versus orange.
  • At about 4:30 UTC some lines started growing up in DARM and Hrec: in Figures 6, blue versus green.
  • Their onset seems not related to the magnetic sweep, which had already repeated its cycle a few times before this excitation appeared: Figure 7.
Images attached to this comment
fiori, miritescu, tringali, paoletti - 19:03 Wednesday 12 April 2023 (59764) Print this report

Some results:

  • Figure 1 shows the coupling function (units of m/T) between Hrec and the modulus of the magnetic field measured by ENV_CEB_MAG* Metronix sensors (which are located in more or less the same location as during O3: 58639). The blue curve (Upper limit values) and red circles (measured values)  is computed using the automathe script: /virgoData/NoiseInjections/MagneticInjectionsO4/EnvSwepts/scripts/CalculateTransferFunction.py. The yellow stars (upper limits) and violet circles (measured) are the same computed by hand in order to validate the script computation. They correspond nicely. The automatic script used 80s FFT window, while the "by hand" computation used 100s windows for lines up to 100Hz and 300s window for lines above 100Hz. 
  • Figure 2 shows the coupling functions (same units of m/T) measured with weekly injections during O3. Circles are measured values and stars are upper limits. The shape is similar, both the drop with frequency up to 100Hz and the rise above 100 Hz. An absolute comparison of the O3 coupling function and that of Figure 1 is not fair. Infact the location of the injection coil in O3 and now is not the same (although both in the upper terrace).
  • Some injected lines in Hrec and DARM had sideband structures. This is mostly evident in the 481 Hz line (Figure 3) but also for other lines between 150 Hz and 500 Hz.
  • We run MONET on the 481 Hz line and found that the winning modulator is ASL_DIFFp_TY (Figure 4).
  • Figure 5 shows the SNR of the injected lines. Lines were well visible in the ENV_CEB_MAG channels, although SNR drops with frequency (because of the Coil inductance). Instead Hrec lines have not so large SNR, actually barely above SNR=2 which is the acceptance threshold, despite the ~100s window used.This means that the injection time used (300s for lines below 100Hz) and 900s for lines above 100Hz, is necessary. That makes a total injection time of 3hrs. This should be reduced. For low frequency we can take advantage of the reduction of Hrec noise, for High frequency we shall implement a trick to increase the coil response.
  • Files with the computed values are attached
Images attached to this comment
Non-image files attached to this comment
fiori, tringali, miritescu - 11:07 Monday 17 April 2023 (59819) Print this report

Figure 5 compares the magnetic coupling (MCF) measured in CEB by injecting (with the wall coil) a set of LINES (April 3 night) and then by injecting a magnetic SWEEP (April 11 night).

The MCF with the lines injection is computed by the automated script. The MCF with the sweep injection is computed by reading the intensity of the pixels of Hrec and Magnetometers spectrograms (Figures 1-4) and applying the usual formula. The "injection" data is the intensity of the pixel corresponding to the sweep frequency, the "background" data is the intensity of the previous pixel.

The MCF measured with the sweep in the range around 150Hz is larger (by a factor ~5) than the one measured with lines. One reason could be that the magnetic coupling is not stable and changes from lock to lock. To check this hypotesis we need to repeat the measurement a few times.

Images attached to this comment
tringali, fiori - 1:08 Tuesday 18 April 2023 (59837) Print this report

We performed two magnetic injections in CEB:

  • a linear frequency sweep from 40Hz to 200Hz, starting at 21:42 UTC and lasting 1800s. This was done manually using ENVmon server
  • a set of 20  lines logaritmically spaced between 10Hz and 1kHz (the same set of lines injected on April 3rd) starting at 22:51 UTC (the first 300s are quiet time). This was done using the automated script.

The purpose is two fold: 1) check if the coupling function changes from lock to lock; 2) compare the TF measured with the sweep and the TF measured with the lines.

Images attached to this comment
fiori, tringali - 1:52 Friday 12 May 2023 (60187) Print this report

Today we collect data to perform some tests:

  • test changing the speed of the sweep - at NEB we injected with the large coil a sweep between 30 and 100Hz with duration of 300s, 600s and 1200s (the sweep is visible in DARM while Hrec looks more noisy)
  • test linearity: at NEB we inject with the large coil lines at 36Hz, 56Hz and 115Hz with max amplitude (5V, 9V, 9V) and half of it (2.5V, 4.5V and 4.5V). We used the automated script. The two log files are attached. All lines looks well visible in hrec using 100s FFT.

and finally, we remeasured the CEB coupling from the large coil by injecting a very slow sweep over-night: from 10 Hz to 500 Hz, 9V, 15000s.

Details are in the attached log file.

Non-image files attached to this comment
fiori, tringali - 0:13 Sunday 23 July 2023 (60929) Print this report

We performed a  sweep magnetic injection in the frequency range 10 to 500 Hz, with 1800s duration. All CEB magnetometers (BS, WI, NI, IB, DT) were active. The PRCL, SRCL, MICH and DARM lines were off (clean hrec below ~40Hz):

  • quiet reference - 21:26:03 UTC (300s)
  • sweep started - 21:33:10 UTC
  • sweep stopped -  22:13:03 UTC
fiori, tringali - 17:53 Monday 24 July 2023 (60953) Print this report

Indeed the sweep was from 8Hz to 500Hz, but we start seeing something in hrec only from 15 Hz.

The first plot shows the excited structures in Hrec during the this last injection (July 22).

The second figure shows the same for the previous injection (July 19) which was interrupted at about 400Hz because of the ITF unlocked.

The third Figure shows the computed magnetic Coupling Function normalized to the modulus of the CEB metronix magnetometers. Overlapped are some points (blue stars) and upper limits (red stars)  measured with the lines injection.

The fourth Figure compares the CF curve measured at different times: April 3rd (lines), the with sweeps: April 17, April 27, July 19, July 22. On April 27 the coupling around 40Hz was a bit larger. But apart from this, the coupling measured with sweeps at 4 different times looks consistent.  As already noticed, the coupling measured with the lines is a factor 2-3 smaller.

These hrec structures were excited during the CEB injection:

  • 47.8 Hz
  • 48.6 Hz
  • 157 Hz
  • 162 Hz
  • 197 Hz
  • 276 Hz
  • 306 Hz
  • 483 Hz
Images attached to this comment
Paoletti - 9:31 Tuesday 25 July 2023 (60964) Print this report

for easier reference:

sweep start - 21:33:11 UTC on 22 July (GPS 1374096809)

Images attached to this comment
Tringali - 20:48 Saturday 30 September 2023 (61852) Print this report

*** Far-field sweep magnetic injection in the Central building ***

The magnetic injection was performed by means of the CEB large coil:

Linear sweep from 8 Hz to 1 kHz with a duration of 1800 sec ( ACL_SWEEPLINE_CH    sweep     "V"    1    SAMP_FREQ         8. 1000.  9. 1800  linear   0     0)

Quiet time: 17:29:23 UTC - 17:37:00 UTC 

Start injection:  17:37:20 UTC
Stop injection:  18:13:17 UTC
 

Search Help
×

Warning

Error

The present report has been modified outside this window. Please check for its integrity in the main page.

Refreshing this page will move this report into drafts.

×