Reports 1-1 of 1 Clear search Modify search
AdV-SAT (FP SAs Filter Blades Adjust)
ruggi, boschi - 21:48 Friday 04 October 2019 (47098) Print this report
48 Hz investigation

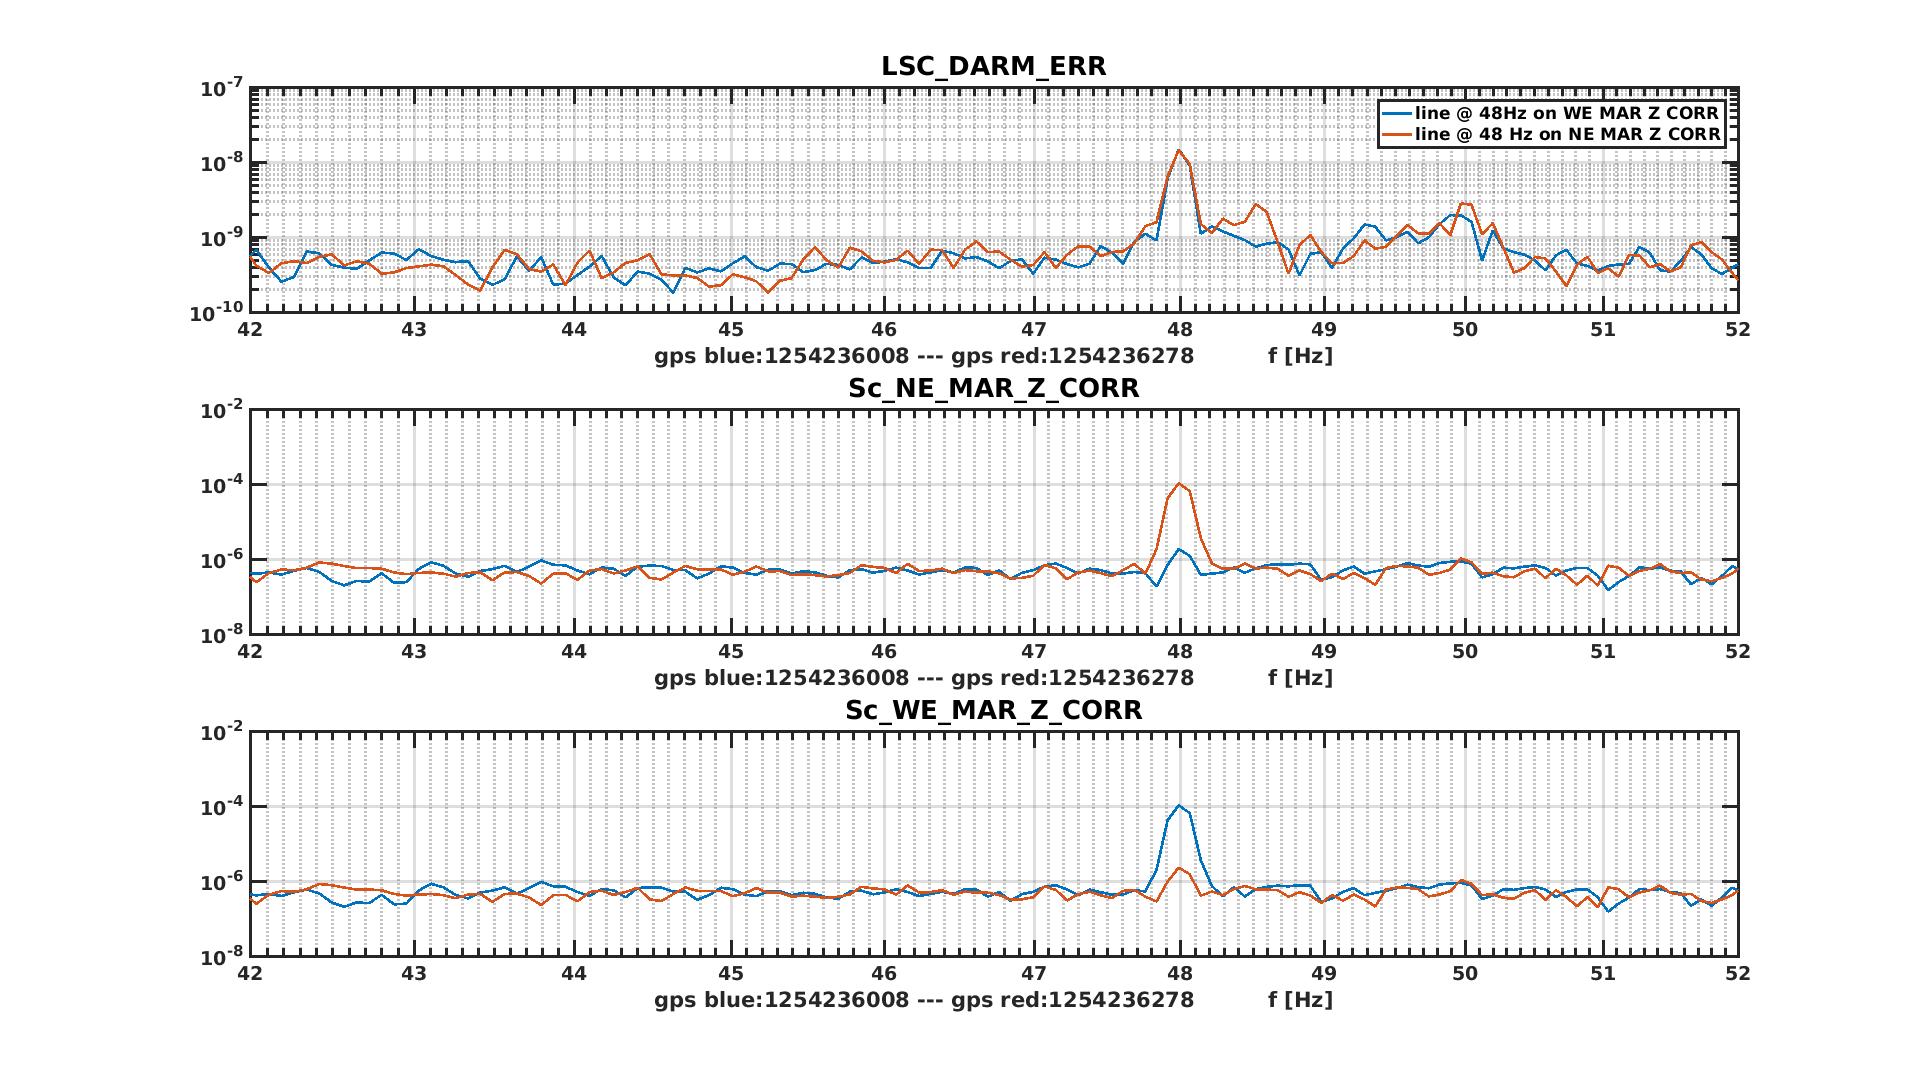
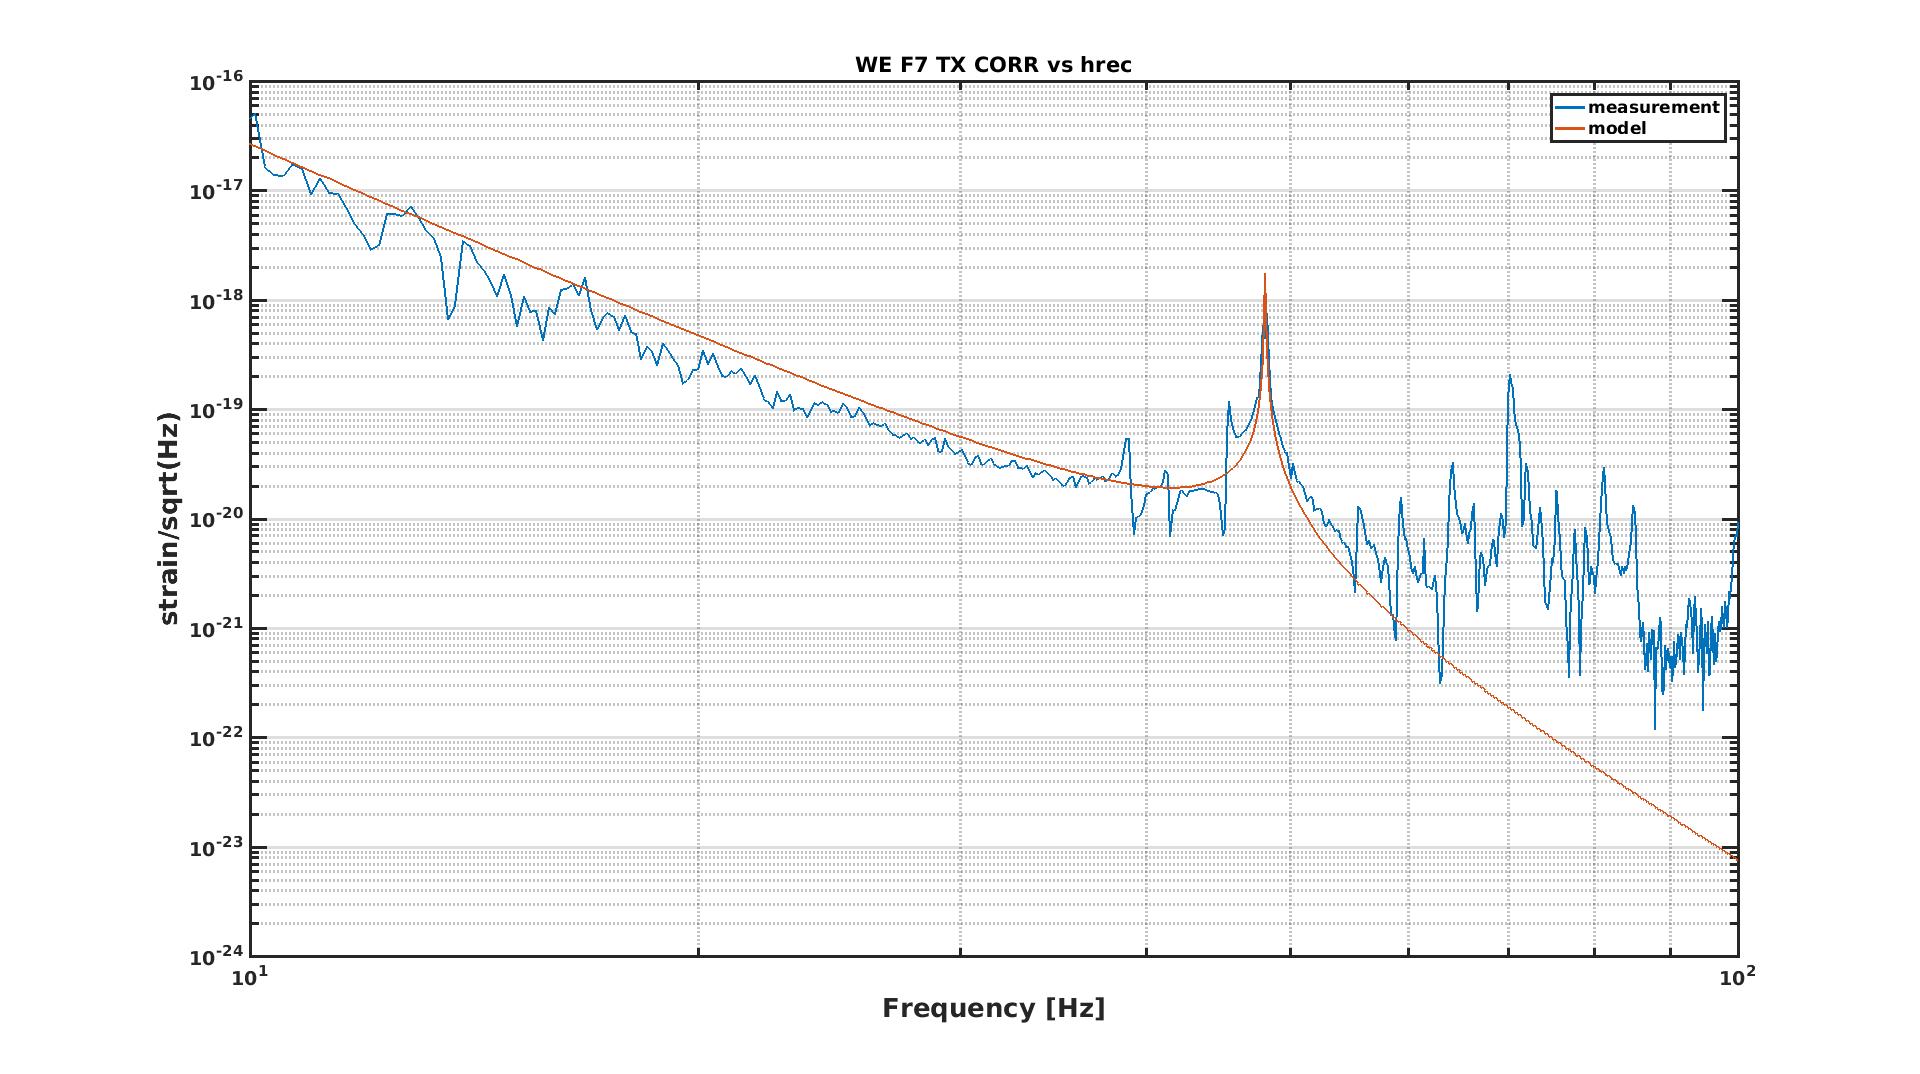
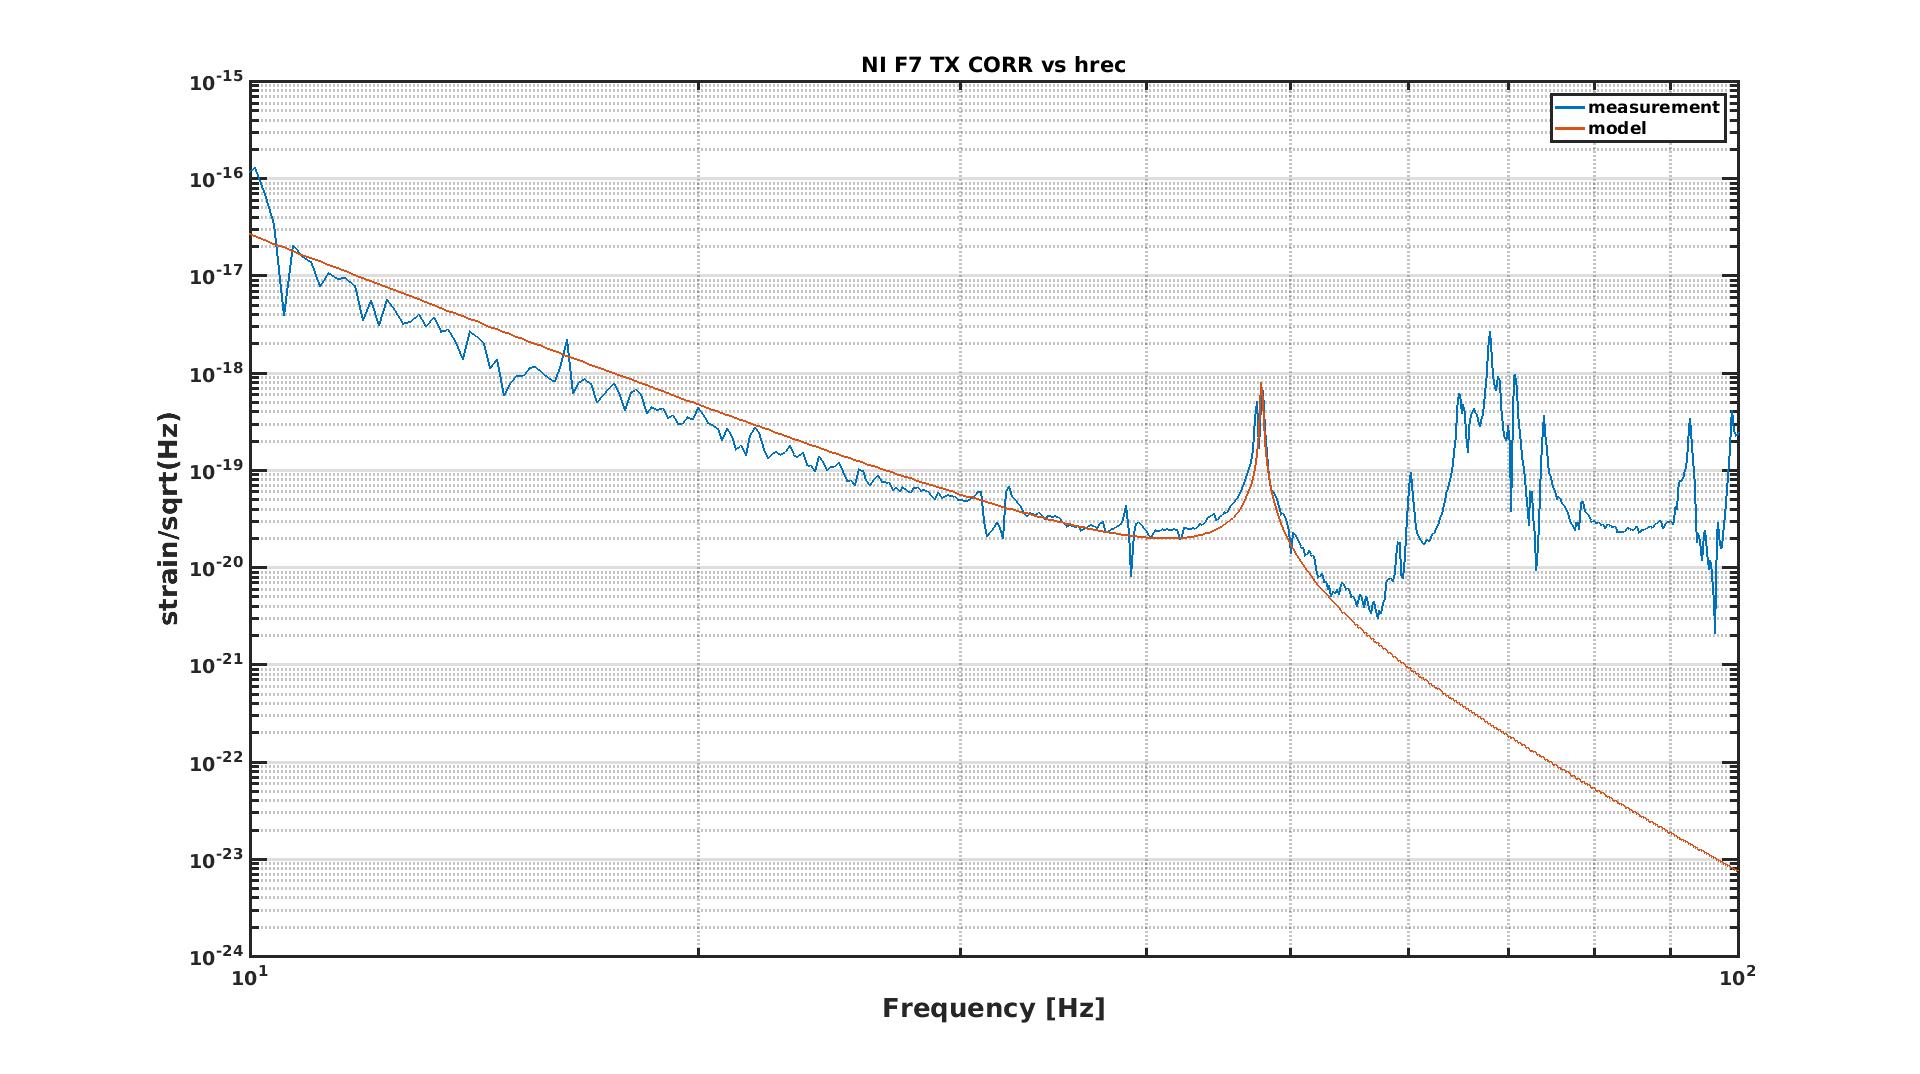
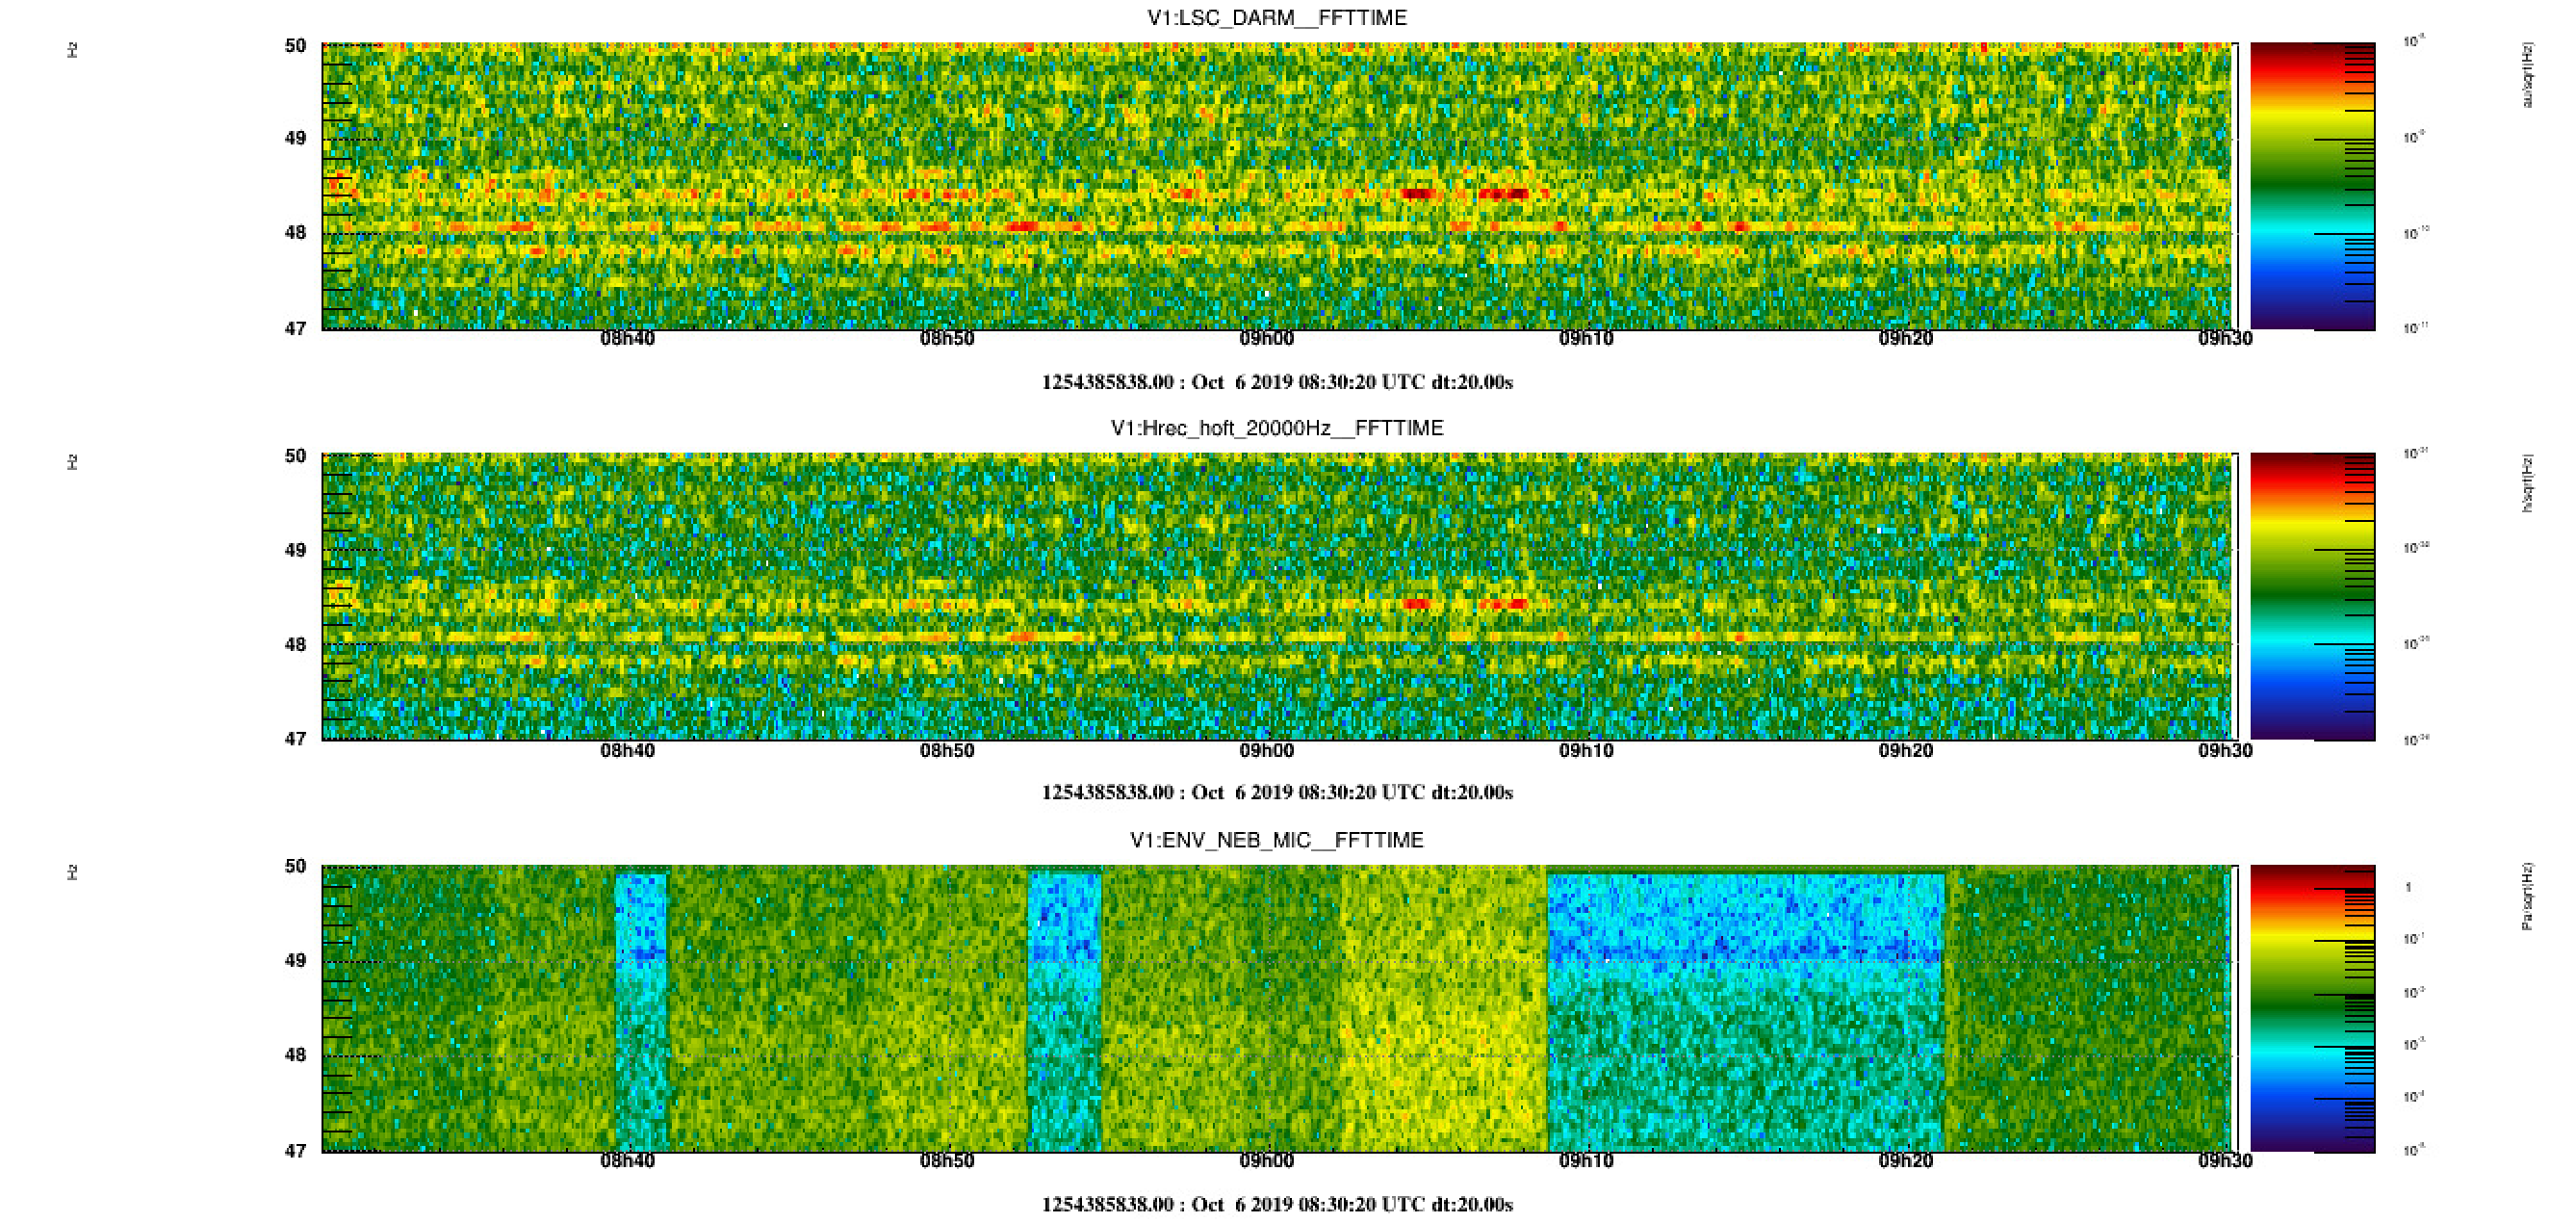
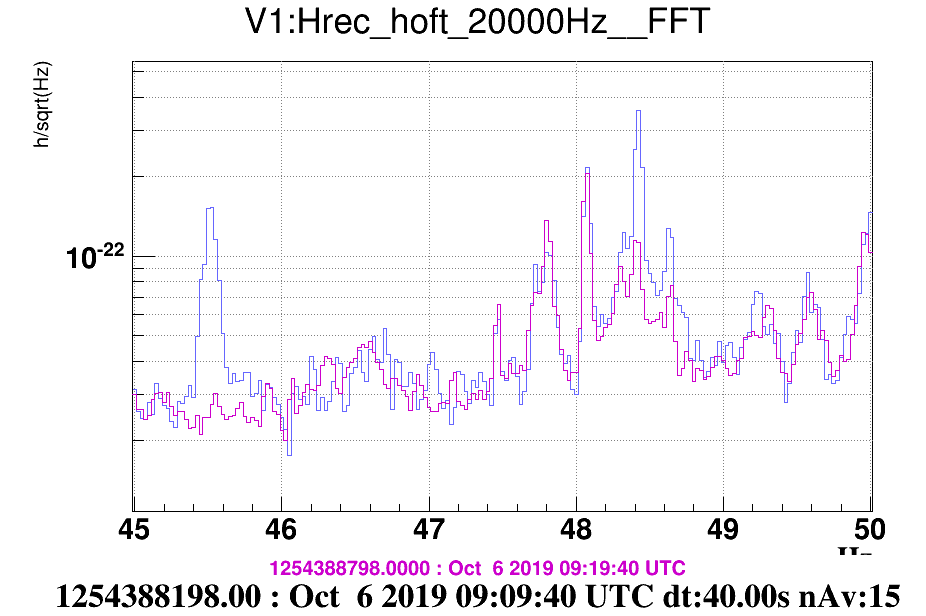
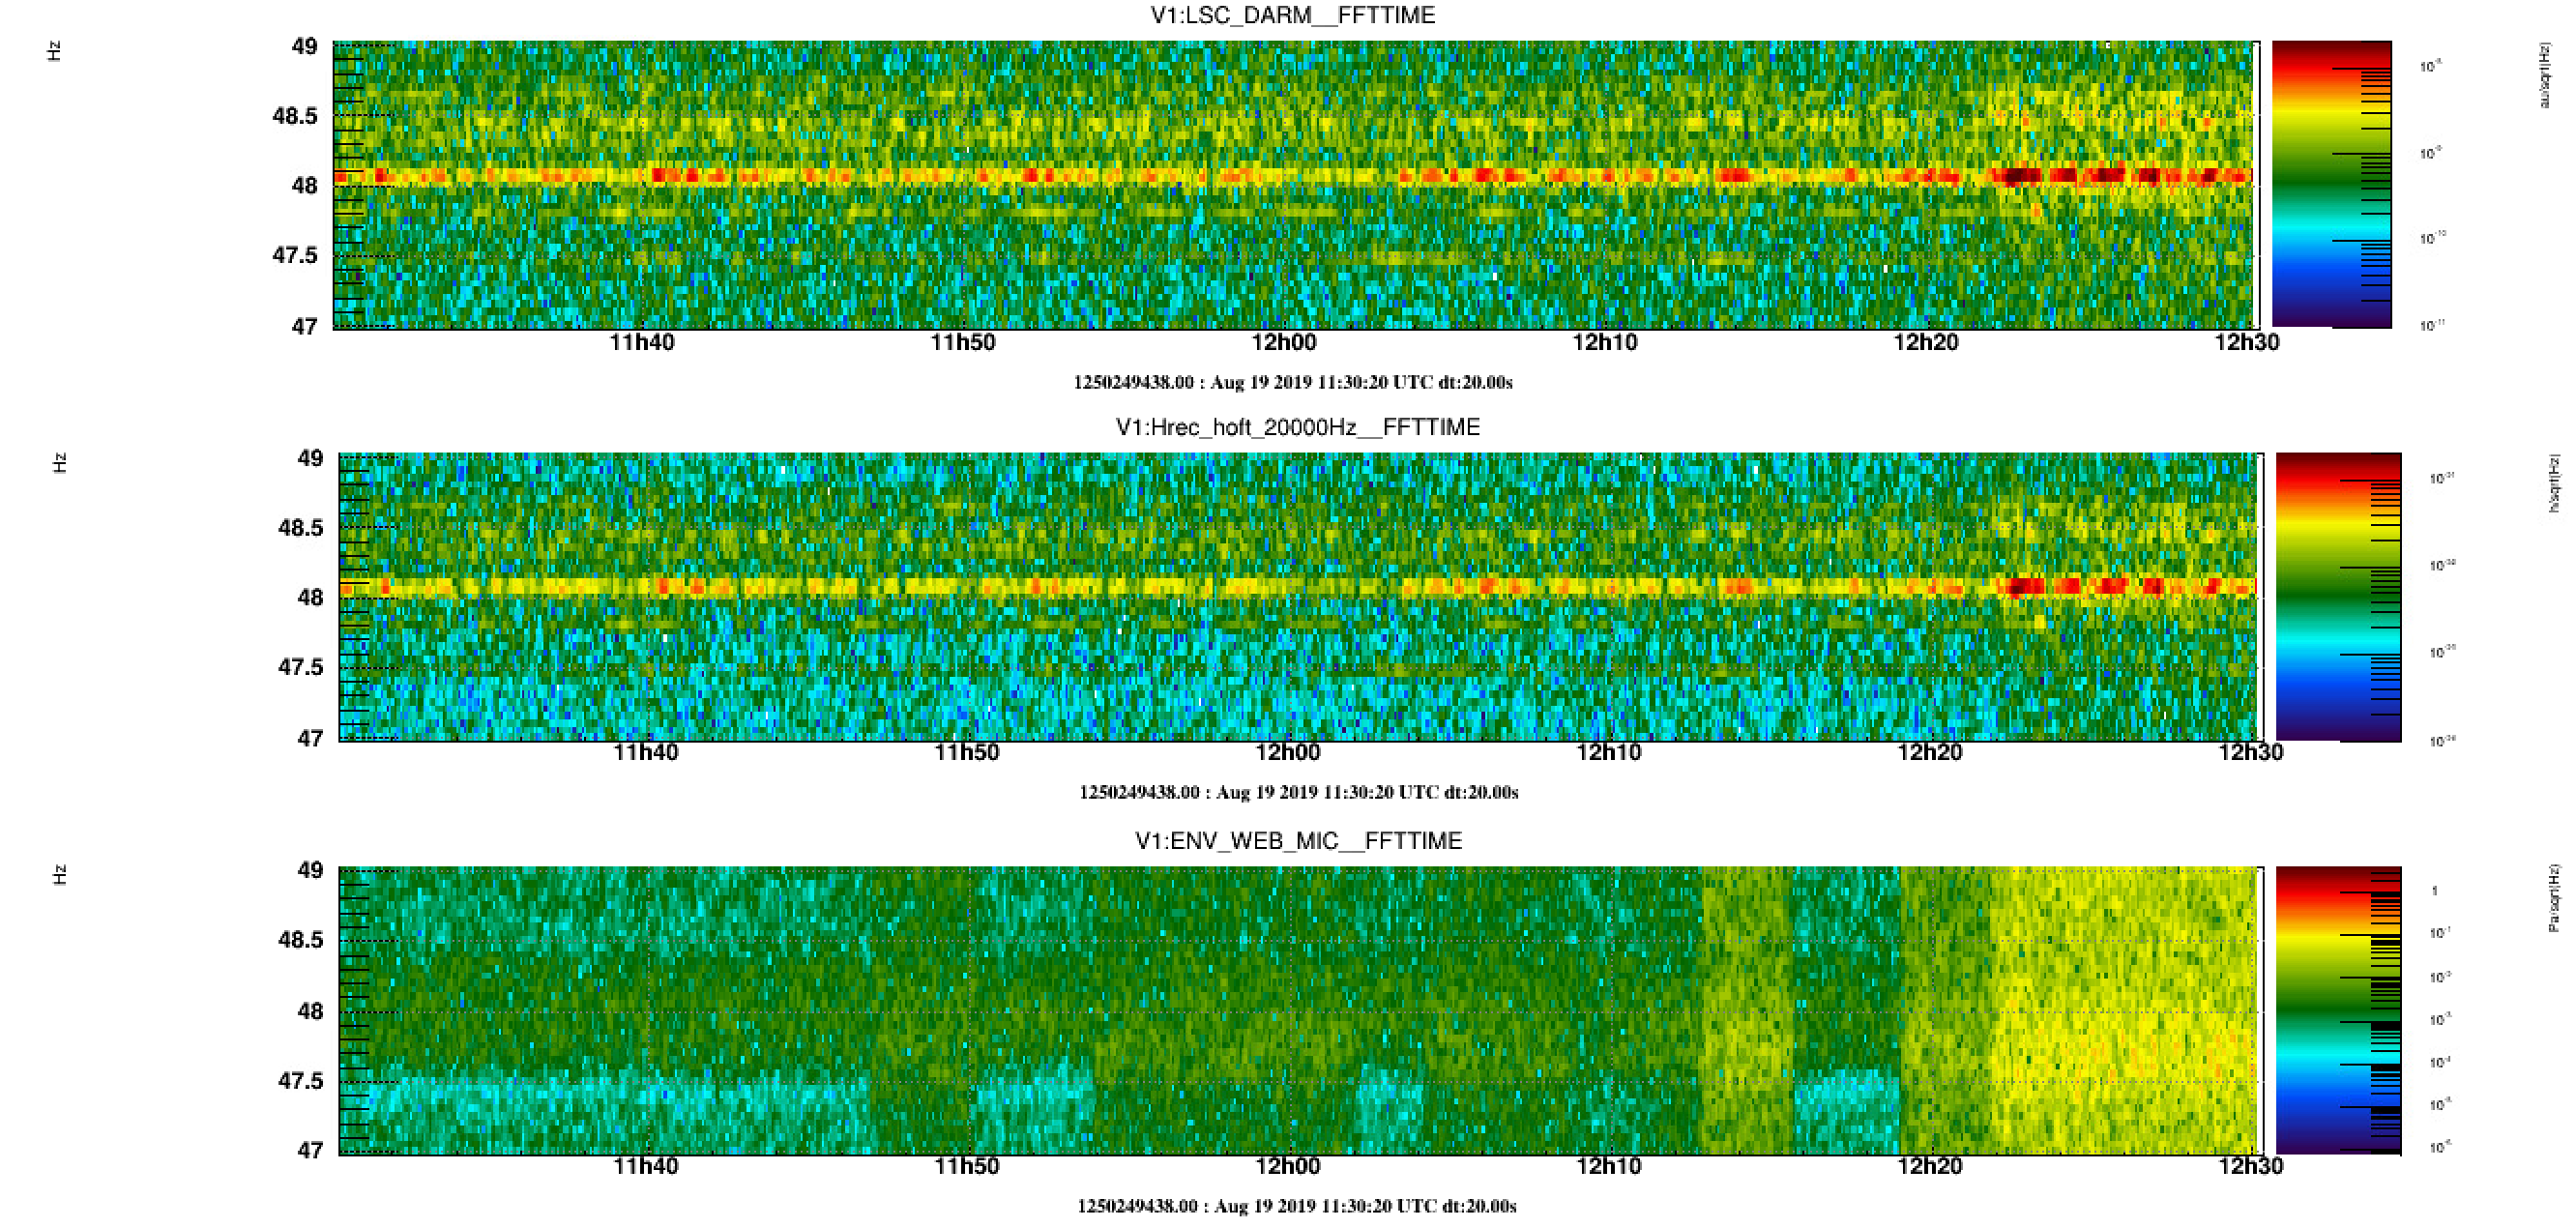
In order to investigate the source of the peak at 48 Hz in the sensitivity, we started injecting noise on WE marionette, which in the past has shown to be more reactive than the others at that frequency. As reference, we made the same injections on NE marionette.

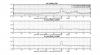
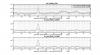
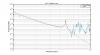
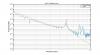
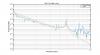
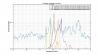
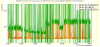
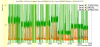
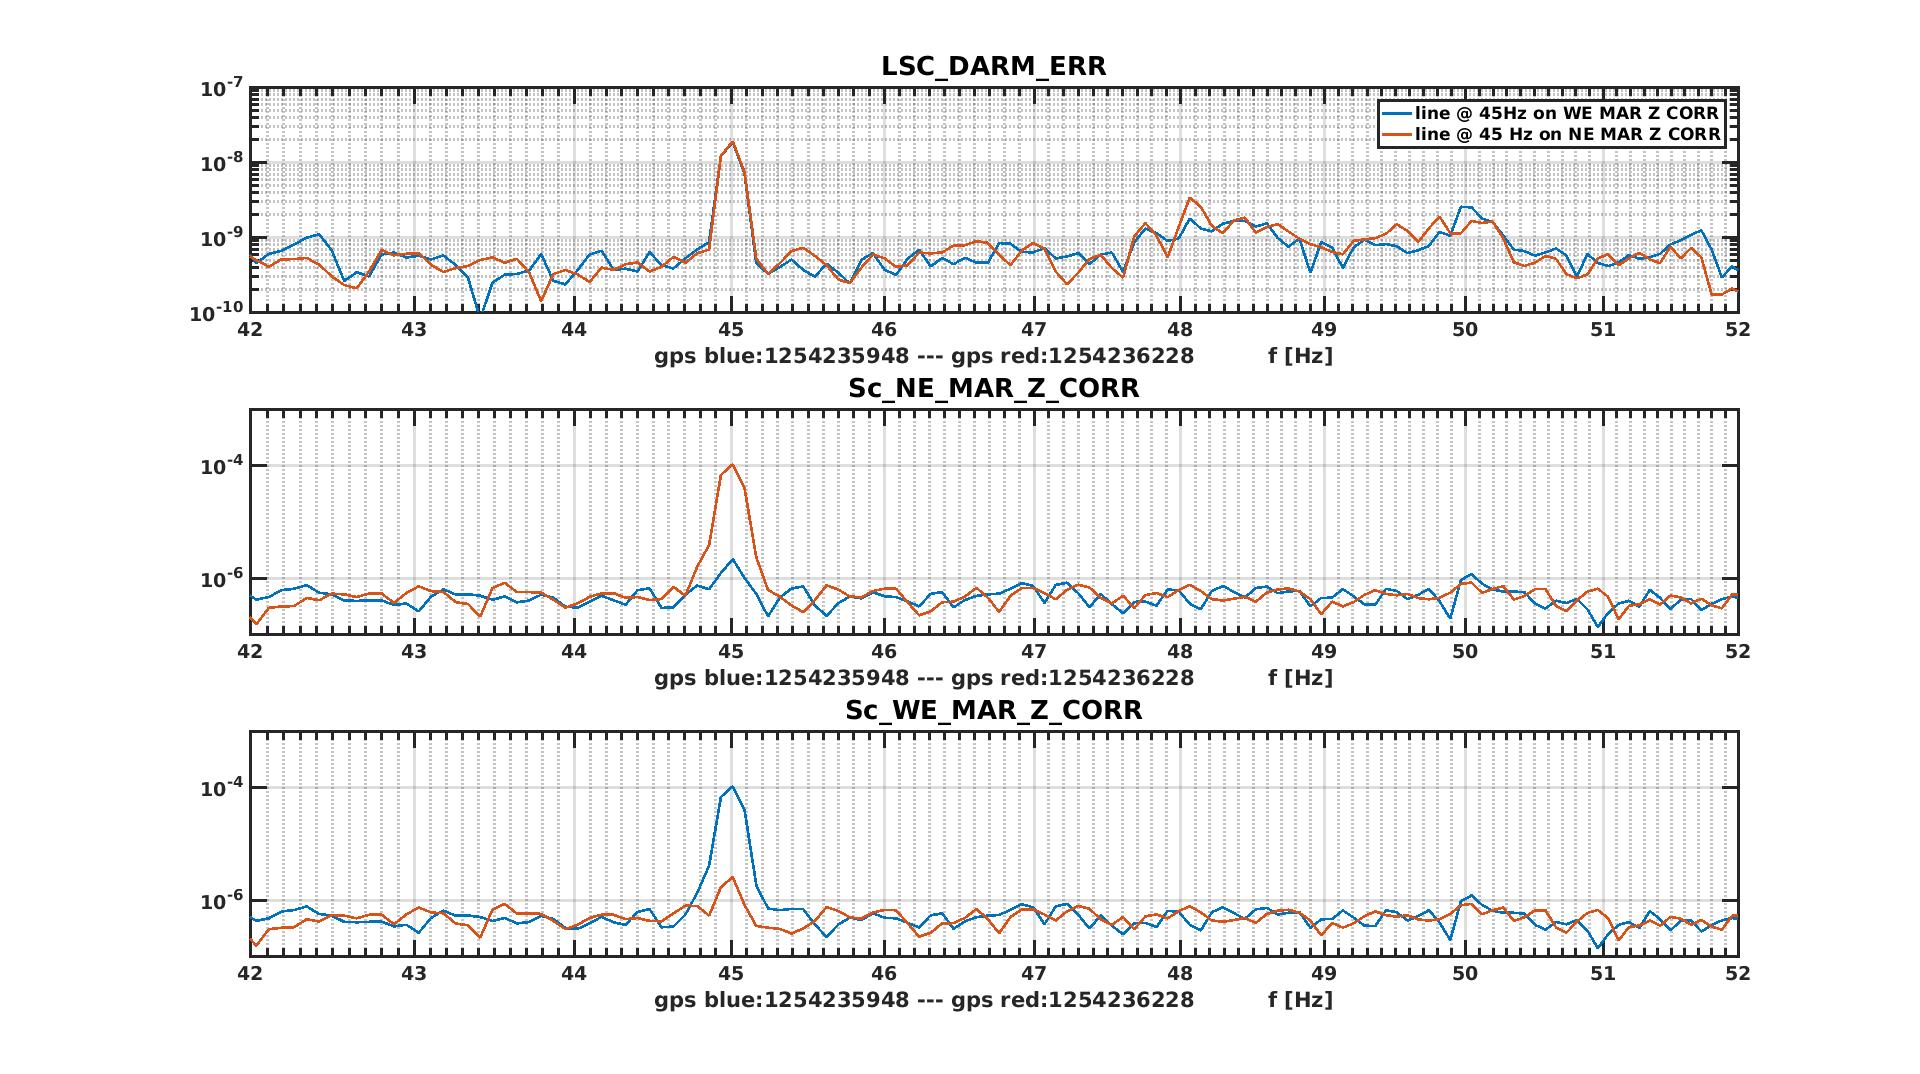
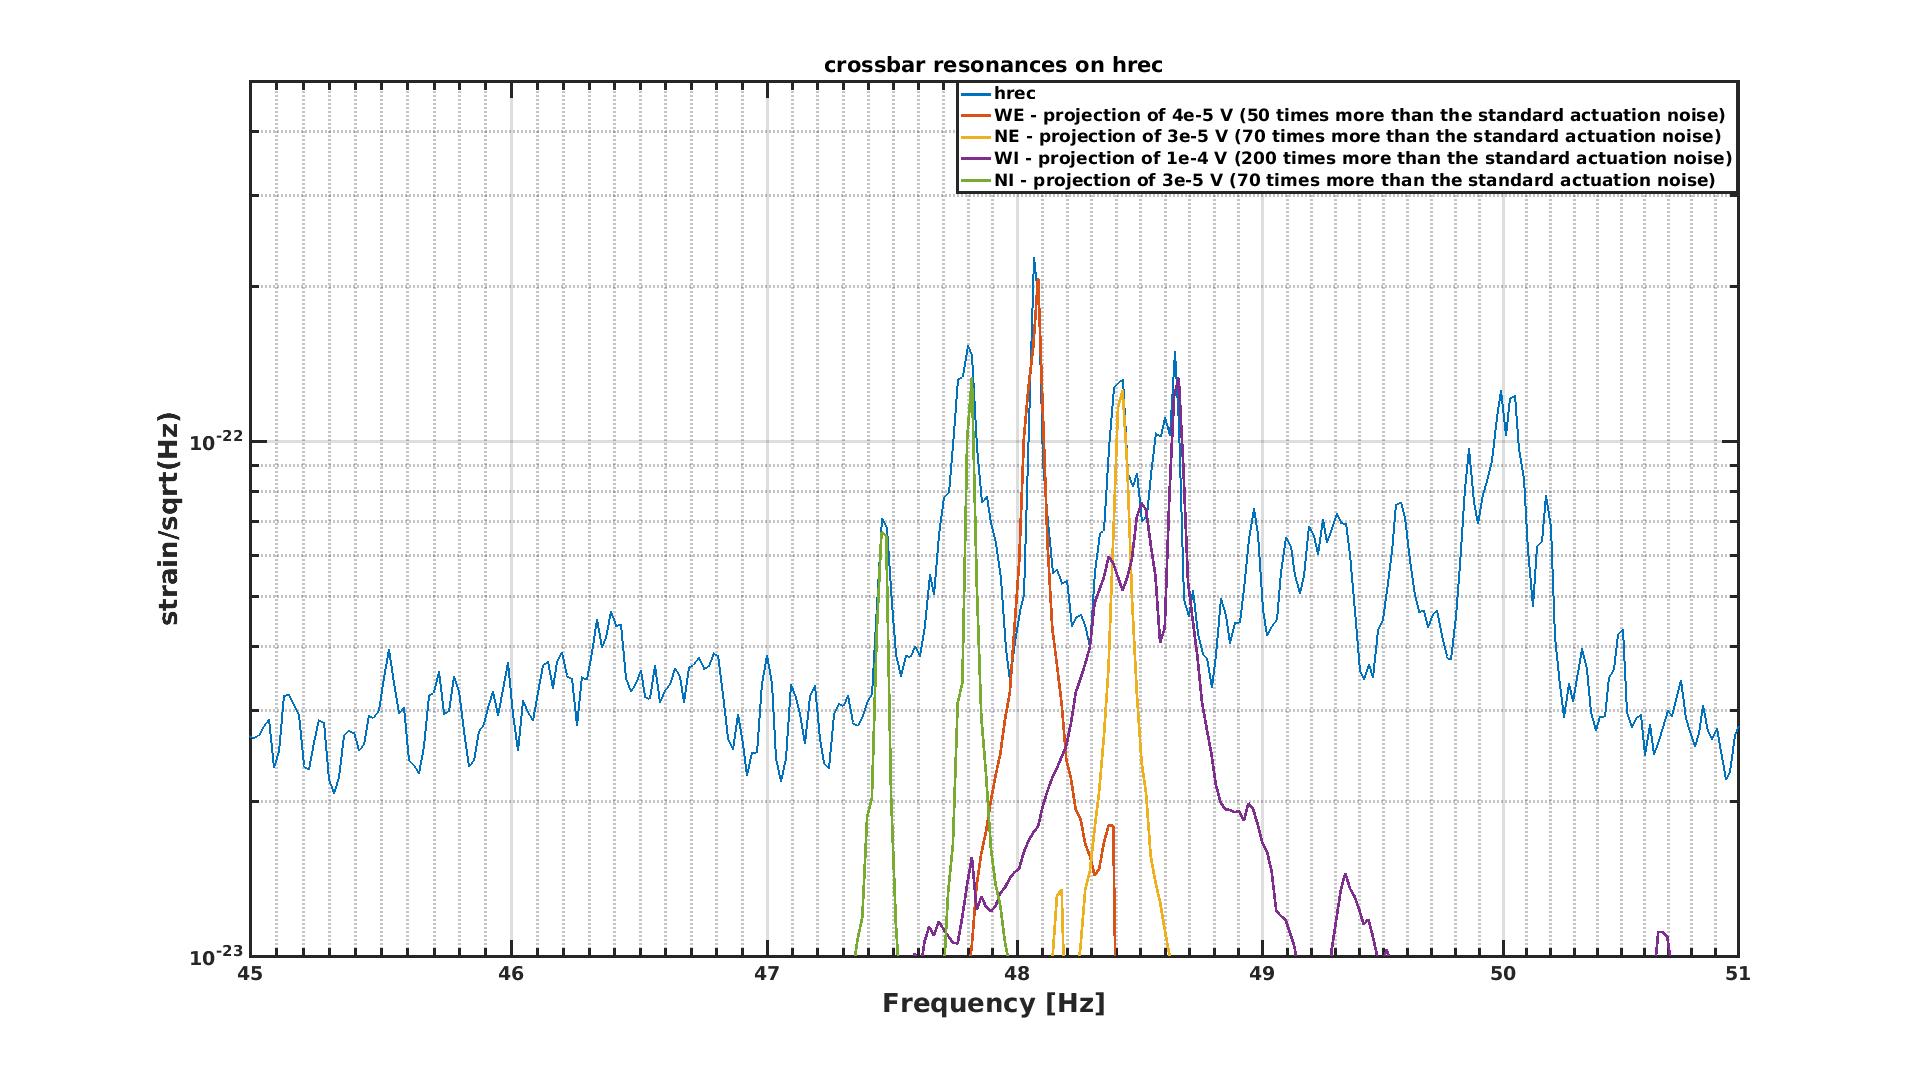
As in the past, a vertical line excited the peak when it was injected on WE vertical, more than on NE. But injecting along the horizontal direction, the effect was the same for the two payload, and it was the same also injecting a similar line at 45 Hz (fig 1, fig 2). It is not what one migth expect if the peak was due to a WE marionette resonance (even vertical).

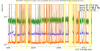
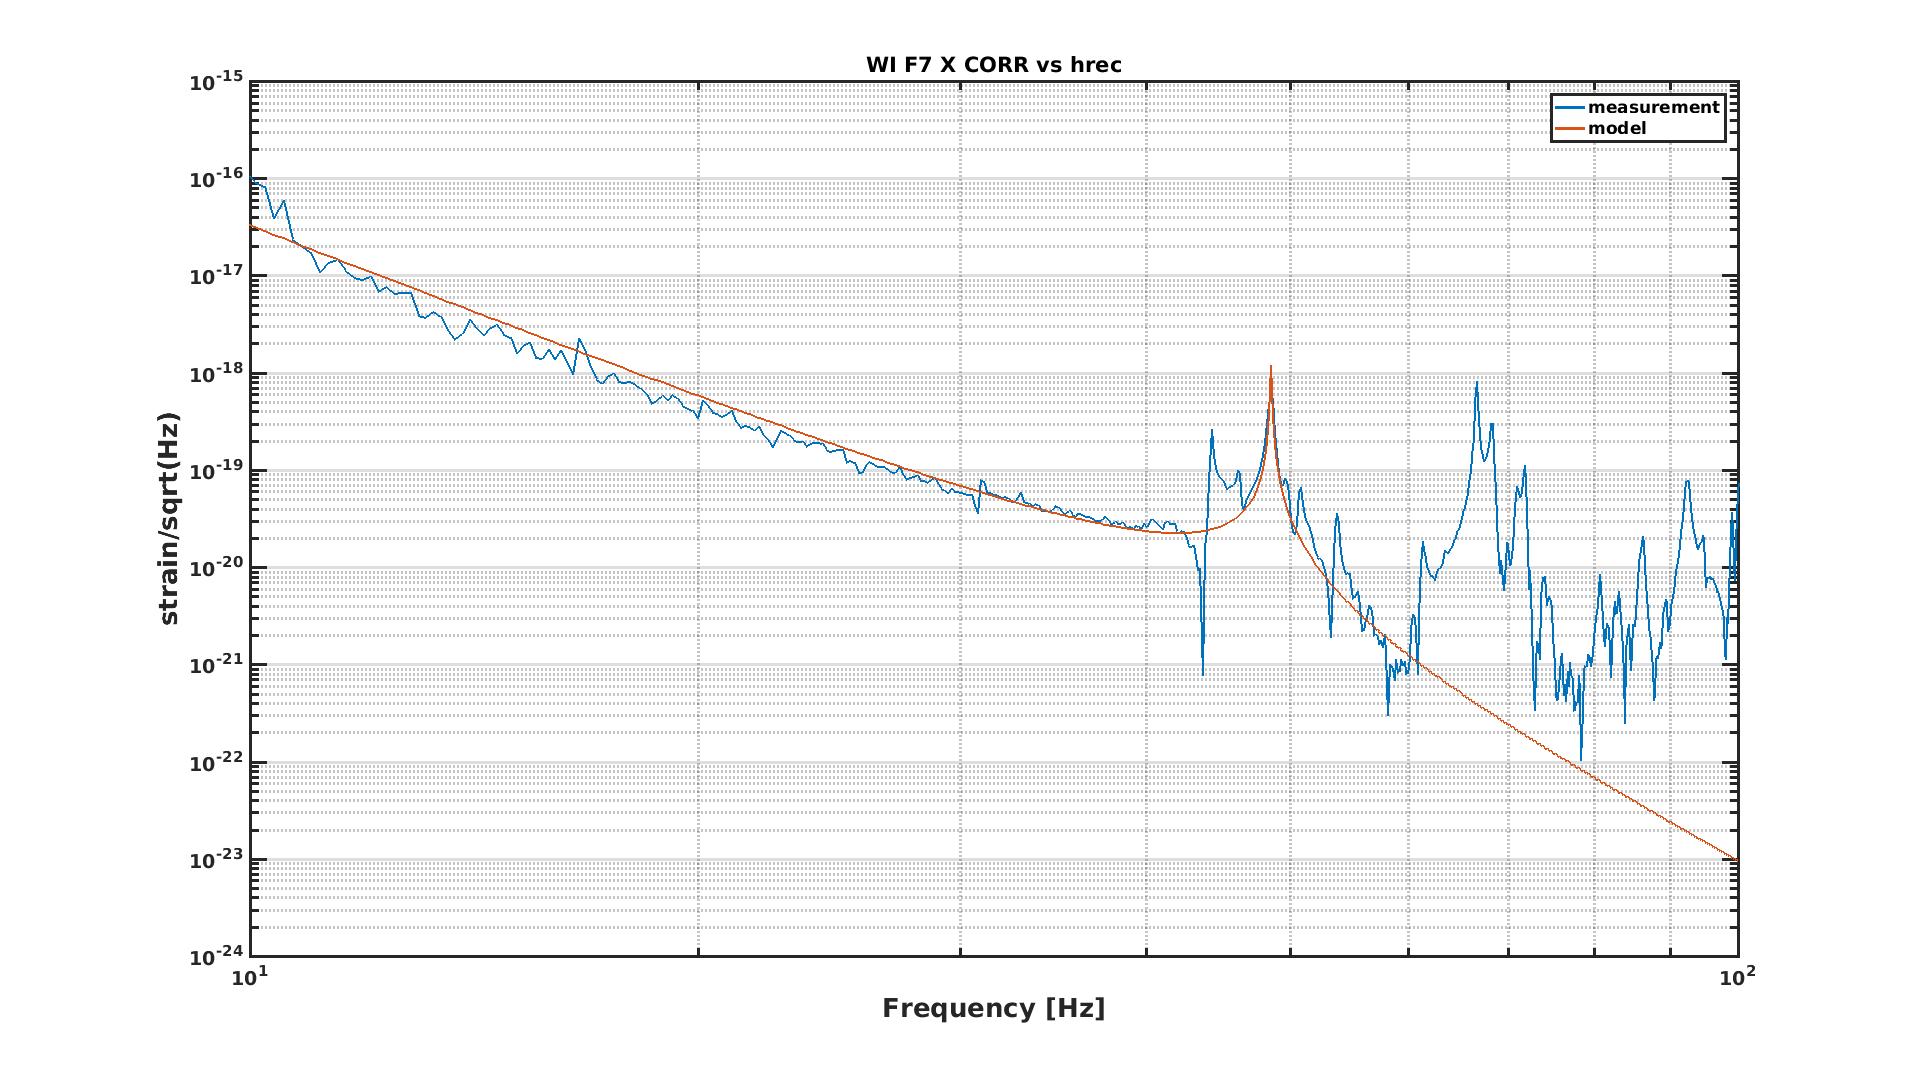
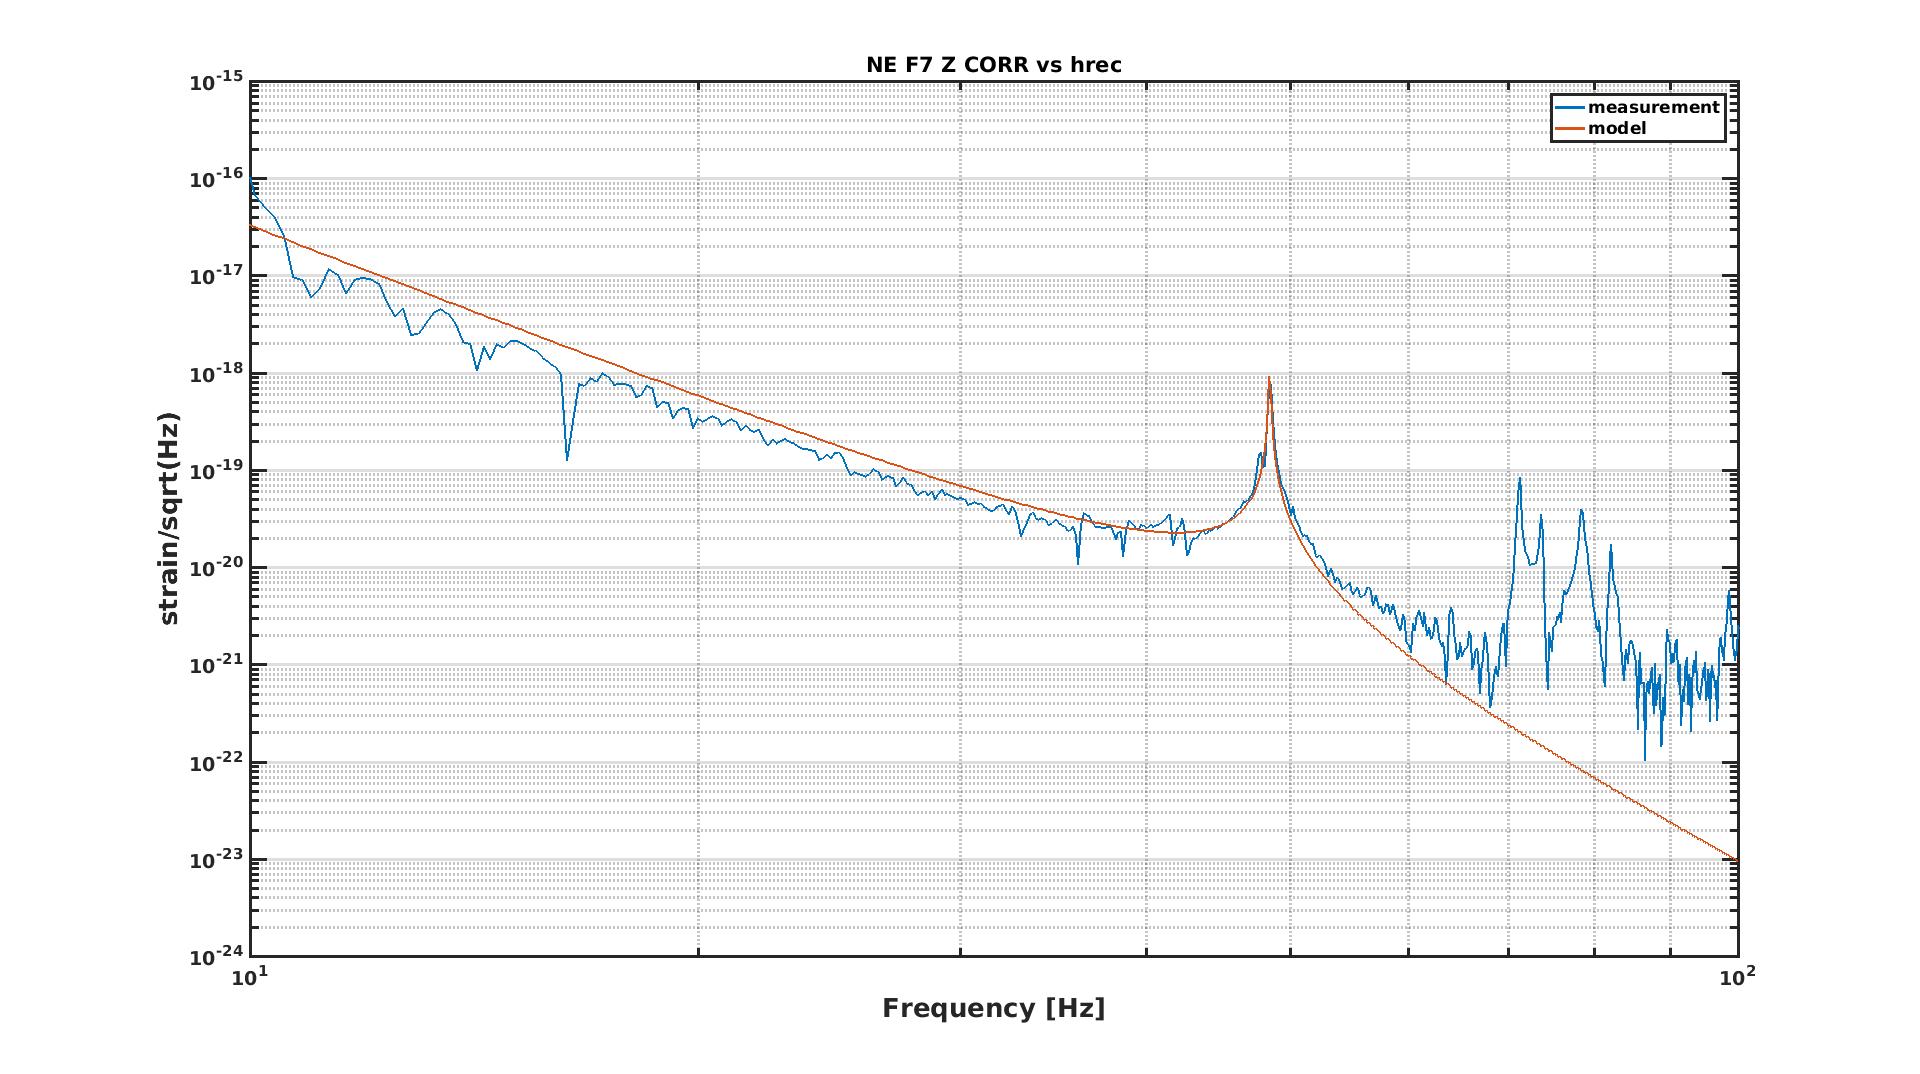
An alternative possibility is that the resonance belong to the F7 cage: the force on the marionette comes from F7 cage, and the vertical injection, weakly coupled to the sensitivity through the marionette, could find an easier path exciting a resonance of F7 cage or crossbar.

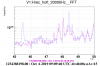
A campaign of noise injection on F7 from the ground actuators has been started, and the first results seem to confirm that hypothesys. A second log-entry will follow.

Images attached to this report
Comments to this report:
ruggi - 15:18 Tuesday 08 October 2019 (47146) Print this report

Broadband noise injections on the four FP suspensions have been performed, along longitudinal and pitch d.o.f.. The transfer functions towards hrec are the expected ones (up to 60 Hz), if the horizontal resonance of F7 crossbar is added to the simplest model (just the double pendulum marionette-mirror). The frequency of the modes has not been calculated; in the attached figures the models have been adapted to the measurement in order to match the peaks. The guess that the peaks are due to the crossbar resonance has to been confirmed, but at least it produces the correct shape of the tf.

All the peaks are present in hrec in clean condition. The most famous is 48.05 Hz (due to WE, as already known), but also the others are there. The presence of the peaks in the sensitivity is not explained by the simple noise projections of the actuation or control noise, through the measured tf: the input noise is to low. In the last attached plot the projection is forced to match the sensitivity putting an enhanced value as input of the tf.

Above 60 Hz the shape of the tf is not explained at all. It looks really to high, especially for the INPUT susp. It seems to suggest a possible direct coupling from F7 cage to the mirror, bypassing the double pendulum.

A complete and precise projection of F7 residual motion into the sensitivity cannot be easily done at the moment: some of the high frequency structures could stay above the safety margin foreseen by the requirement.

Images attached to this comment
Tringali, Fiori - 18:39 Tuesday 08 October 2019 (47153) Print this report

During the acoustic injections at NE building  (#47122), we notice the peak at ~ 48.45 Hz excited a bit  Figure 1 and Figure 2.


Images attached to this comment
Tringali, Fiori - 11:55 Wednesday 09 October 2019 (47164) Print this report

As reported in Figure 1, we observe an excitation of peak at ~ 48.1 Hz during the injection acoustic at WE building (#46708), as well.

Images attached to this comment
fiori, tringali - 13:45 Wednesday 09 October 2019 (47166) Print this report

We had a look to the evolution of rms around the 48Hz peak (47.9Hz to 48.2Hz) all along O3: it is the green colored line in the attached figures. we used Didier's script that reads from archived VIM spectrograms, see 46410.

A few times the amplitude of the peak changed up or down by a factor 2 or 3 or 4, here are the times of these occurences:

  • june 16 (SUNDAY) btw the lock ending at about 7:30 UTC and the lock starting at about 9:30 UTC (line went UP by a factor ~3)
  • june 23 (SUNDAY) btw lock ending at about 8:30 UTC the lock starting at about 10:30 UTC (line went DOWN by a factor ~2)
  • june 25 (TUESDAY) across the maintenance (line went UP by a factor ~2)
  • july 30 (TUESDAY) across the maintenance (line went DOWN by a factor ~2)
  • august 20 (TUESDAY) across the maintenance (line went UP by a factor ~2)
  • august 25 (SUNDAY) around 10 UTC the line excited and then reduced by a factor ~4 (this is the event noted by PAOLO in 46854)
  • september 3 (TUESDAY) across the maintenance (line went UP by a factor ~3)

the line's amplitude seems more or less stable since then ... (Figure 3)

Images attached to this comment
Search Help
×

Warning

Error

The present report has been modified outside this window. Please check for its integrity in the main page.

Refreshing this page will move this report into drafts.

×