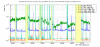
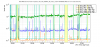
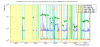
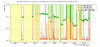
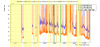
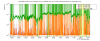
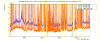
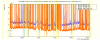
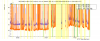
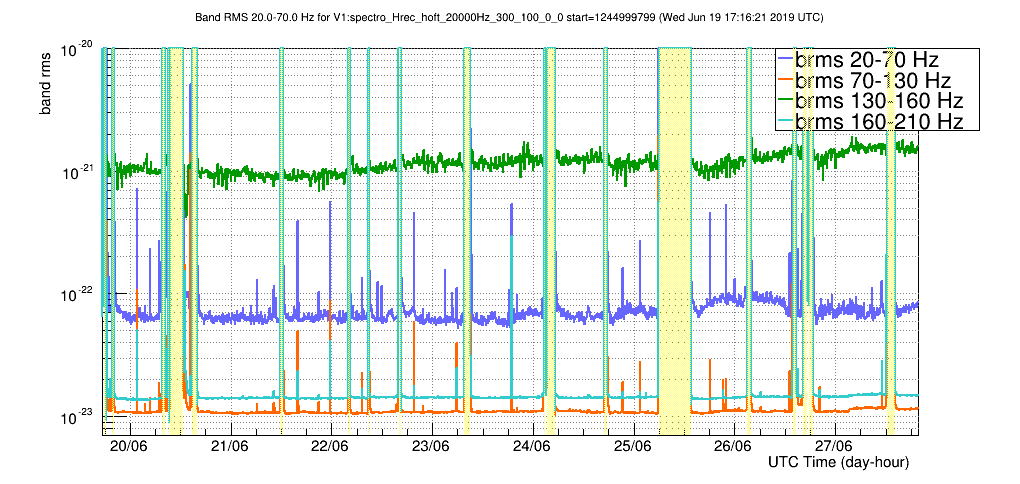
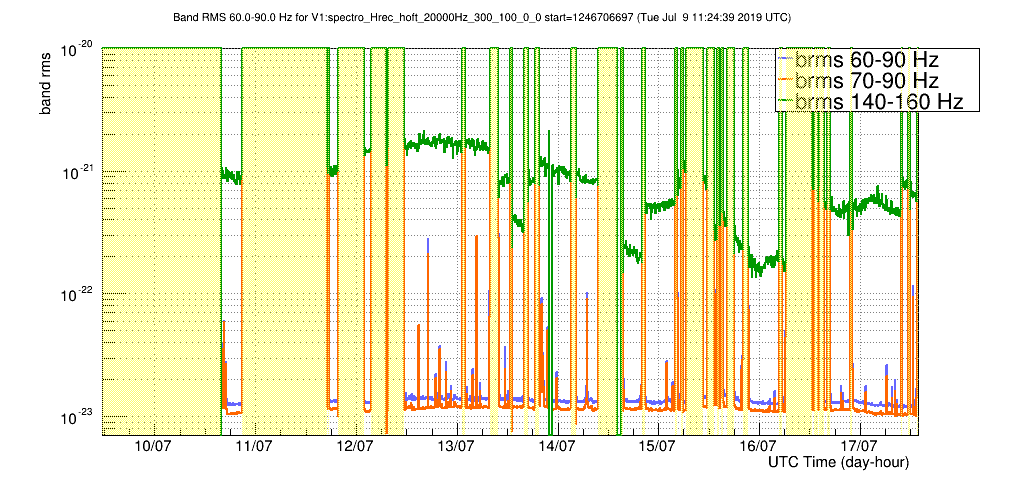
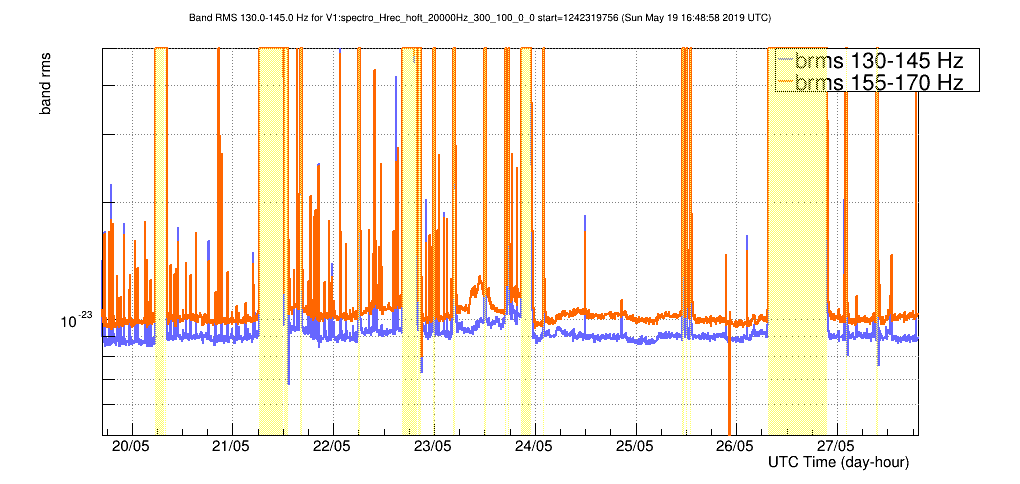
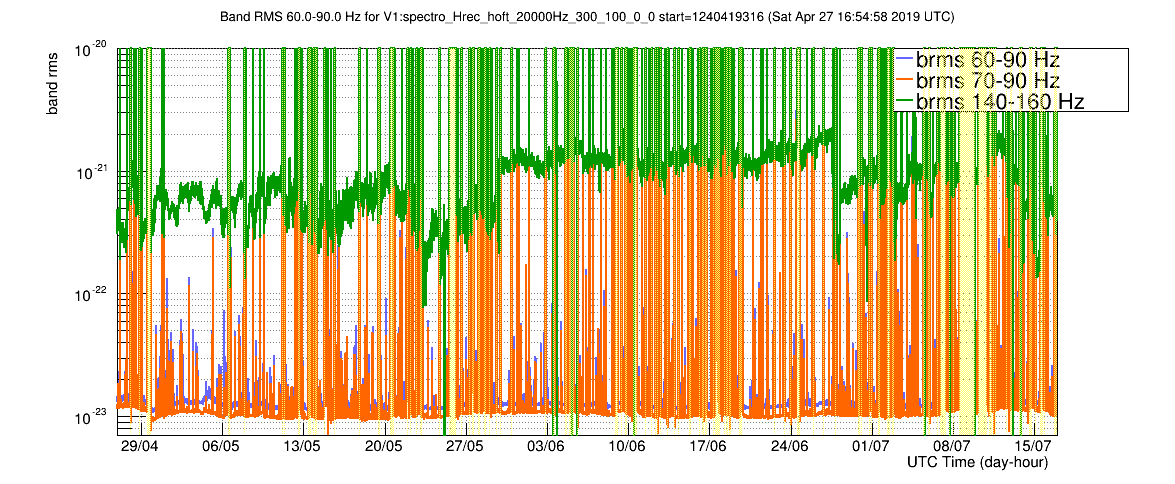
Using the band rms, I looked at the noise level in h(t) in the following frequency bands: 20-70 Hz, 70-130 Hz, 130-160 Hz, 160-210 Hz over one week in May (plot1), in June (plot2) and in July (plot3).
The band rms covering the high 150 Hz peak (130-160 Hz) can vary by almost a factor 10; it was high in June and its current level is still about 3 times higher than its minimal value in May.
The band rms for 70-130 Hz is currently a bit higher than its value in June and May and is quite stationnary.
The band rms for 20-70 Hz is quite stationnary but with some local factor 2 increases (see for instance around 26th of June) maybe due to bad weather.
The band rms for 160-210 Hz is also stationnary and at a level a bit higher than the 70-130 Hz band rms.
The spikes in the plots are large frequency band glitches that, each time, cover more or less the frequency bands of the bandrms computation.
The commands used to do those plots are:
/opt/w3/vim/spectro/spectro_brms.C\(\"Hrec_hoft_20000Hz\",1242320000,700000,\"20-70\;70-130\;130-160\;160-210\",7e-24,1e-20\)
/opt/w3/vim/spectro/spectro_brms.C\(\"Hrec_hoft_20000Hz\",1245000000,700000,\"20-70\;70-130\;130-160\;160-210\",7e-24,1e-20\)
/opt/w3/vim/spectro/spectro_brms.C\(\"Hrec_hoft_20000Hz\",0,700000,\"20-70\;70-130\;130-160\;160-210\",7e-24,1e-20\)
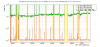
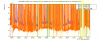
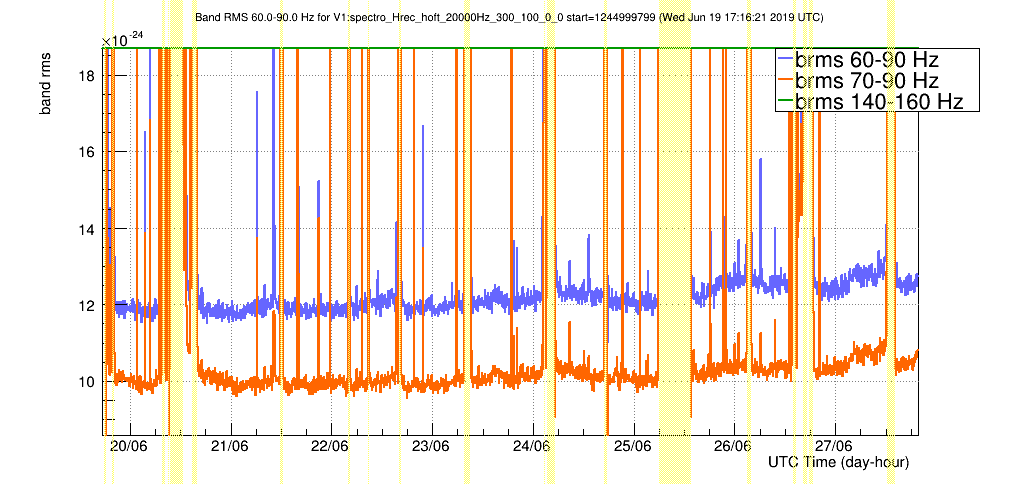
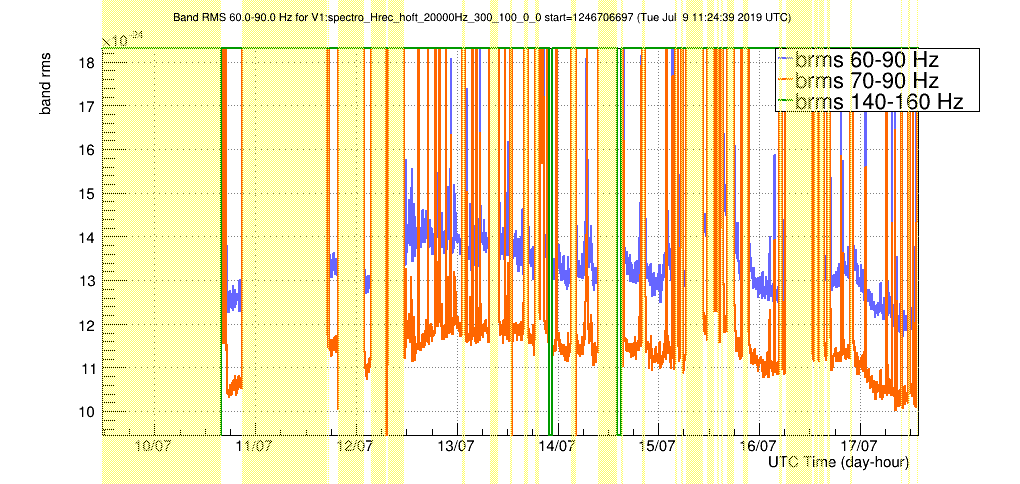
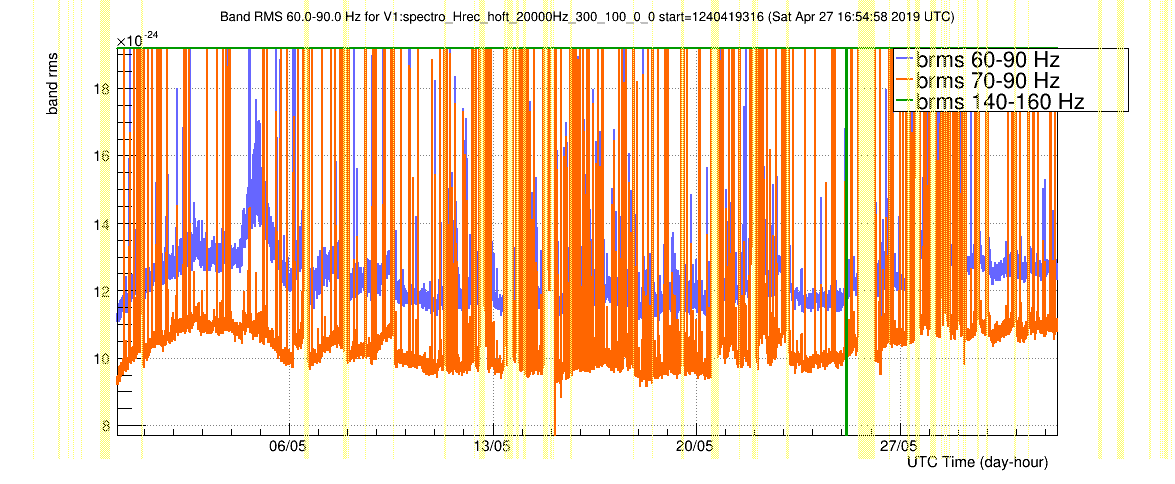
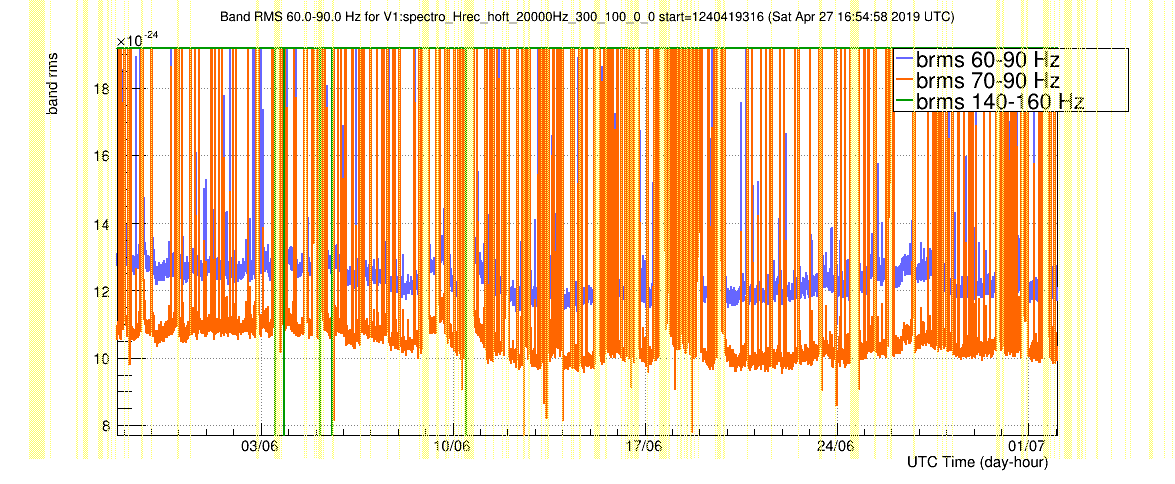
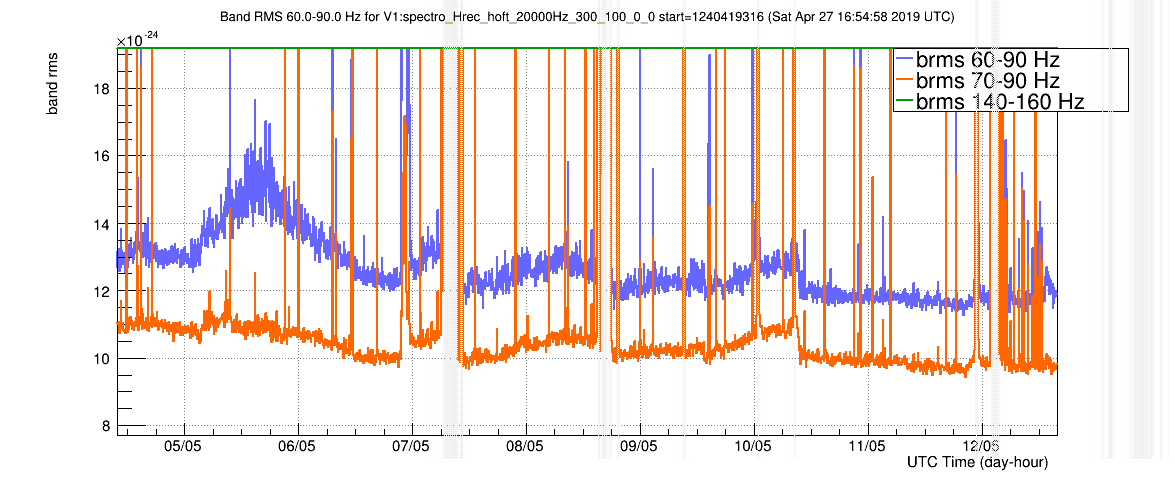
I add plot4 and plot5 to add some info after Michal elog 46408.
They show the band rms in 60-90 Hz and 70-90 Hz bands over one week in June and in July.


