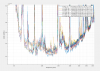
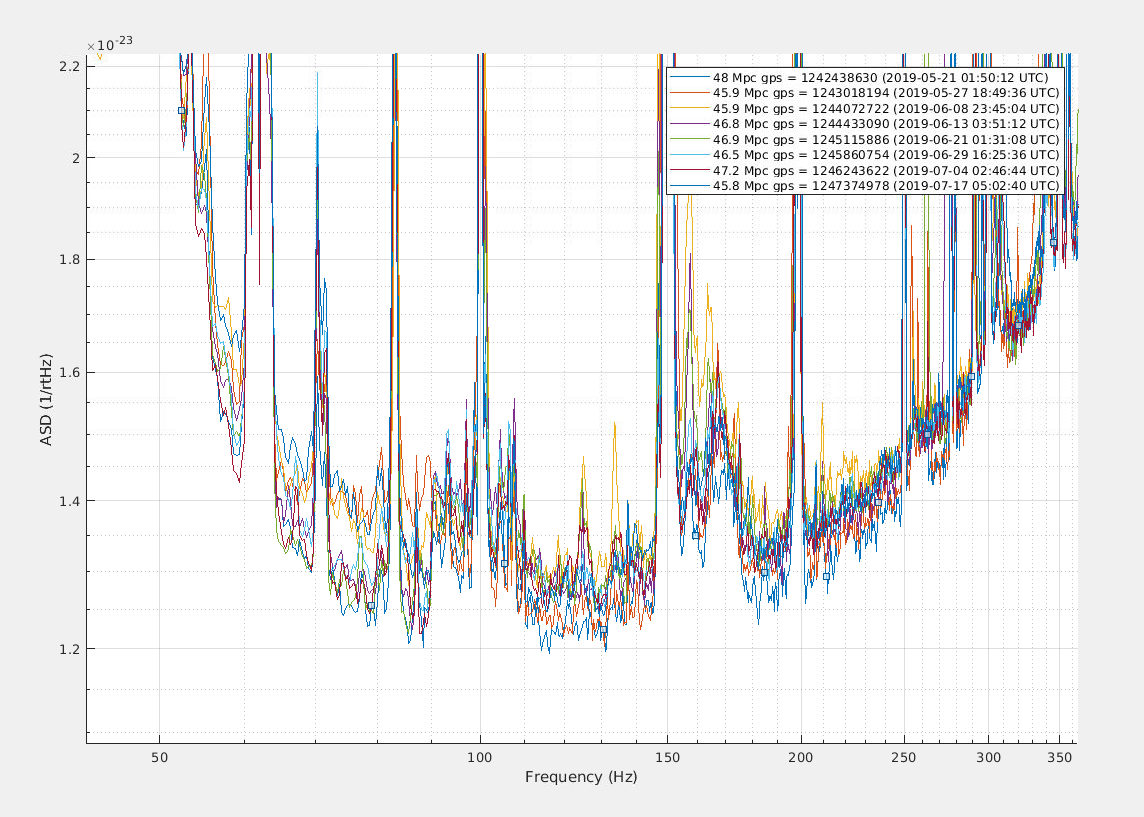
The noise at 60-90Hz is larger than before, this has happened before at end of May-beginning of june
Figure 1 is done by a script that for each week find the hour with the best range, and then plots the h(t) spectrum for that hour. The excess noise is visible for 3 curves, end of May, beginning of June and today. It would be interesting to track more precisely the noise level at 60-90Hz over the past few month and try to find the origin.
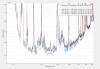
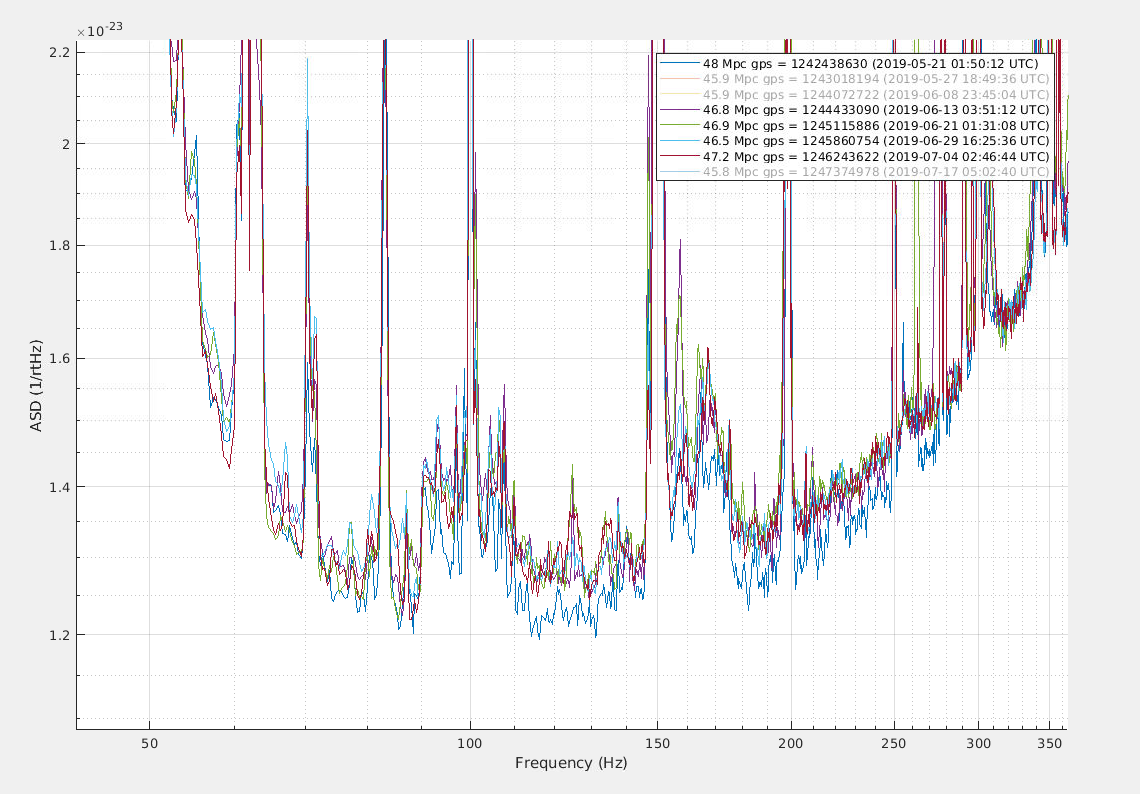
Figure 2 is the same as figure 1, but with the 3 curves with excess noise removed so it easy to indentify the data GPS/UTC times from the legend.