Reports 1-1 of 1 Clear search Modify search
Optical characterization (Optical characterization)
Allocca, chiummo, Ruggi - 16:00 Wednesday 04 July 2018 (42058) Print this report
Where is the power lost?

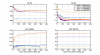
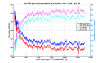
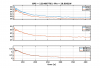
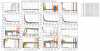
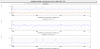
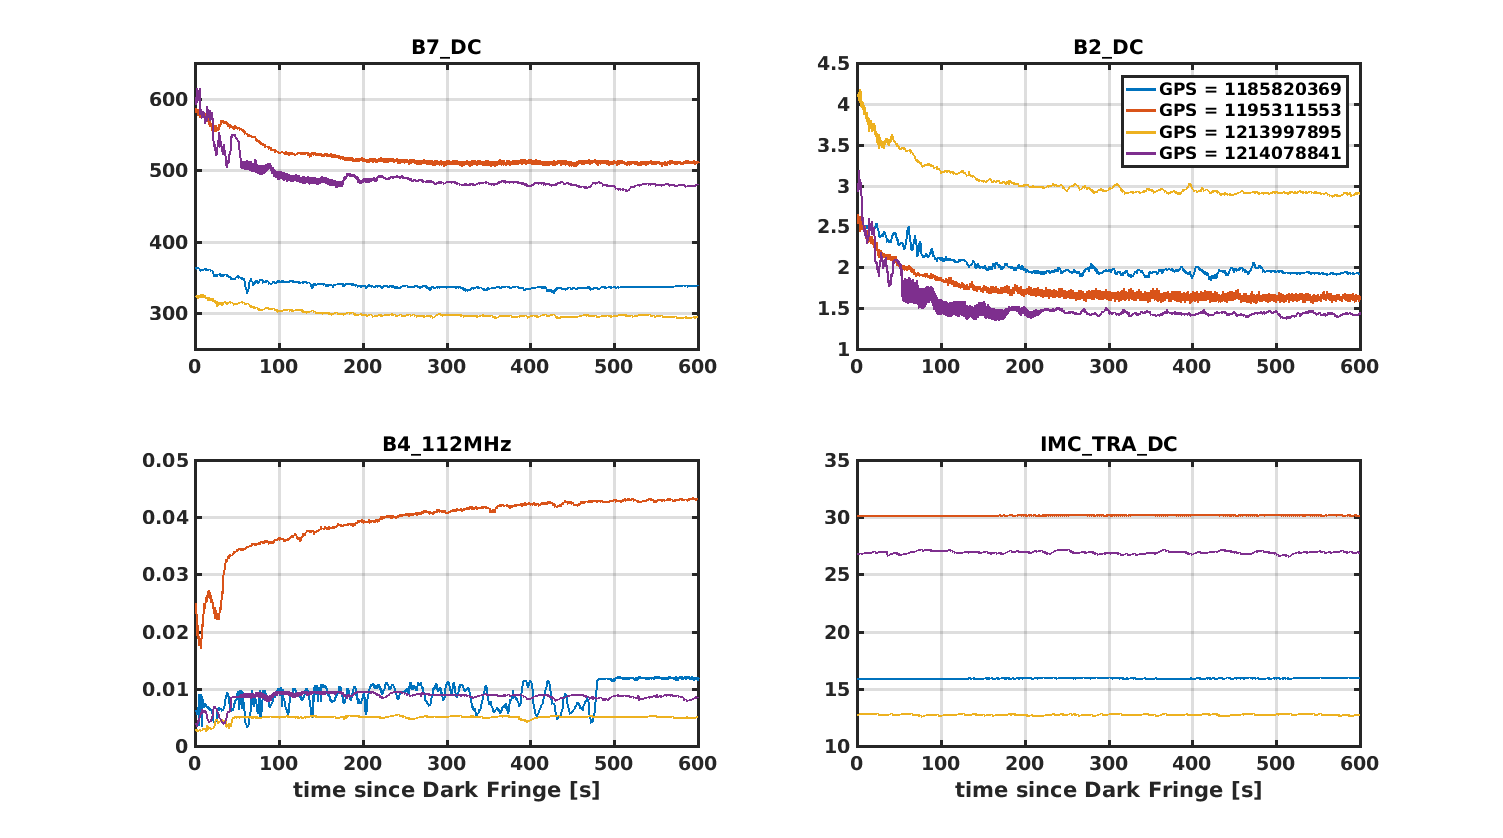
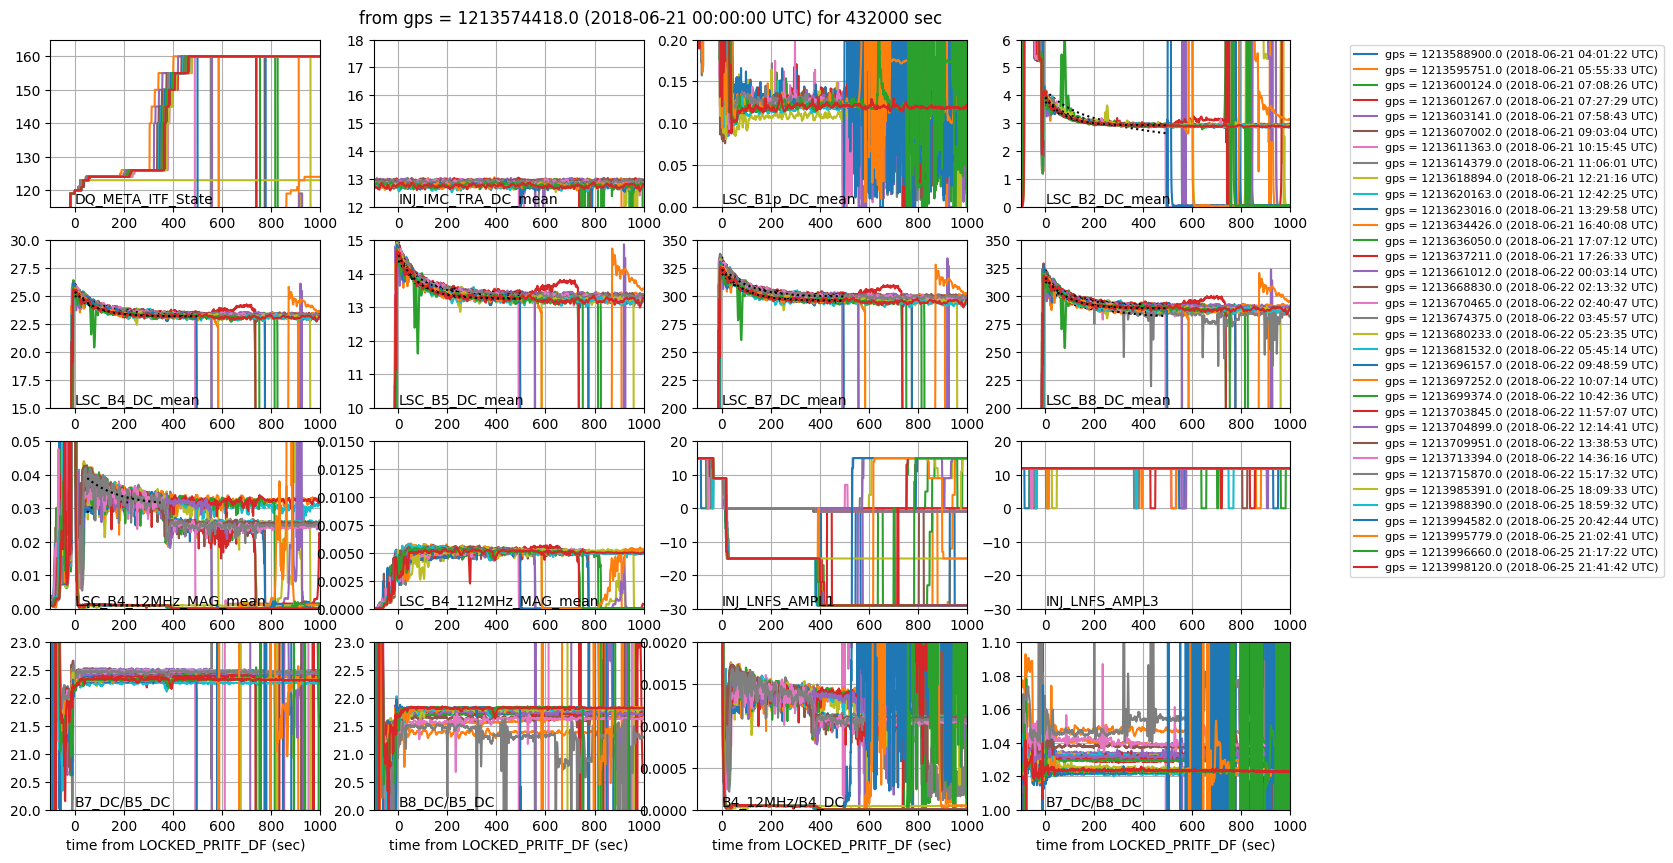
Since the very beginning of our journey with AdV @ DF, a peculiar behavior can be noticed in the power evolution during the lock acquisition. Just after  we reach the dark fringe, the power as seen by the end PDs (B7, B8) begins to drop. This was true during O2, when we increased the power back in Nov 17, after the recovery from the monolithic installation and now with the increased input power. See first figure with some randomly picked transmitted-power evolution right after DF related to the aforementioned periods.

This does not seem to be related to some decrease of coupled input power (aka mismatch), since the backreflection off the PR (monitored by B2) does not increase. On the contrary, it decreases with similar trend as for B7 (top-right plot in the first figure), pointing to increasing losses in the ITF.

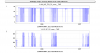
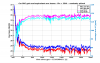
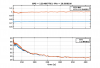
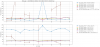
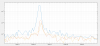
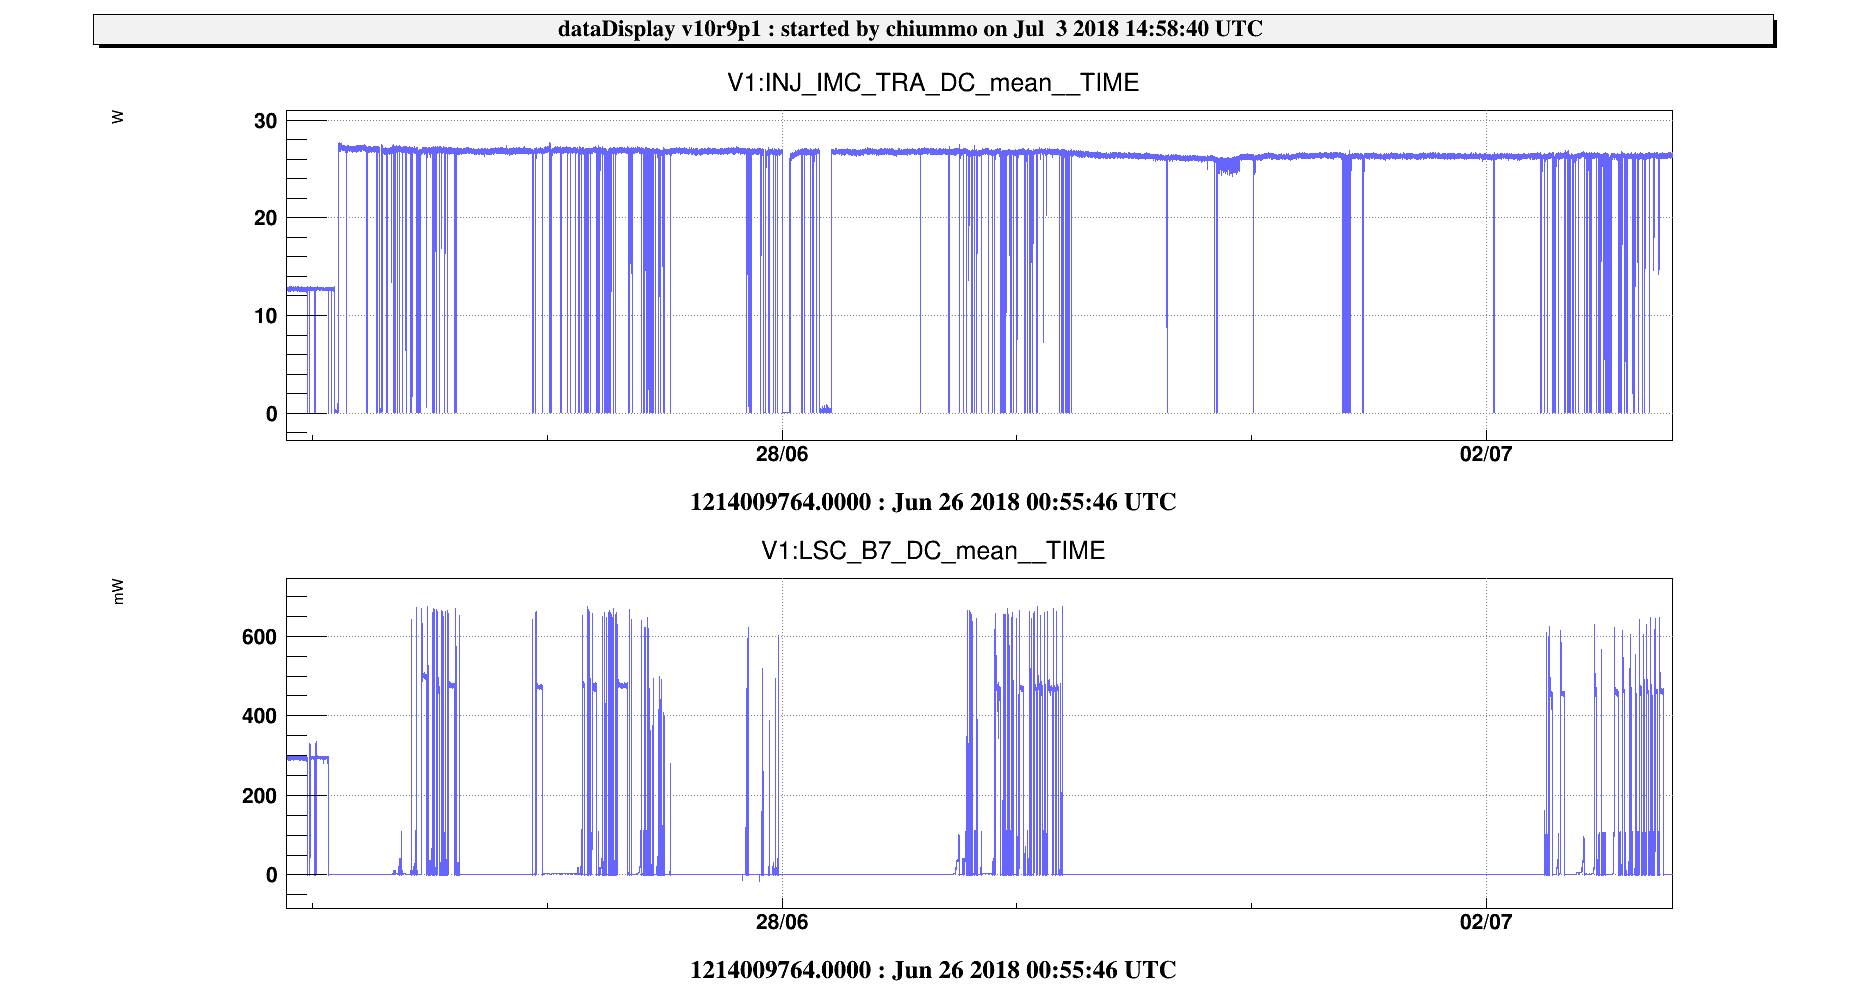
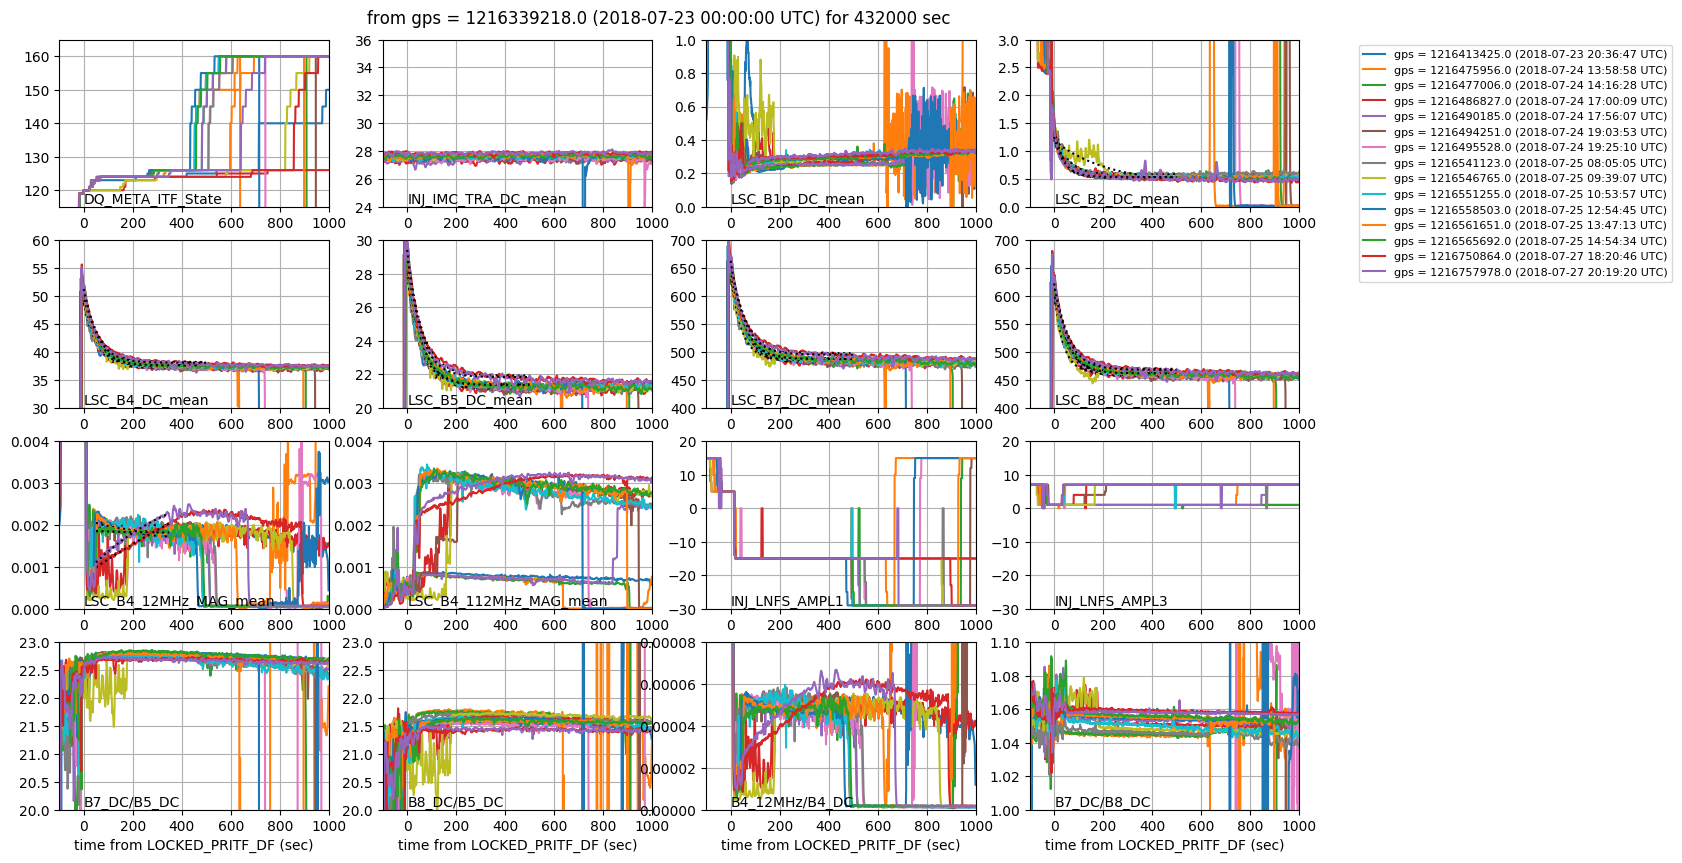
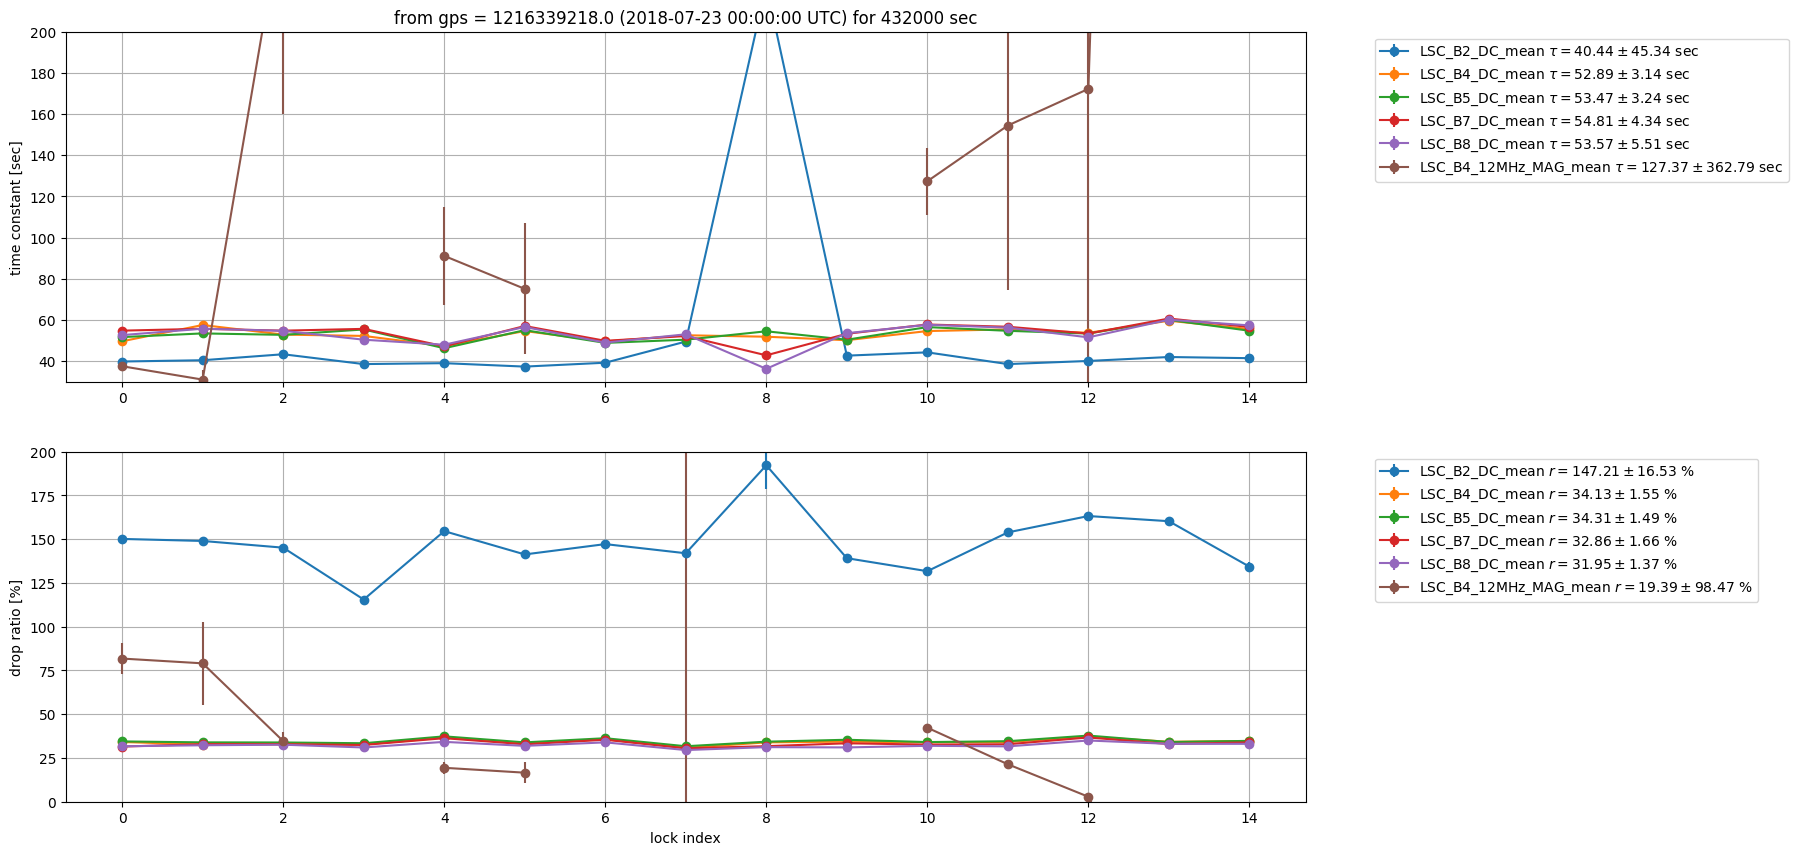
Triggered by Paolo persistent questions, we had a look at the trend since the recent increase of power (see figure 2). Paolo's sharp eye immediately noticed two things: 1) the usual drop of power is increased, and 2) the final power shows an slow decreasing trend.

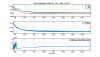
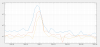
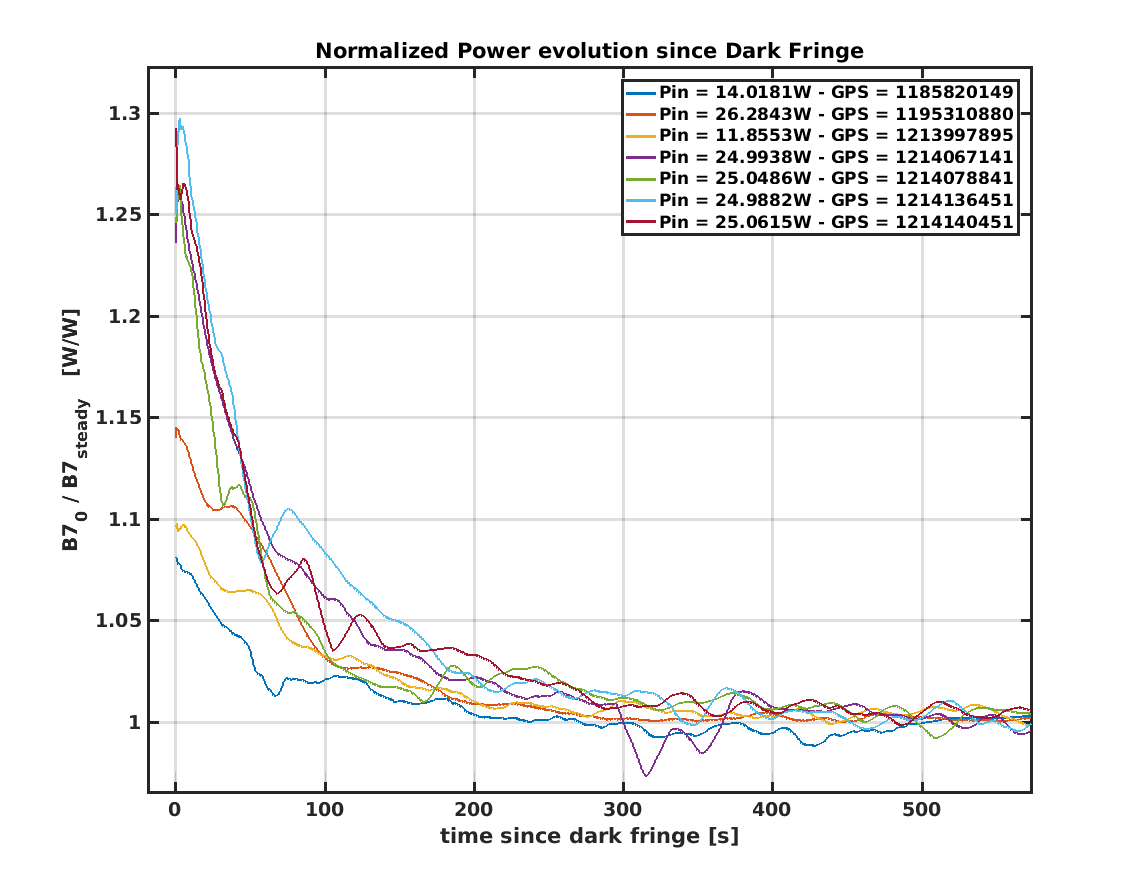
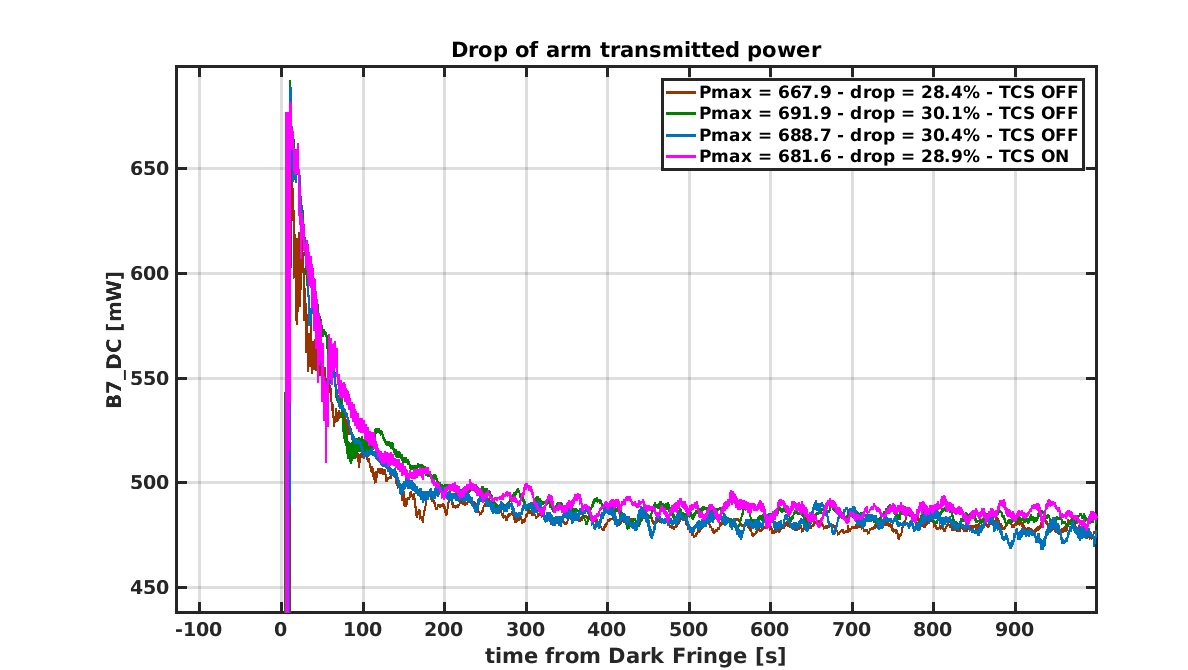
Actually, 1) is definitely true. Figure 3 shows B7 power evolution after reaching the DF, normalized to its steady state.
We lose now 25-30% of power wrt the start of the lock, it was <15% back in November with similar input power, while it used to be around 7-10% with low power both during O2 and now.

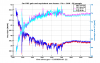
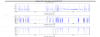
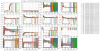
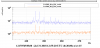
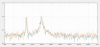
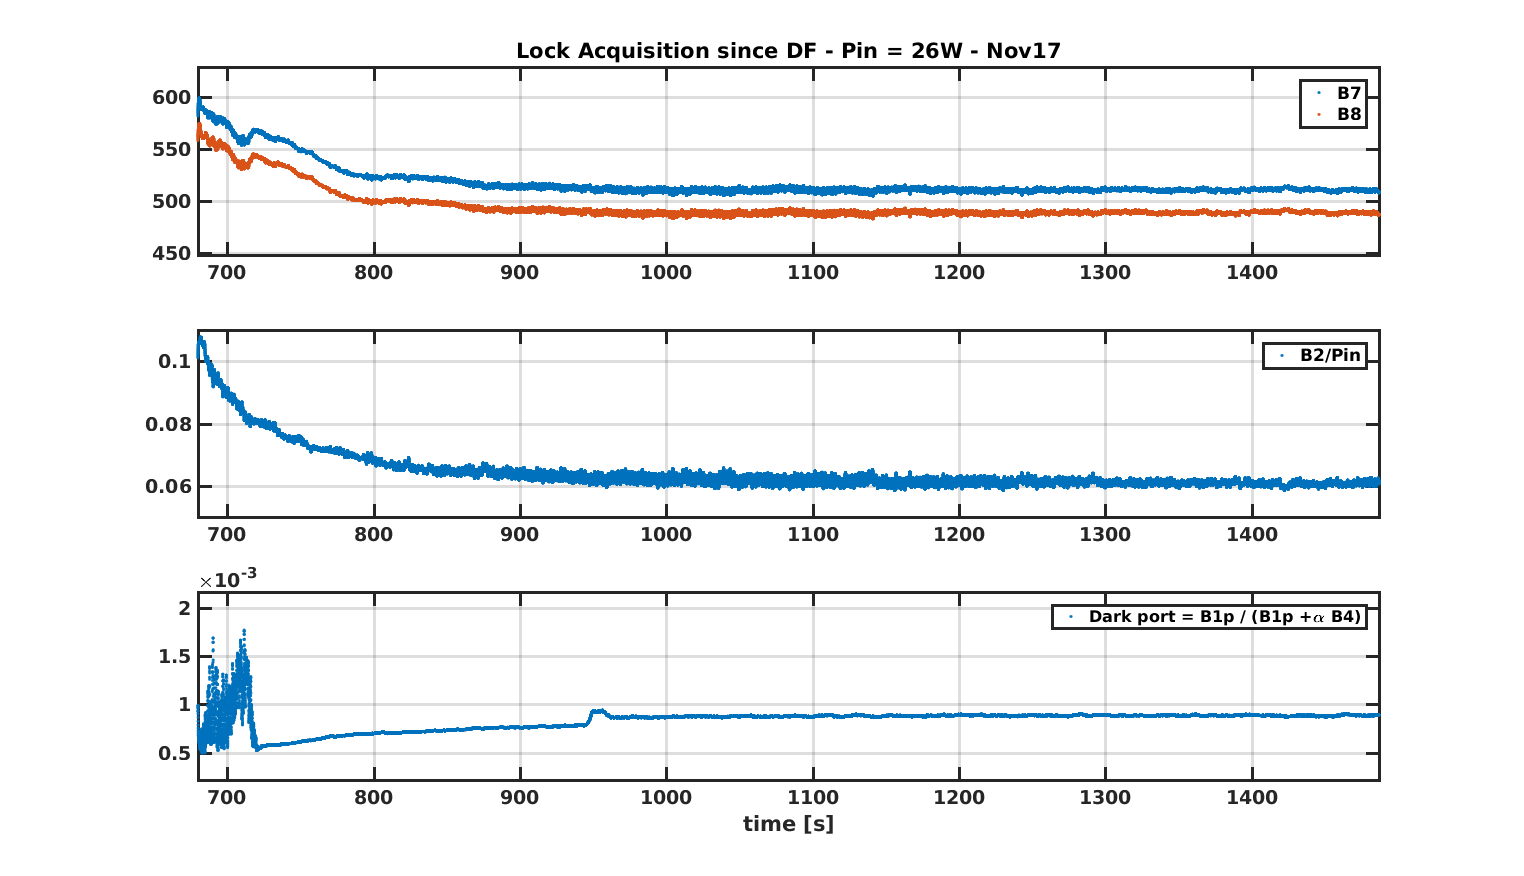
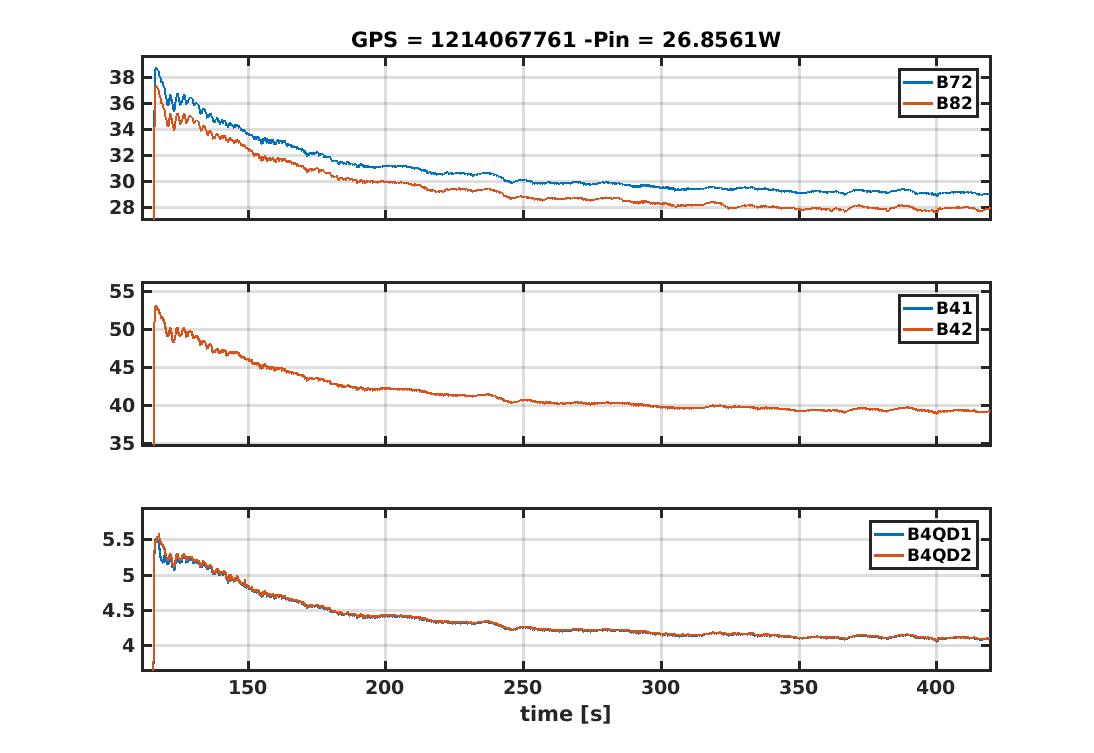
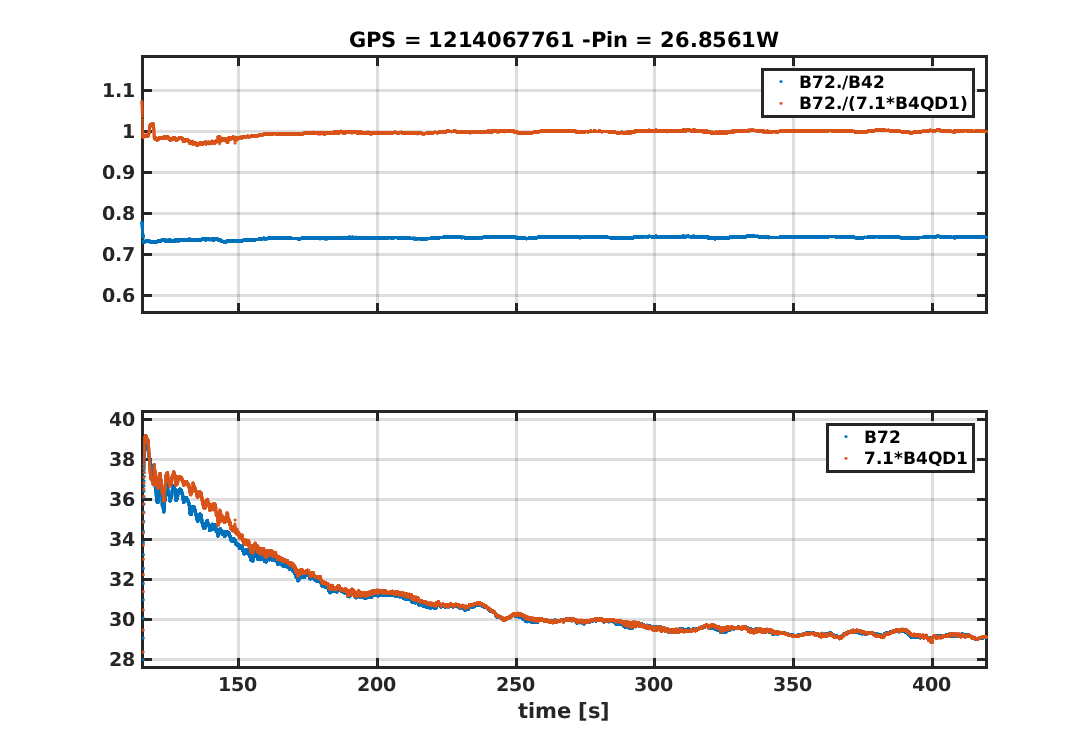
So, since this light is not back-reflected off the ITF, where does it go? One possibility is of course some increased leak trough the dark port. In figure 4 we reported a typical evolution of powers just after reaching the DF. Indeed there is some increase of the fraction of transmitted power to the dark port. But it is not enough, as we show below.

Actually, we computed the carrier recycling gain in the PRC, as seen in trasmission from the arm cavities.
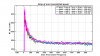
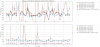
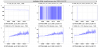
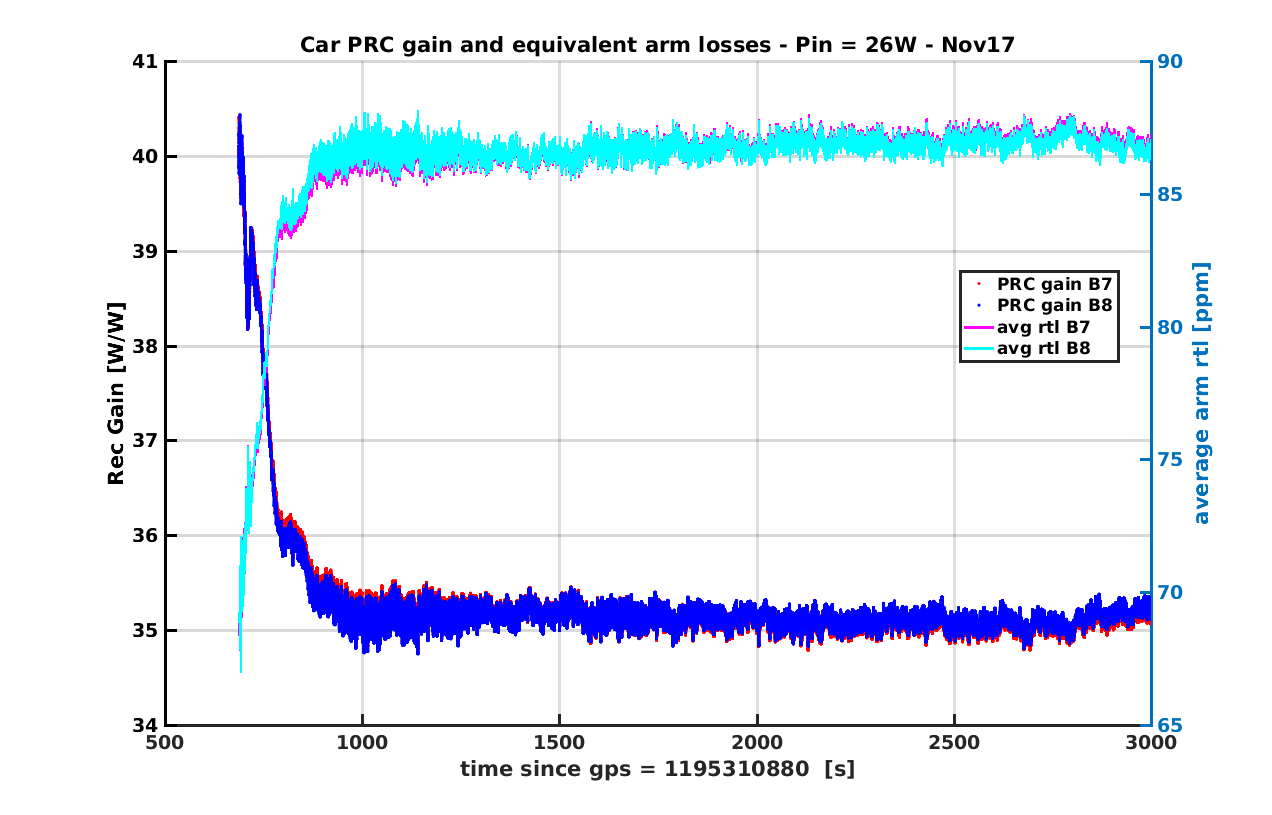
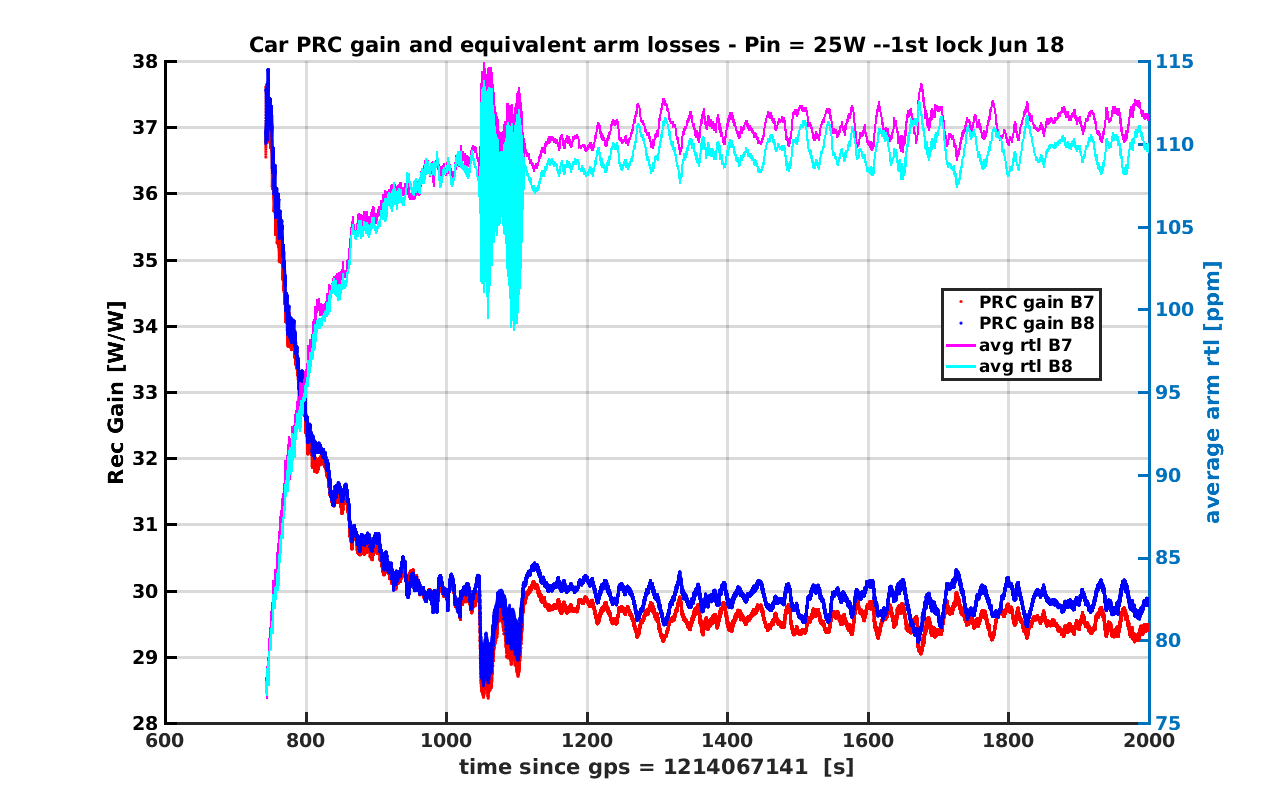
Figures 5-9 show the evolution of the carrier recycling gain just after reaching the dark fringe (left y-axis). On the same figures, we plotted the equivalent average losses in the arms needed to match the observed gain, as if no losses other than the dark port transmission were in the CITF (right y-axis).
The fact that we need to add increasing equivalent arm losses to match the rec gain means that this drop of power cannot be completely explained by the evolution of the dark port transmission.
Something else is going on there.

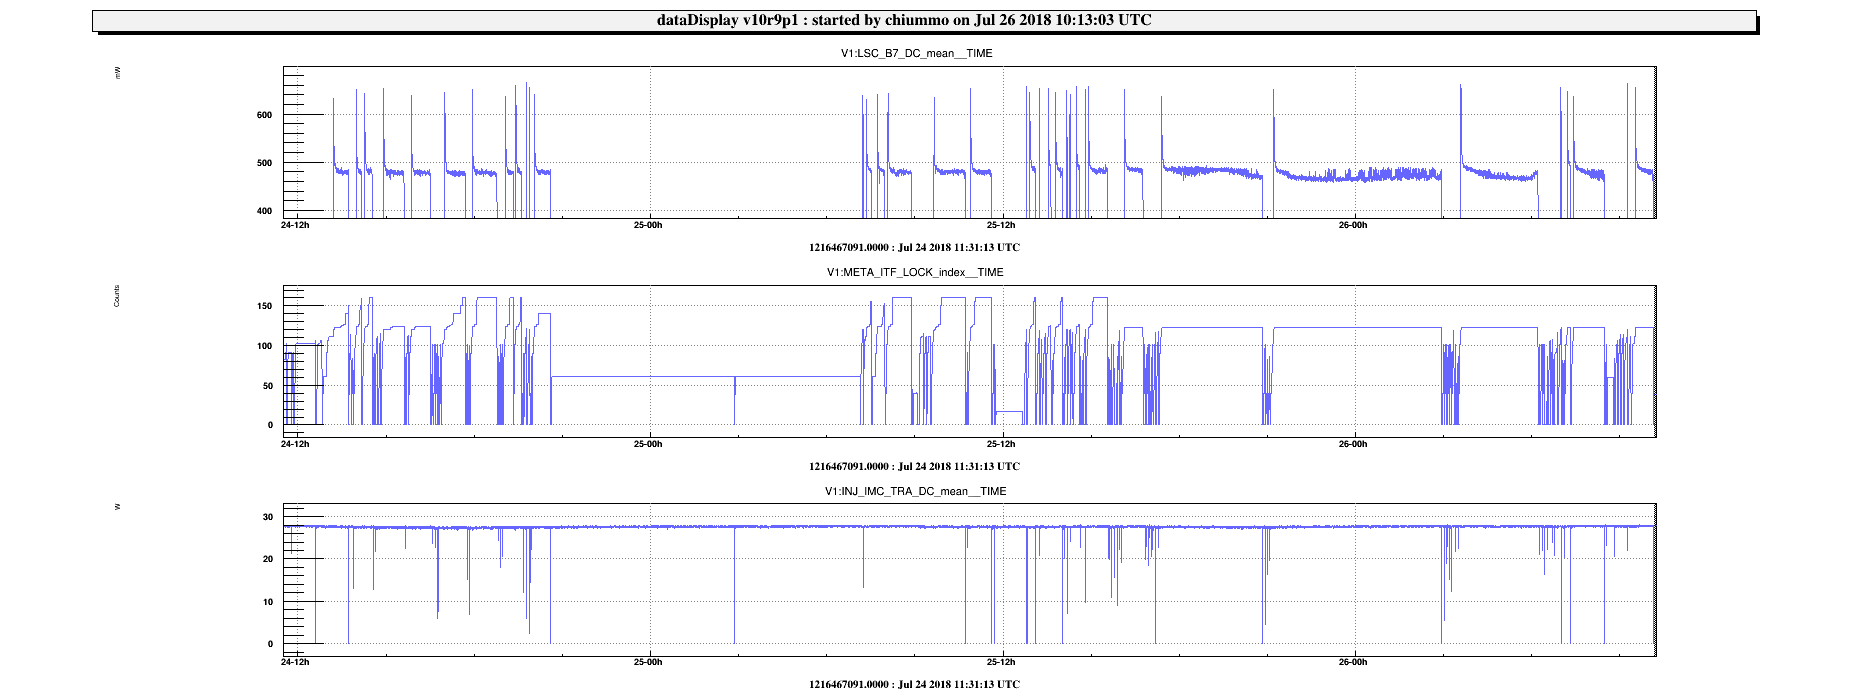
Why do we chose to introduce only additional equivalent arm losses and not, e.g., some change in the losse of CITF itself? The reason is a pure speculation: from picture 1, the drop of carrier power is present also when the sidebands (B4_112MHz) do not see big changes, so it seems more likely (?) that it is linked to something occurring in the arms, that are not probed by the sidebands.

Details:

Fig.5: random lock during O2. Car rec gain in the PRC starts from 42.5 (-> needed arm rtl = 65ppm) and drops to 39.5 (-> needed arm rtl = 74ppm).

Fig. 6: Power increase during Nov. 17. Car rec gain in the PRC starts from 40.5 (-> needed arm rtl = 67ppm) and drops to 35 (-> needed arm rtl = 86ppm).

Fig. 7: After monolithic susp installation, just before increasing the power, Jun 18. Car rec gain in the PRC starts from 40 (-> needed arm rtl = 70ppm) and drops to 36 (-> needed arm rtl = 84ppm). To be compared with fig.5.

Fig. 8: First lock after rising the input power, Jun 18. Car rec gain in the PRC starts from 38 (-> needed arm rtl = 76ppm) and drops to 30 (-> needed arm rtl = 110ppm). To be compared with fig.6.

Fig. 9: Randomly picked one of the few locks @DF, Jul 18. Car rec gain in the PRC starts from 37 (-> needed arm rtl = 78ppm) and drops to 28.5 (-> needed arm rtl = 115ppm). To be compared with fig.8.


Conclusion:

(1) A slow (~minutes) transient after reaching the dark fringe makes the arm transmitted powers to drop. The drop is not explained by either an increased mismatch of input beam (B2 is dropping as well) or increased transmission of the dark port (not enough to explain the whole decrease). The drop is larger when the input power is larger. Furthermore, this has slightly worsened over the past year.

(2) A possible interpretation is that the YAG power heats up the test masses and slightly changes the RoCs. This could bring some HOMs closer to resonance in the arm cavities (see for instance VIR-0423A-18) and, in turn, increase the rtl. The fact that a very slow trend is overimposed to this behavior is a bit worrying and could point to some slightly increasing absorption in the mirrors, making the process more effective. Of course this is a simple speculation to be further tested and investigated.


Images attached to this report
Comments to this report:
Casanueva, chiummo - 17:03 Wednesday 04 July 2018 (42067) Print this report

Some contadictory results about the sidebands showing the same trend are reported in 42011. To be further investigated.

chiummo - 17:21 Thursday 26 July 2018 (42225) Print this report

Since yesterday some CO2 thermal compensation has been used on the interferometer, this seems at least to have improved the lock segment locks (see first plot). While the TCS team is tuning the working point, it seems also that the usual drop of arm transmitted power is not affected by the TCS actuation (see second plot: randomly picked lock segments with and without TCS actuation).

Images attached to this comment
Allocca, chiummo, Michimura - 12:24 Monday 30 July 2018 (42240) Print this report

Trying to dig further into the issue of power drop. One hypothesis was: is it possible that the power drop is fake and what actaully changes is the PDs response due to some heating? Unlikely.

Indeed, attached pictures show a lock acquisition just after the latest power increase

GPS = 1214067761; GPSdur = 7*60; % first lock acquisition after power increase 12W->25W Jun 26 2018

In this case, we plot the power recorded by two different kinds of sensors: photodiodes B7/8/4, and quadrants B4QD. You can see that the behavior is very similar and the ratio between the two kinds of sensors stays basically constant. So it seems we are dealing with something really happening.

Images attached to this comment
michimura, allocca, chiummo - 11:59 Wednesday 01 August 2018 (42272) Print this report

To have more statistics on this power drop at DF issue, I fitted the decay curves of photodiode signals.
In June, we had the time constant of ~90 sec, but from July, we have the different time constant of ~50 sec.
The power drop in June was ~10 %, and in June was ~30% (as already reported in logbook #42058).
Time constant being different adds another mystery.....


Method:
1. Get the data of META_ITF_State, B2_DC, B4_DC, B5_DC, B7_DC, B8_DC, B4_12MHz, and B4_112MHz. Extract the lock which reached Low Noise 3, and plotted the data from -100 sec to +1000sec from the point we reached LOCKED_PRITF_DF.

2. Fitted decay curves with a*exp(x/tau)+c for each lock. For DC signals, I used the data from LOCKED_PRITF_DF for 400 sec. For B4_12MHz, I used the data from 50 sec after LOCKED_PRITF_DF for 300 sec since it fluctuates too much at the beginning of DF.

3. Plotted tau and the power drop ratio r=a/c for each lock, and calculated the median (not average since B4_12MHz fluctuates a lot and fitting is not reliable in many cases) and standard deviation.


Result:
The time series data of 34 locks between June 21 to 25 is shown in DFpowerdrop_LOCKED_PRITF_DF_1213574418_432000.png.
The time series data of 13 locks between June 23 to 27 is shown in DFpowerdrop_LOCKED_PRITF_DF_1213574418_432000.png.
Fitted curves are also plotted as dashed black lines. As you can see, the power drop is consistent between locks (semilar plot for B7_DC also in logbook #42225).
In June from June 21, 6 MHz was not decreased in DF (logbook #41932), so we can clearly see that B4 12 MHz also drops (as also reported in logbook #42011).
Note that B4 112 MHz do not decay at this time scale, but it also decays at longer the time constant of 1.5e3 sec (see logbook #41817).
In July, we decreased 6MHz in DF (logbook #42162), so it is hard to tell what's happening for 6 MHz sidebands.

Summary of fitting results are shown below.

From June 21 for 5 days, median of 34 locks (DFpowerdrop_LOCKED_PRITF_DF_1213574418_432000_fitresult.png)
LSC_B2_DC_mean tau=80.17 +/- 60.95 sec
LSC_B2_DC_mean r=35.02 +/- 6.75 %
LSC_B4_DC_mean tau=90.79 +/- 17.83 sec
LSC_B4_DC_mean r=9.79 +/- 0.99 %
LSC_B5_DC_mean tau=87.60 +/- 18.27 sec
LSC_B5_DC_mean r=9.95 +/- 0.90 %
LSC_B7_DC_mean tau=92.40 +/- 18.69 sec
LSC_B7_DC_mean r=9.69 +/- 0.89 %
LSC_B8_DC_mean tau=91.49 +/- 24.35 sec
LSC_B8_DC_mean r=9.48 +/- 0.97 %
LSC_B4_12MHz_MAG_mean tau=108.22 +/- 260.09 sec
LSC_B4_12MHz_MAG_mean r=39.68 +/- 152.40 %


From July for 5 days,  median of 13 locks (DFpowerdrop_LOCKED_PRITF_DF_1213574418_432000_fitresult.png)
LSC_B2_DC_mean tau=114.08 +/- 42.69 sec
LSC_B2_DC_mean r=24.61 +/- 6.15 %
LSC_B4_DC_mean tau=111.69 +/- 615.54 sec
LSC_B4_DC_mean r=7.28 +/- 4.59 %
LSC_B5_DC_mean tau=109.63 +/- 61.33 sec
LSC_B5_DC_mean r=7.45 +/- 2.11 %
LSC_B7_DC_mean tau=115.32 +/- 85.67 sec
LSC_B7_DC_mean r=6.73 +/- 2.53 %
LSC_B8_DC_mean tau=124.57 +/- 78.30 sec
LSC_B8_DC_mean r=7.10 +/- 2.42 %
LSC_B4_12MHz_MAG_mean tau=102.97 +/- 192.52 sec
LSC_B4_12MHz_MAG_mean r=33.93 +/- 106.92 %


As you can see, B4_DC, B5_DC, B7_DC and B8_DC have very similar time constants and power drop, which indicates power recycling gain decay, something in CITF. You can also see that B7_DC and B8_DC divided by B5_DC stays roughly constant from the time series plot. This means that finnesse of the arms stay roughly constant.
The time constant in June was ~10%, but it increased to ~30% in July. More surprisingly, time constant in June was ~90 sec, but it changed to ~50 sec in July.
B2_DC has slightly different time constant, and have more power drop.
B4_12MHz fluctuates a lot, and it is hard to tell, but it has similar time constant (~100 sec) with B4_DC, and more drop (~30%) compared with B4_DC.

B4_12MHz decaying faster than B4_112MHz indicate some alignment drift or abbreation drift at O(100) sec time scale, since 6 MHz is more sensitive to these effects.


Next:
 - Try not decreasing 6 MHz as much to see the behaviour of 6 MHz in DF, if possible.
 - Look for the mirror temperature drift (but it might be hard since line tracker (logbook #41883) demodulates B1, not B1p; B1 is not available in LOCKED_PRITF_DF and B1p is noisier).

Images attached to this comment
mwas - 13:34 Wednesday 01 August 2018 (42273) Print this report
It should be possible to track the mirror temperature drifts from different lines using B1p_PD1 or B1s1_PD1.
By default the shutter of these PDs remain closed, but they could be opened just after reaching dark fringe.

Figure 1, shows a case where B1p_PD1 and B1s1_PD1 have been manually enabled 10 minutes after lock (from yesterday).
B1p_PD1 sees ~10 times more power than B1p_PD2, and B1s1_PD1 (reflection of first OMC) sees ~100 times more power than B1p_PD2.
B1s1_PD1 has a better SNR but is a bit more tricky to use. This would work only if OMC1 remains unlocked, and currently fluctuations at 1.7Hz and 3.2Hz are causing the PD audio channel to saturate frequently. So it is an option only if these large power fluctuations are not present.

Looking at B1p_PD1 some of the violin modes (figure 2) and drum modes (figure 3) are visible. A list of modes indentified by the line tracker are attached in this logbook entry.
For the drum modes, B1s1_PD1 has a better SNR (figure 4), but it comes with the caveats mentioned before.

In conclusion it would be good to add B1p_PD1 shutter opening to the automation when reaching dark fringe. And if the SNR is sufficient attempt tracking the loudest lines.
Images attached to this comment
mwas - 16:04 Friday 03 August 2018 (42314) Print this report
Since yesterday the B1p_PD1 shutter is opened systematically when reaching dark fringe.
As a simple check I have used 30min of data starting from Aug 03 2018 03:23:20 UTC to make spectra of SDB2_B1p_PD1_Blended, for [0 10] minutes [10 20] minutes, [20 30] minutes.

Figure 1, 2 and 3 show the 4 arm mirrors drum modes, they drift up in frequency by a few mHz over 30 minutes. Hopefully this can be used by the line tracker to study the mirrors temperature during the first 10 minutes of dark fringe before the two OMCs lock.
Images attached to this comment
michimura - 15:32 Monday 06 August 2018 (42348) Print this report

The line tracker code was temporarily modified to use SDB2_B1p_PD1_Blended instead of SDB2_B1_PD2_Audio_100k at 13:04 UTC today.

B1p is available even if OMCs are not locked, so hopefully we can monitor the mirror temperature transient when reaching the dark fringe and study the power drop at DF (see logbook #42273 and #42314).
B1p_PD1_Blended is 20kHz sampled, so I had to delete line tracker channels above 10 kHz.
Channels currently available are _FREQ and _AMPL of

V1:PAY_{MIR}_VIOLIN# (MIR=NE,NI,WE,WI, #=1-8)
V1:PAY_BS_BUTTERFLY
V1:PAY_BS_DRUM

V1:PAY_DRUM# (#=1-4; 1 is for NI and 2 is for WI according to VIR-0505A-18)
V1:PAY_9pt6kHz# (#=1-8)

The original B1 version (see logbook #41883) is committed to SVN at revision 74203 and B1p version is committed to SVN at revision 74204.
They are also copied as algo_B1.py and algo_B1p.py in /virgoDev/Automation/PyALP/PySpectral directory for easy swap.

Search Help
×

Warning

×