Loking at the data from last Friday I have noticed some interesting things form the behaviour of the 6MHz.
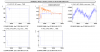
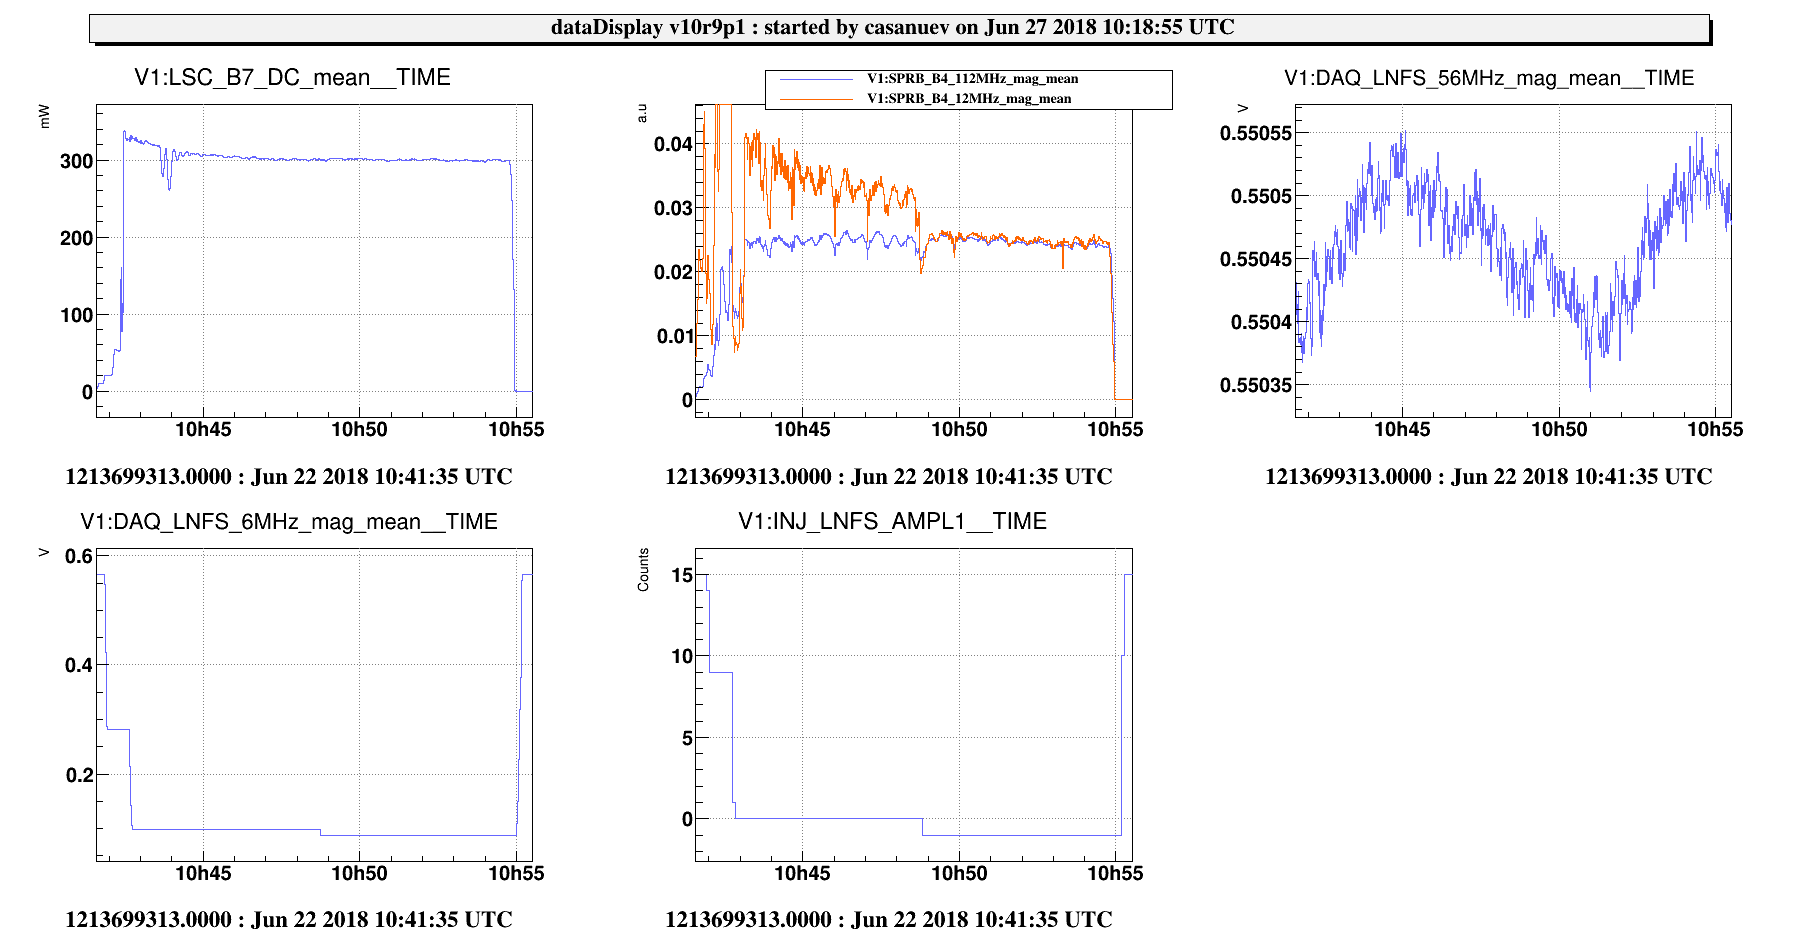
- Figure 1 shows the behaviour of the carrier (B7 DC) the 6MHz (12MHz) and the 56MHz (112MHz) while reaching DF and after. Notice that I have re-scaled the 112MHz by a factor 4.5 to match both curves (112/12). An interesting fact is that the decreasing trend that can be seen on the DC power matches the trend on the 6MHz, but which is not seen on the 56MHz.
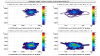
- Figure 2 shows a 2D plot of the error signal of the Diff+ degree of freedom as a function of the power on B1p on the 6 and 56 MHz. This kind of plot is useful to determine the working point of the alignment lops. Normally we are interested in being at the minimum of B1p and at the maximum at B4.
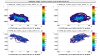
- Figure 3 shows the same 2D plot but of PR loop against the sidebands on B4.
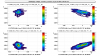
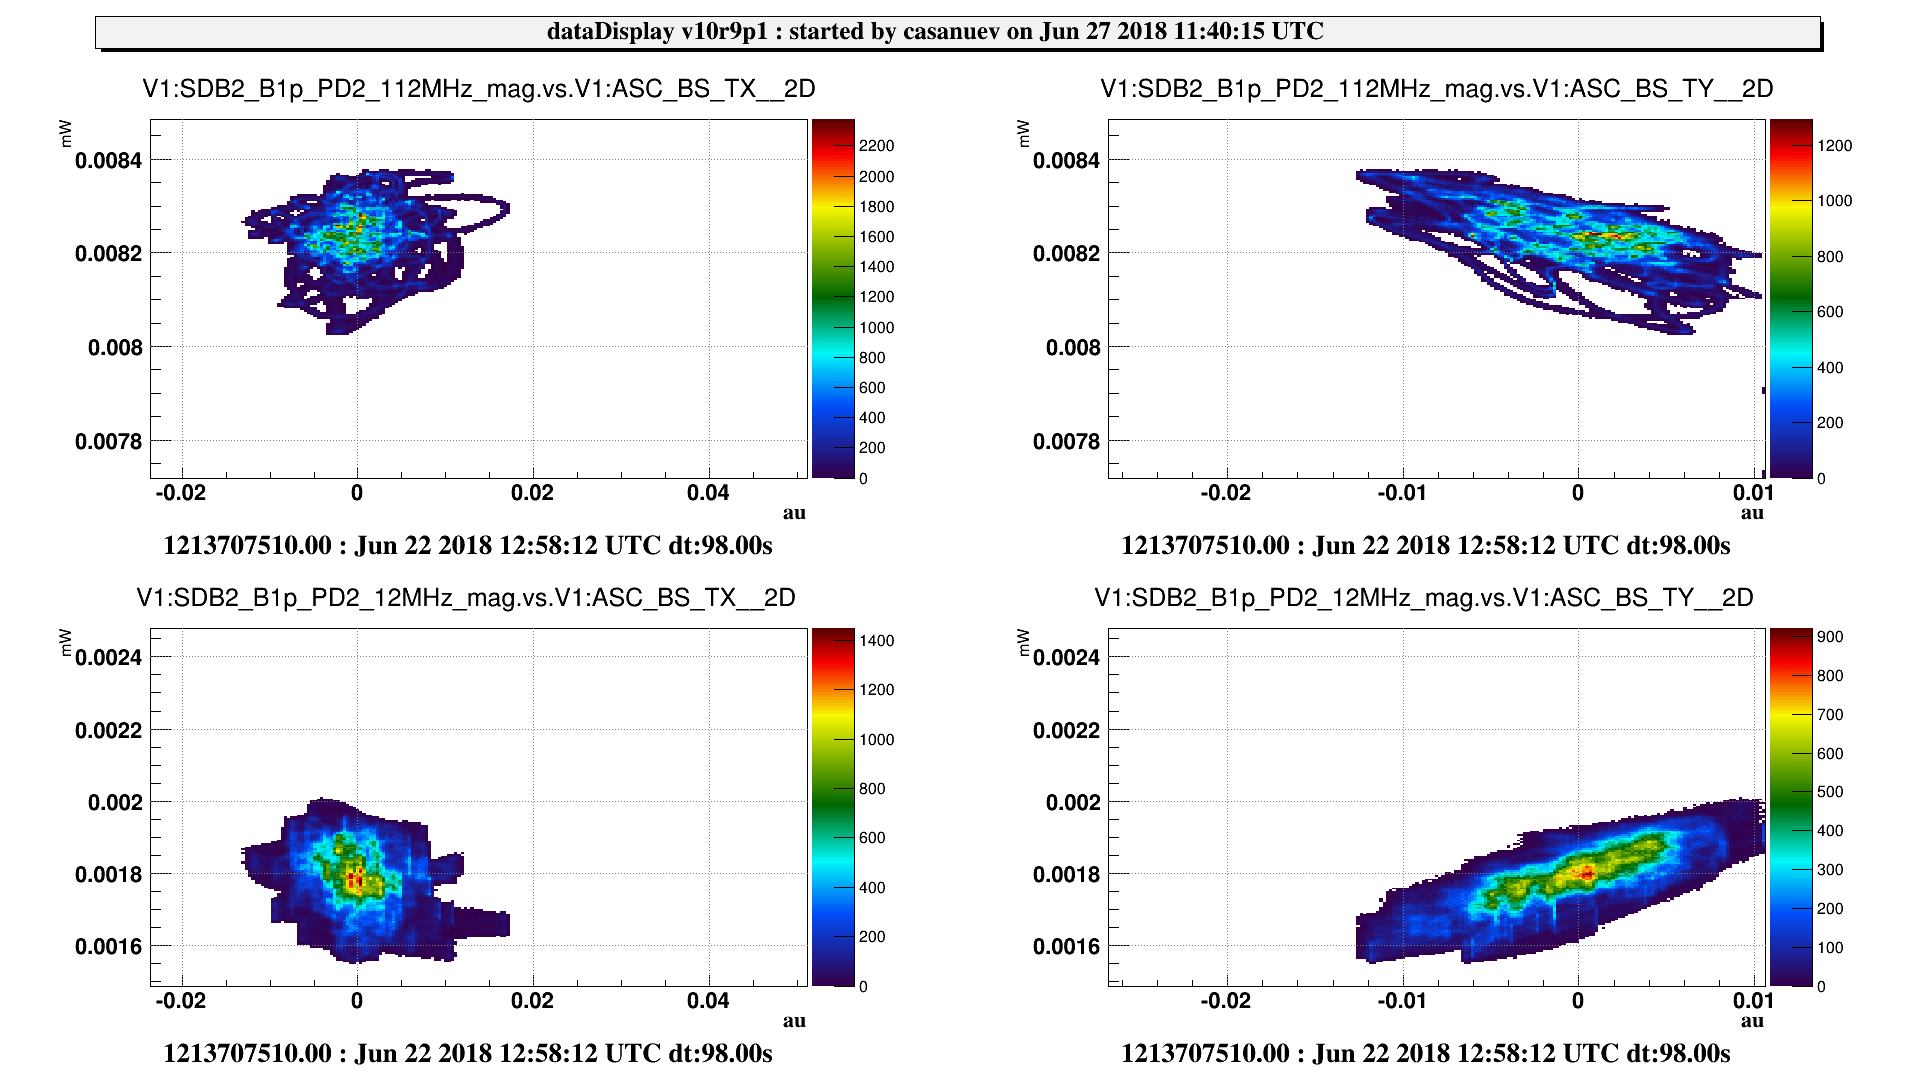
- Figure 4 shows the same 2D plot but for BS loop against the sidebansd on B1p.
For the PR and BS loops, it seems that the working point which is good for the 6MHz does not agree with the one of the 56MHz. Together with the trend of the first figure we might try to check whether the working point provided by the 6MHz also brings up the power of the carrier.