Analyzing the noise injections which were performed two weeks ago and accounting for the calibration factor allowing to convert the frequency noise injections in Hz/V, we made an estimation of the CMRF following the same procedure as reported in 38675.
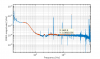
The plot of the CMRF is reported in figure 1. Here the red dots correspond to the data with a coherence higher than 0.85.
In this estimation, we are not completely confident about the low frequency (below 100 Hz) region, where the CMRF is dominated by the Finesse asymmetry (see equation [1] in #38675), so more investigations are needed about this frequency region.
However, at higher frequencies (above ~100 Hz), the CMRF is mainly dominated by the losses asymmetry, as reported in equation [2] of #38675. Fitting the function in this region where the CMRF is 1.2e-4, we derive a losses asymmetry of the order of 2ppm, which is pretty good, and consistent with what we measured before O2 (#38675).
In order to see if there is any worsening of the CMRF in the last weeks, a new noise injection will be performed during today's shift in order to do the comparison.