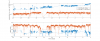
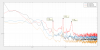
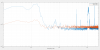
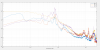
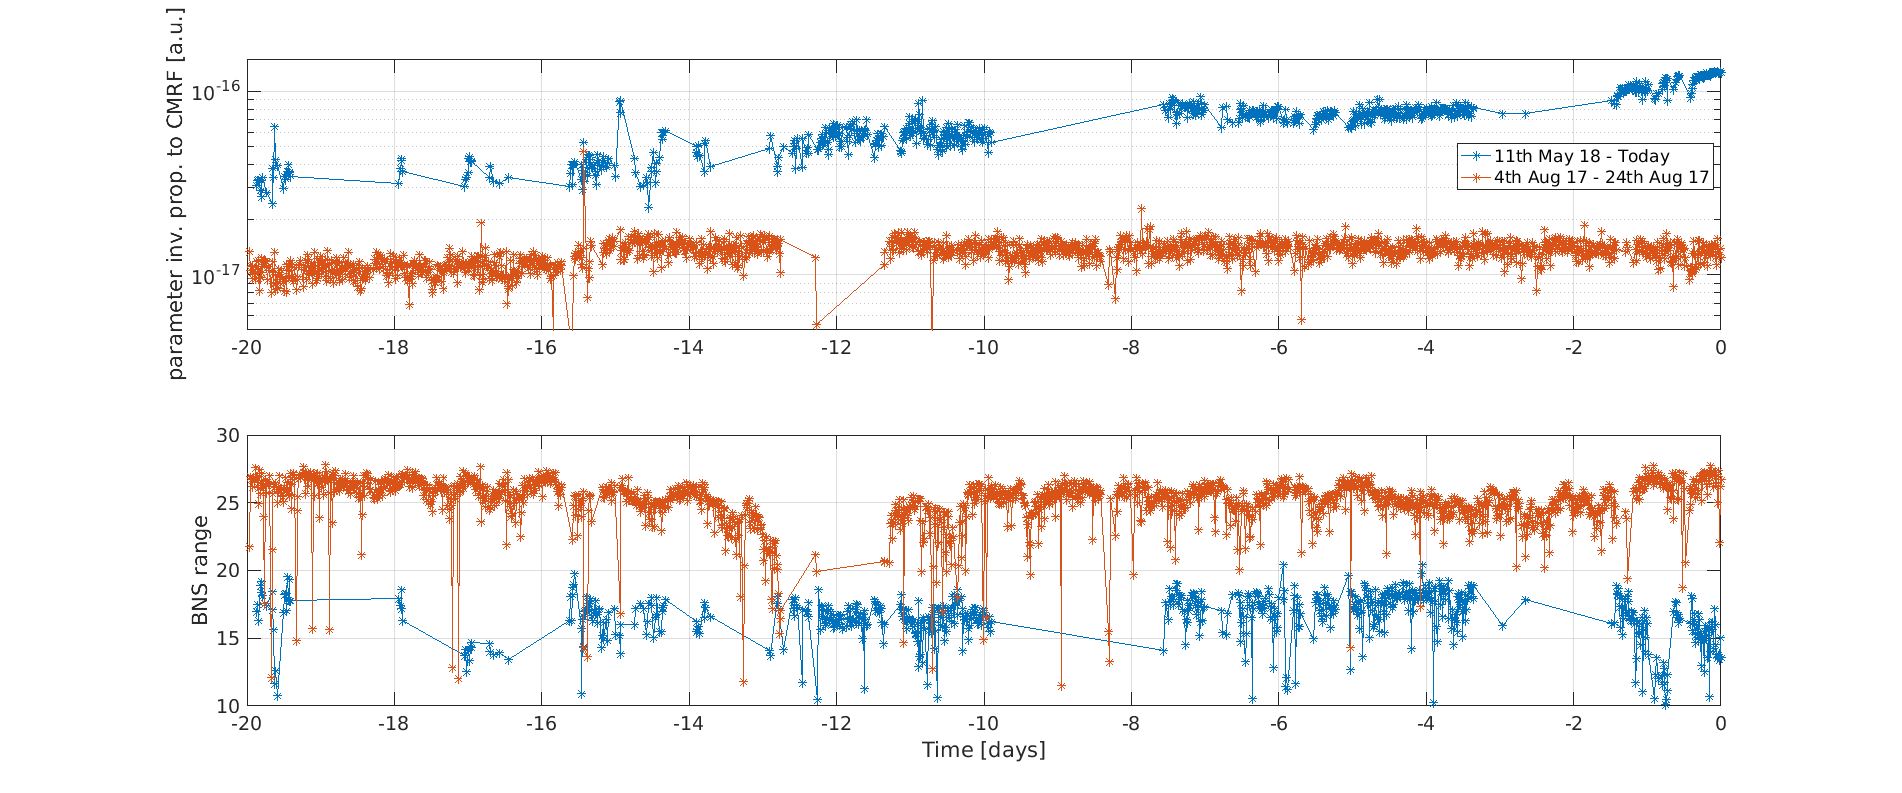
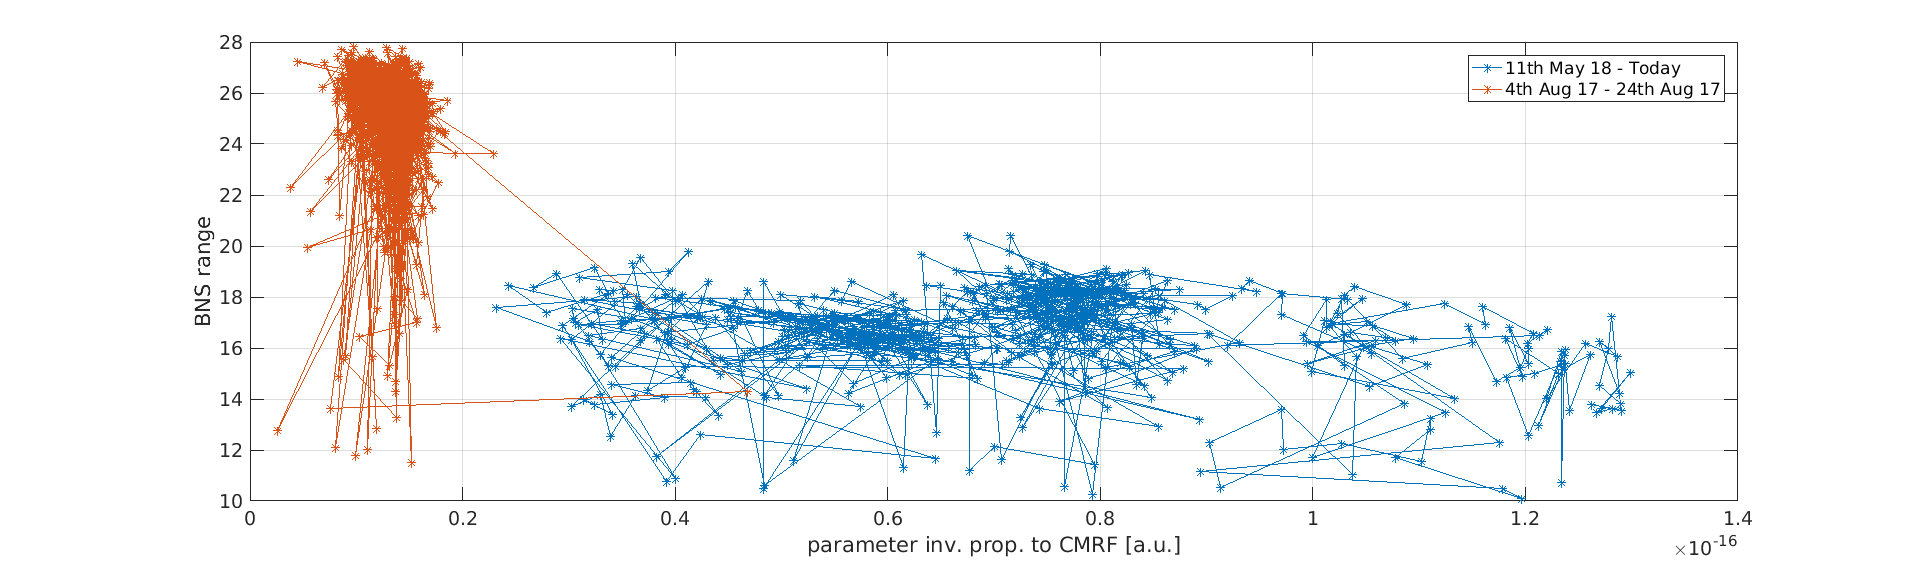
We have taken a look to the ratio between the amplitude of the 3345 Hz line at the SSFS and at Hrec. Figure 1 shows a comparison of this ratio in the last 25 days and during O2. We can see a trend of increase of a factor almost 4 so far. Figure 2 shows a 2D plot of the range against the ratio between the lines. HOwever, the correlation between both is not clear.
It is very difficult to correlate this trend with a particular parameter, so we will continue with the investigations.
