It is always rewarding to browse through the Hrec spectrogram plot using Didier's "magic command" (here the command used for the plots attached below):
$ROOTROOT/$UNAME/bin/root.exe -l /opt/w3/vim/spectro/spectro_auto.C\(\"Hrec_hoft_20000Hz\",1185277224,400000,0.1,0,500,0,0,0\)
(note, you also need to create in your home dir one file named ".rootrc" containing the following text.
Unix.*.Root.DynamicPath: .:$(ROOTSYS)/$(UNAME):$(ROOTSYS)/lib:$(FRROOT)/$(UNAME)
Unix.*.Root.MacroPath: .:$(ROOTSYS)/macros:$(FRROOT)/root
Rint.Logon: $(FRVROOT)/root/FrvLogon.C
Rint.History: $(HOME)/.root_hist
)
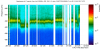
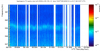
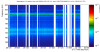
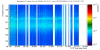
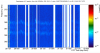
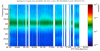
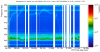
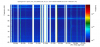
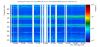
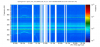
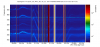
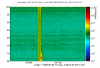
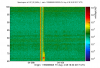
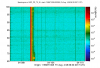
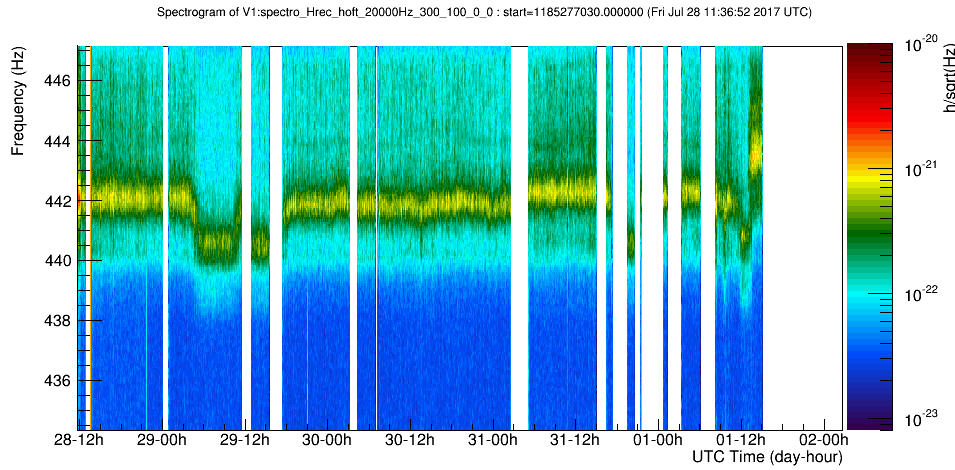
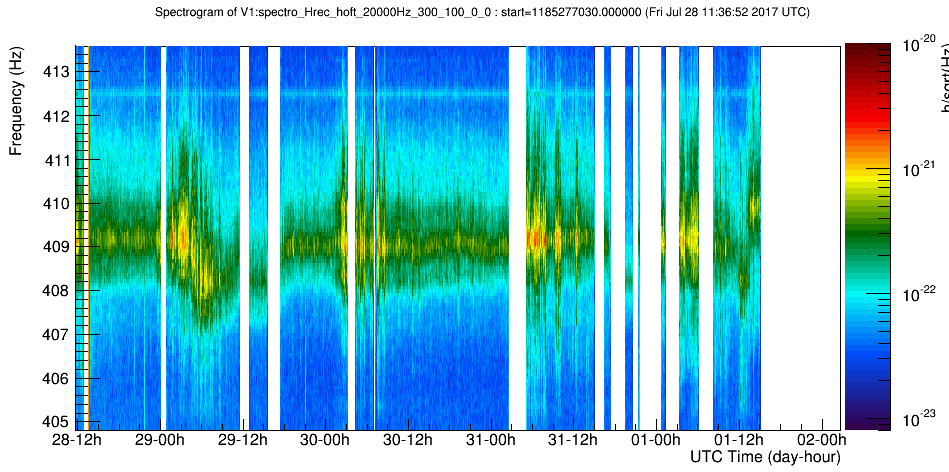
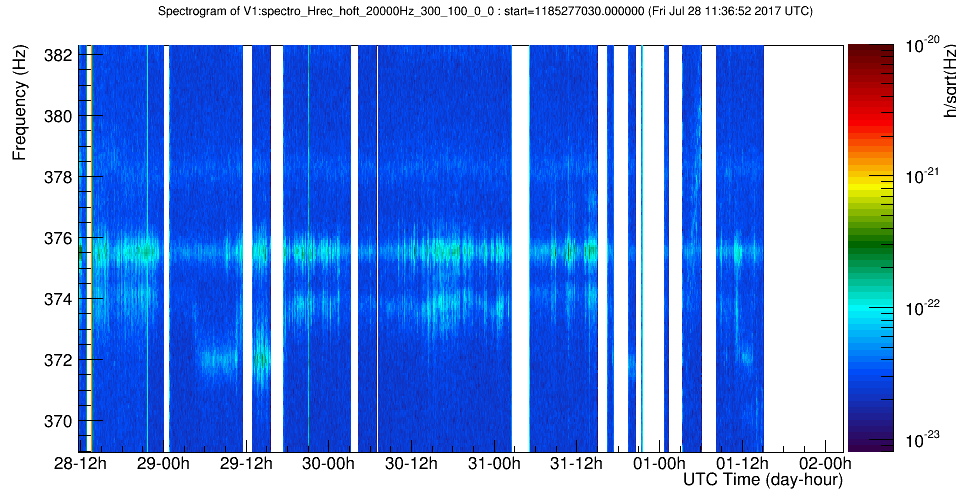
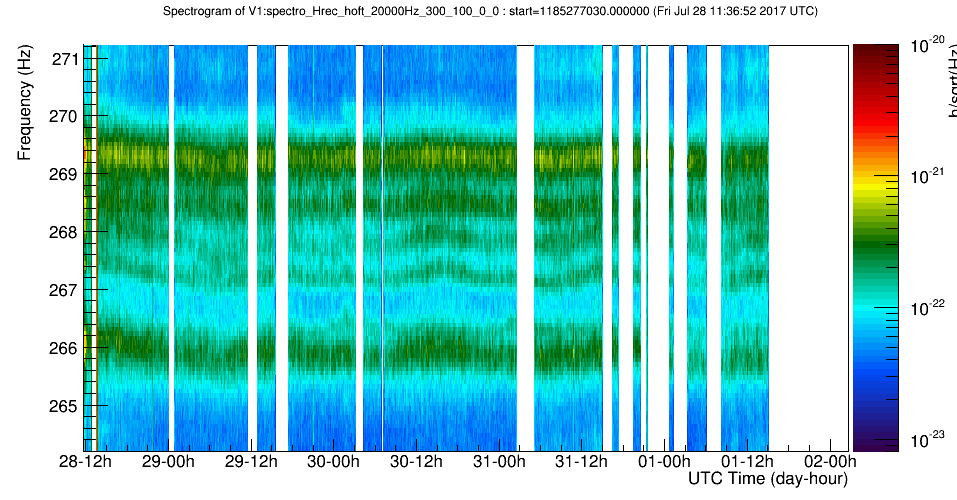
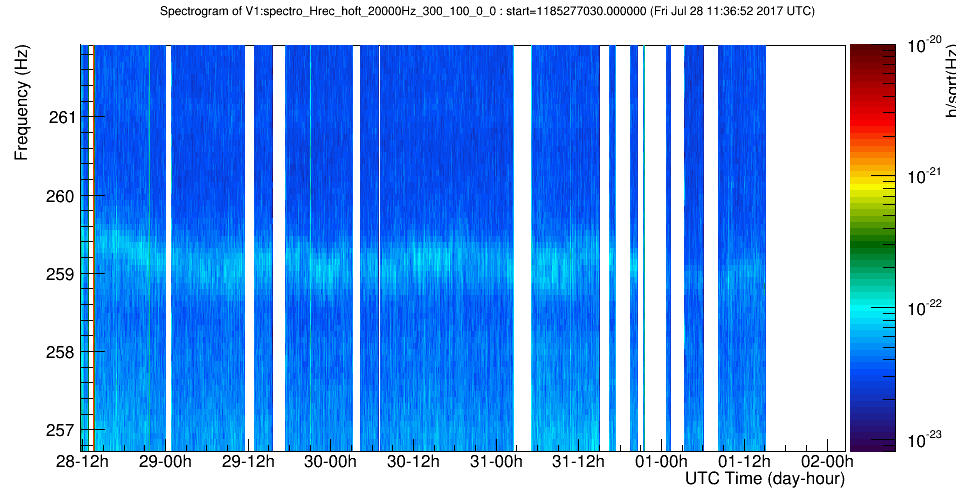
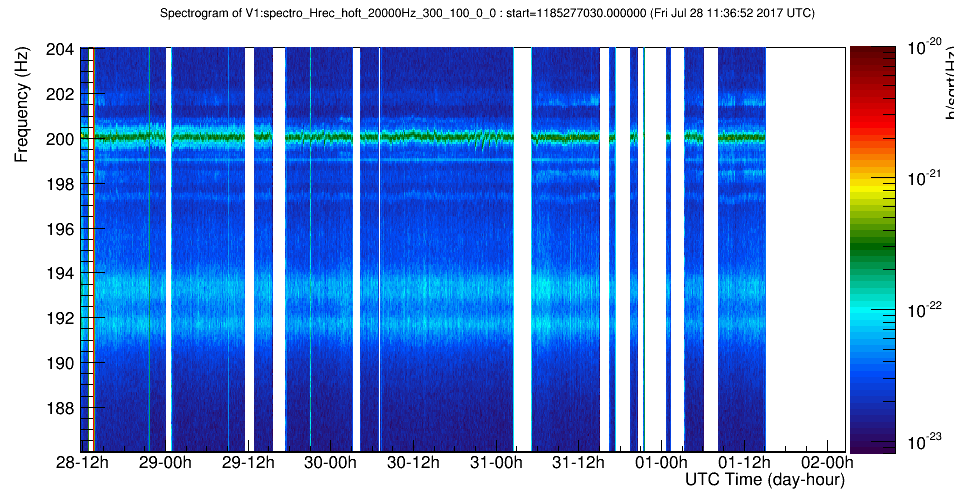
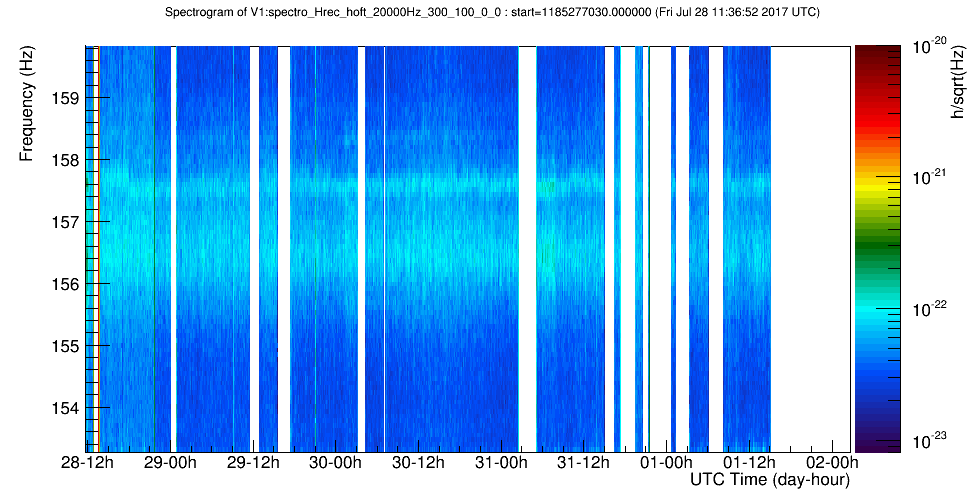
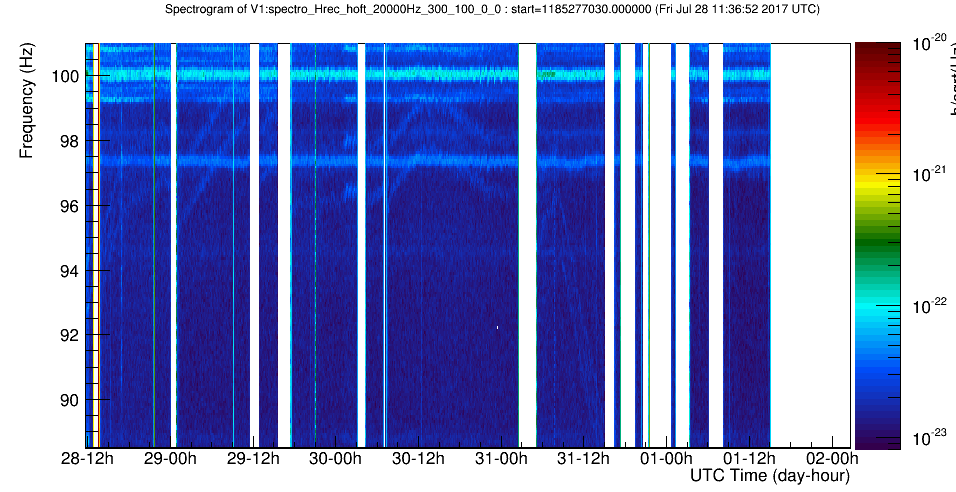
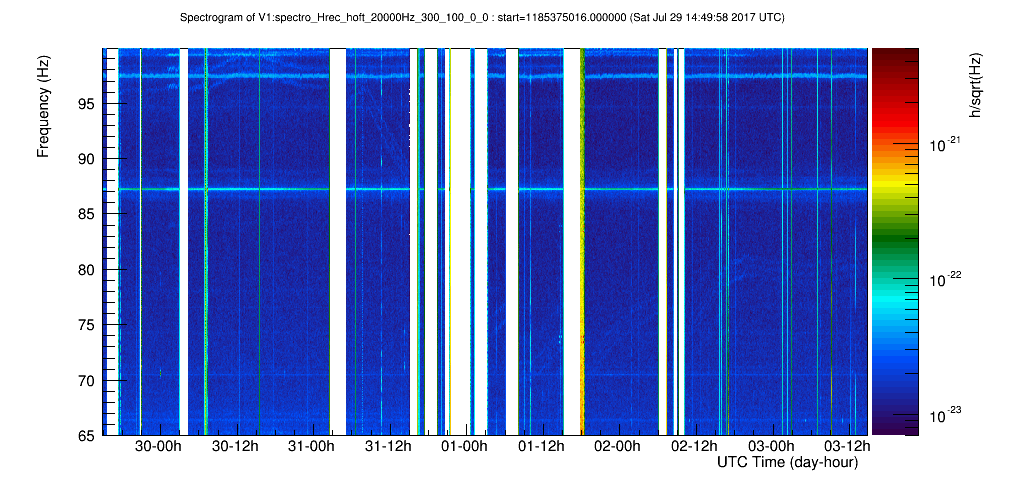
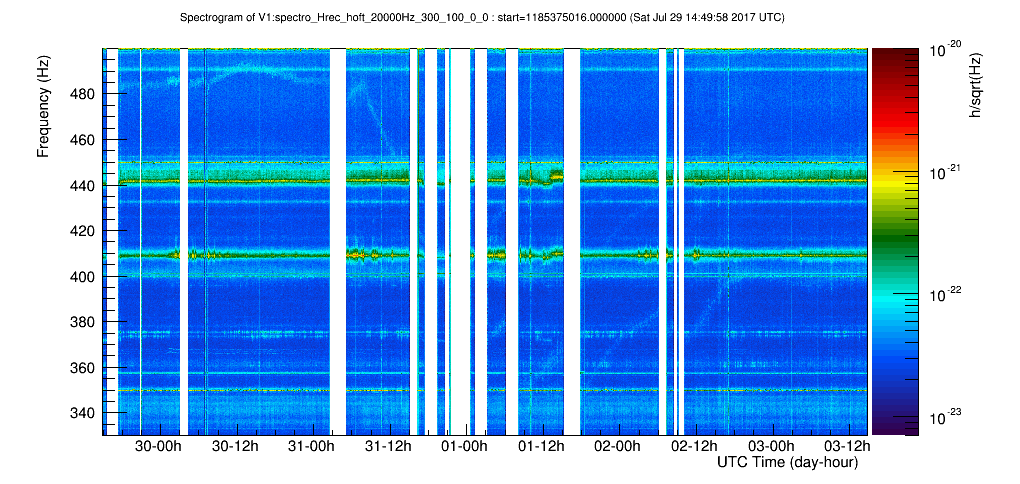
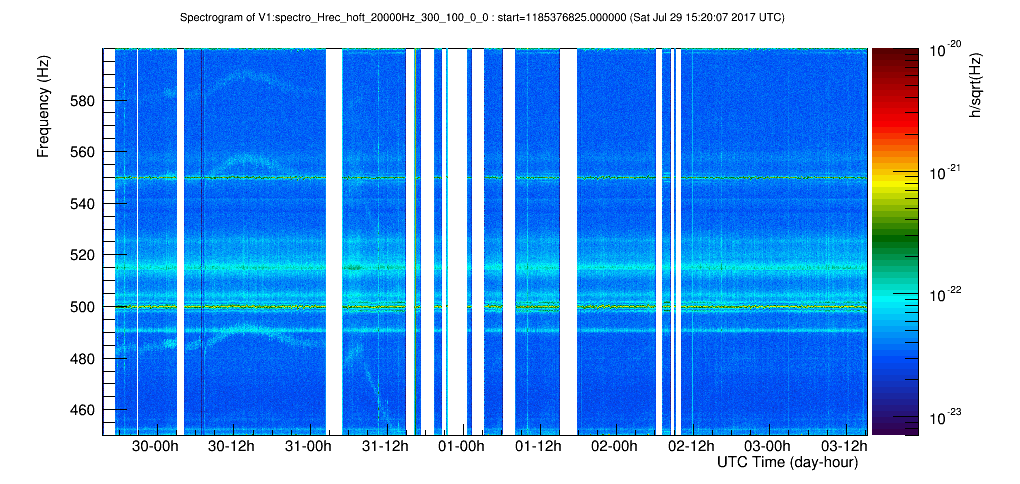
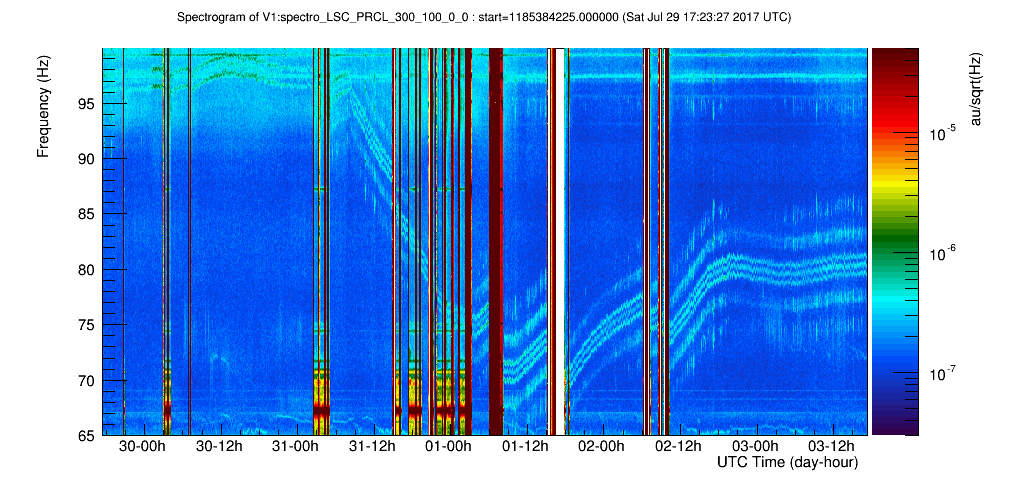
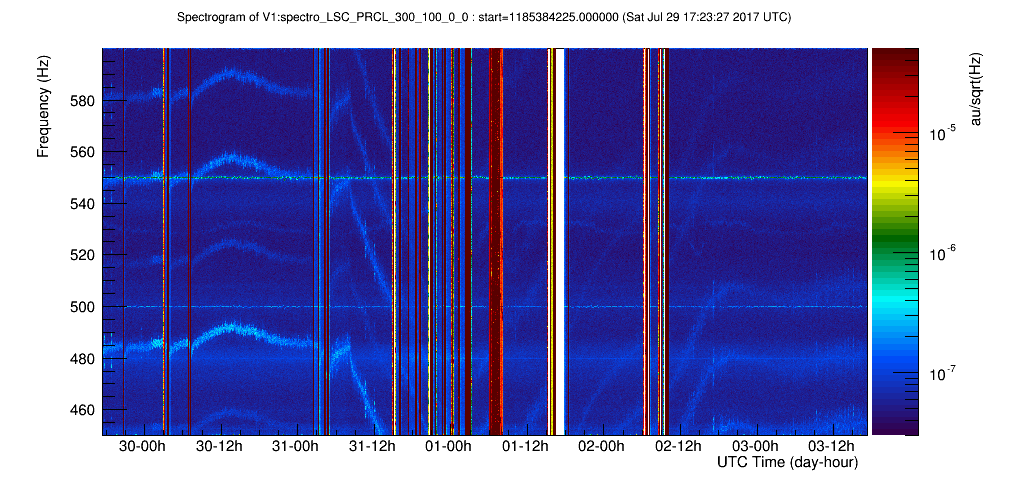
There are peaks that move in frequency (some more, some less). It is interesting to investigate them more deeply, for example by looking for correlations with temperature sensors, alignment signals, beams power (to start with...). Here a tentative list of commonly moving peaks:
- 442 Hz, 409 Hz, 373 Hz (Figures 1,2,3) move significantly in frequency (already noticed in 38677)
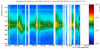
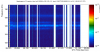
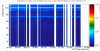
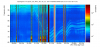
- family of lines around 270 Hz (figures 4 and 5)
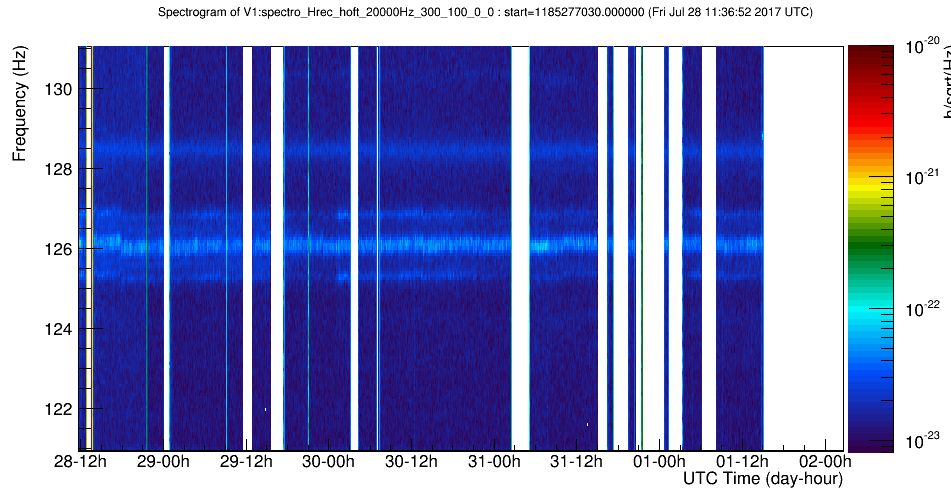
- 193 Hz, 156 Hz move slightly in frequency (note: these peaks are "certified" to belong to SDB1, since they clearly rised when the bench was shaked with white noise) also 126 Hz moves coherently (Figures 6, 7,8)... do they correlate with temperature changes inside SDB1?
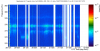
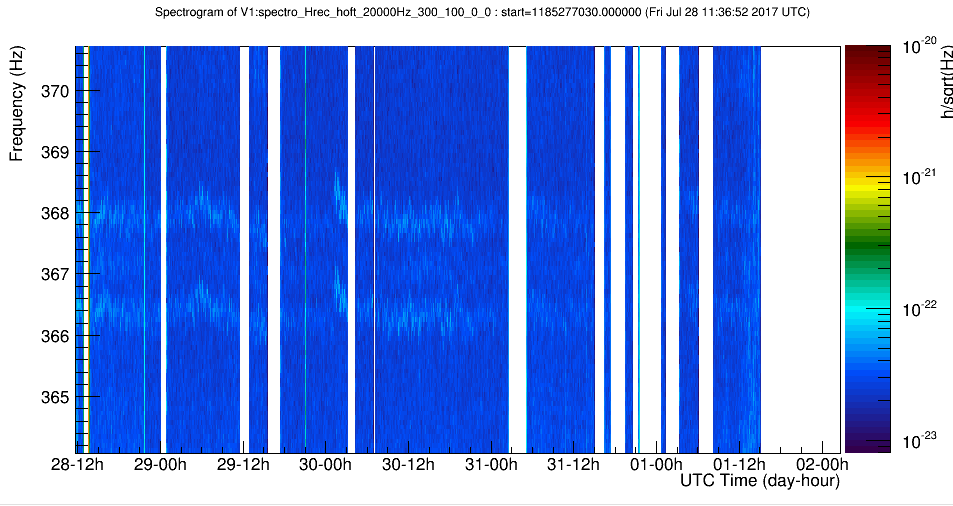
- 367 Hz (a group of three lines) in Figure 9
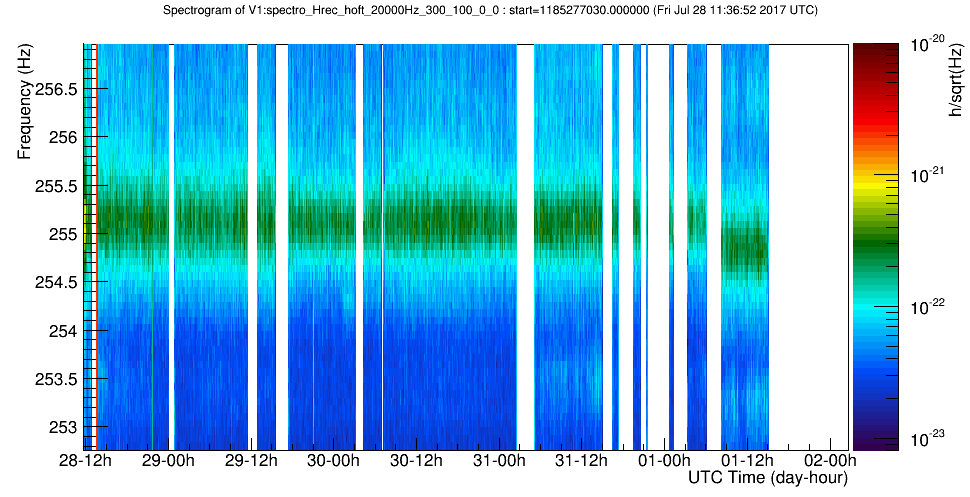
- 255 Hz, in Figure 10
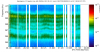
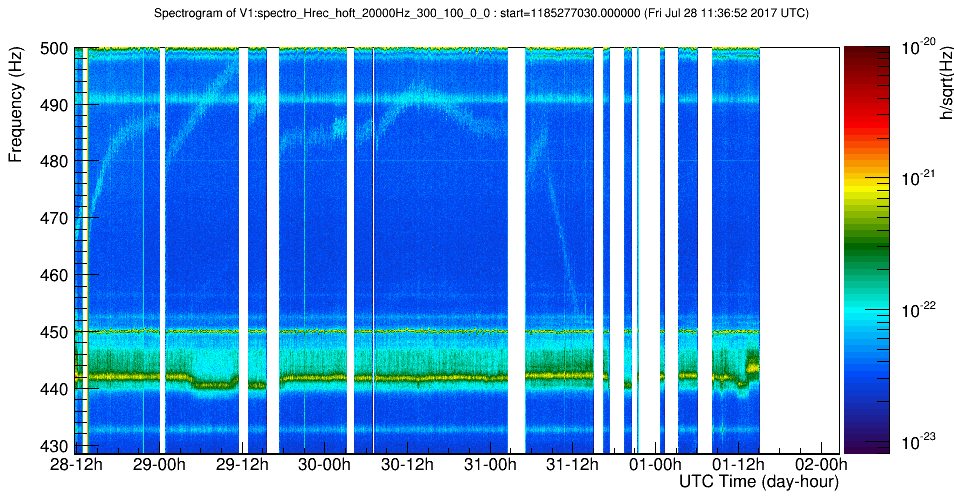
- wandering lines: around 450Hz and around 90Hz: Figures 11 and 12
Good also to check if these peaks are tracked by Noemi....