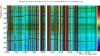
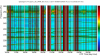
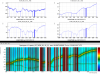
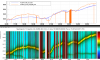
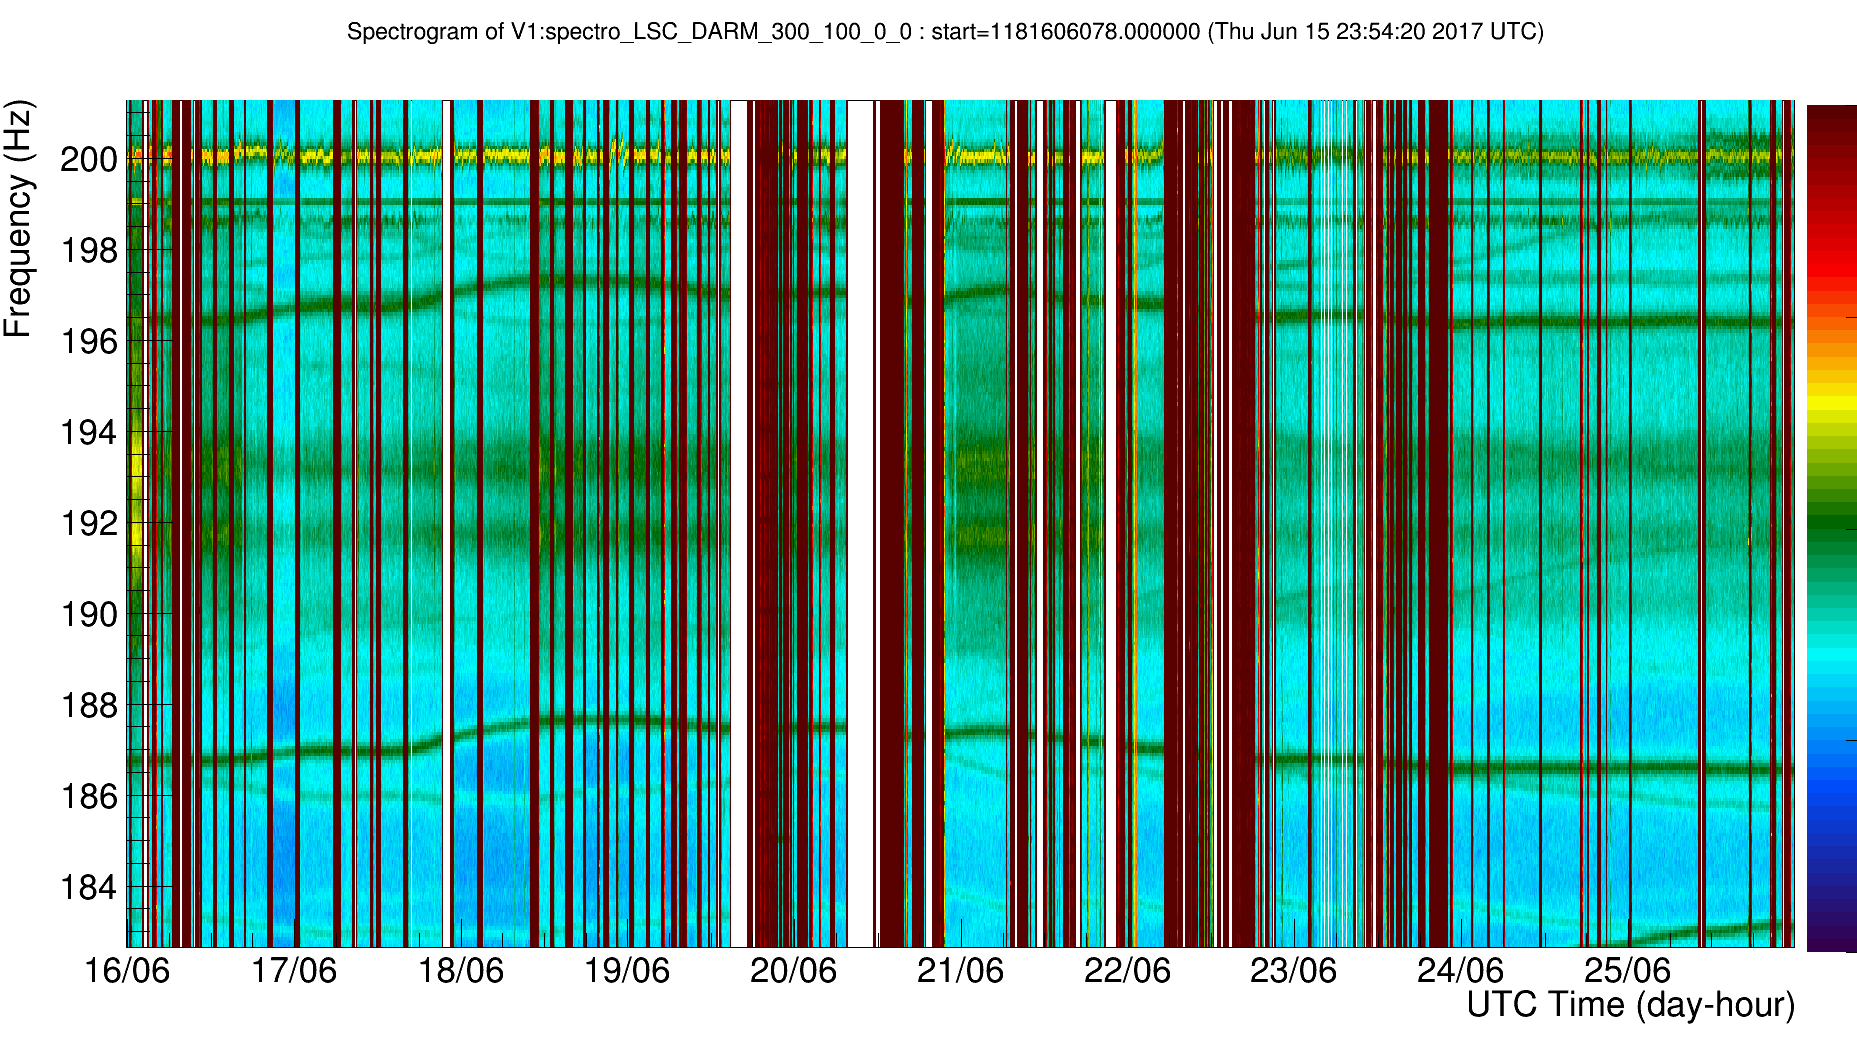
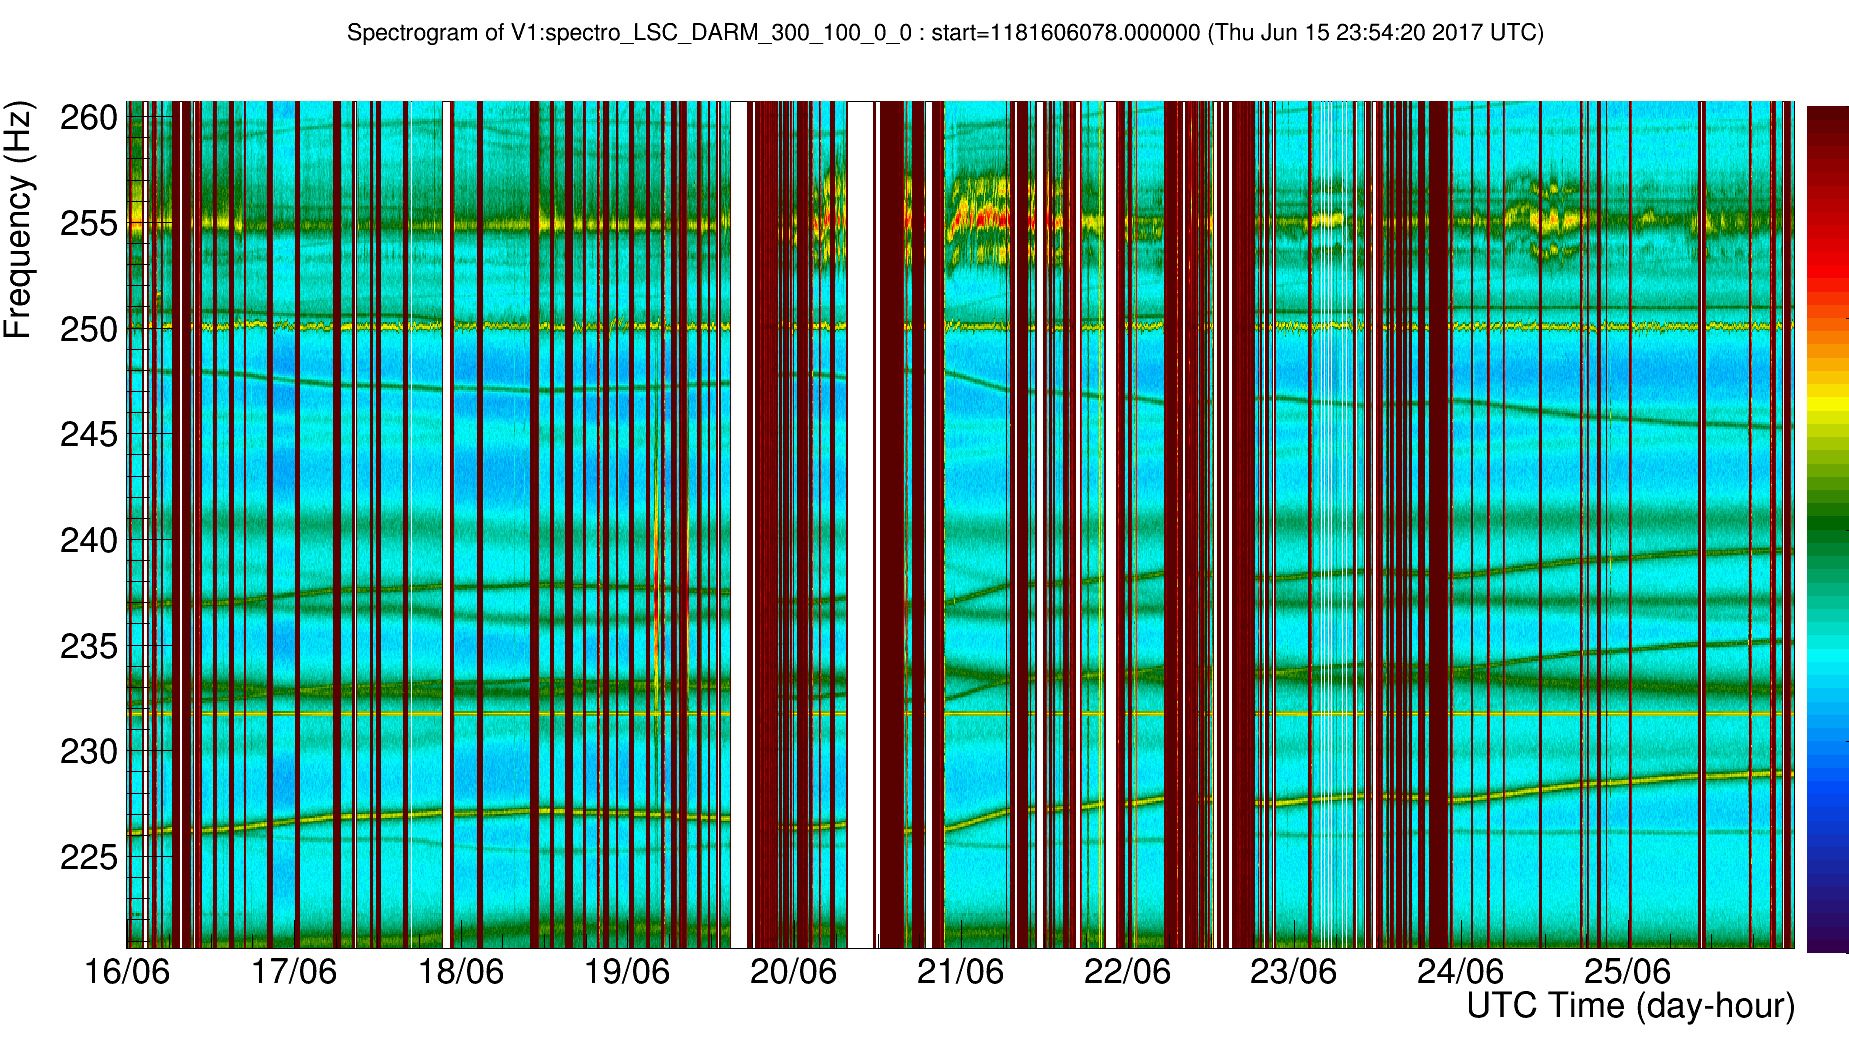
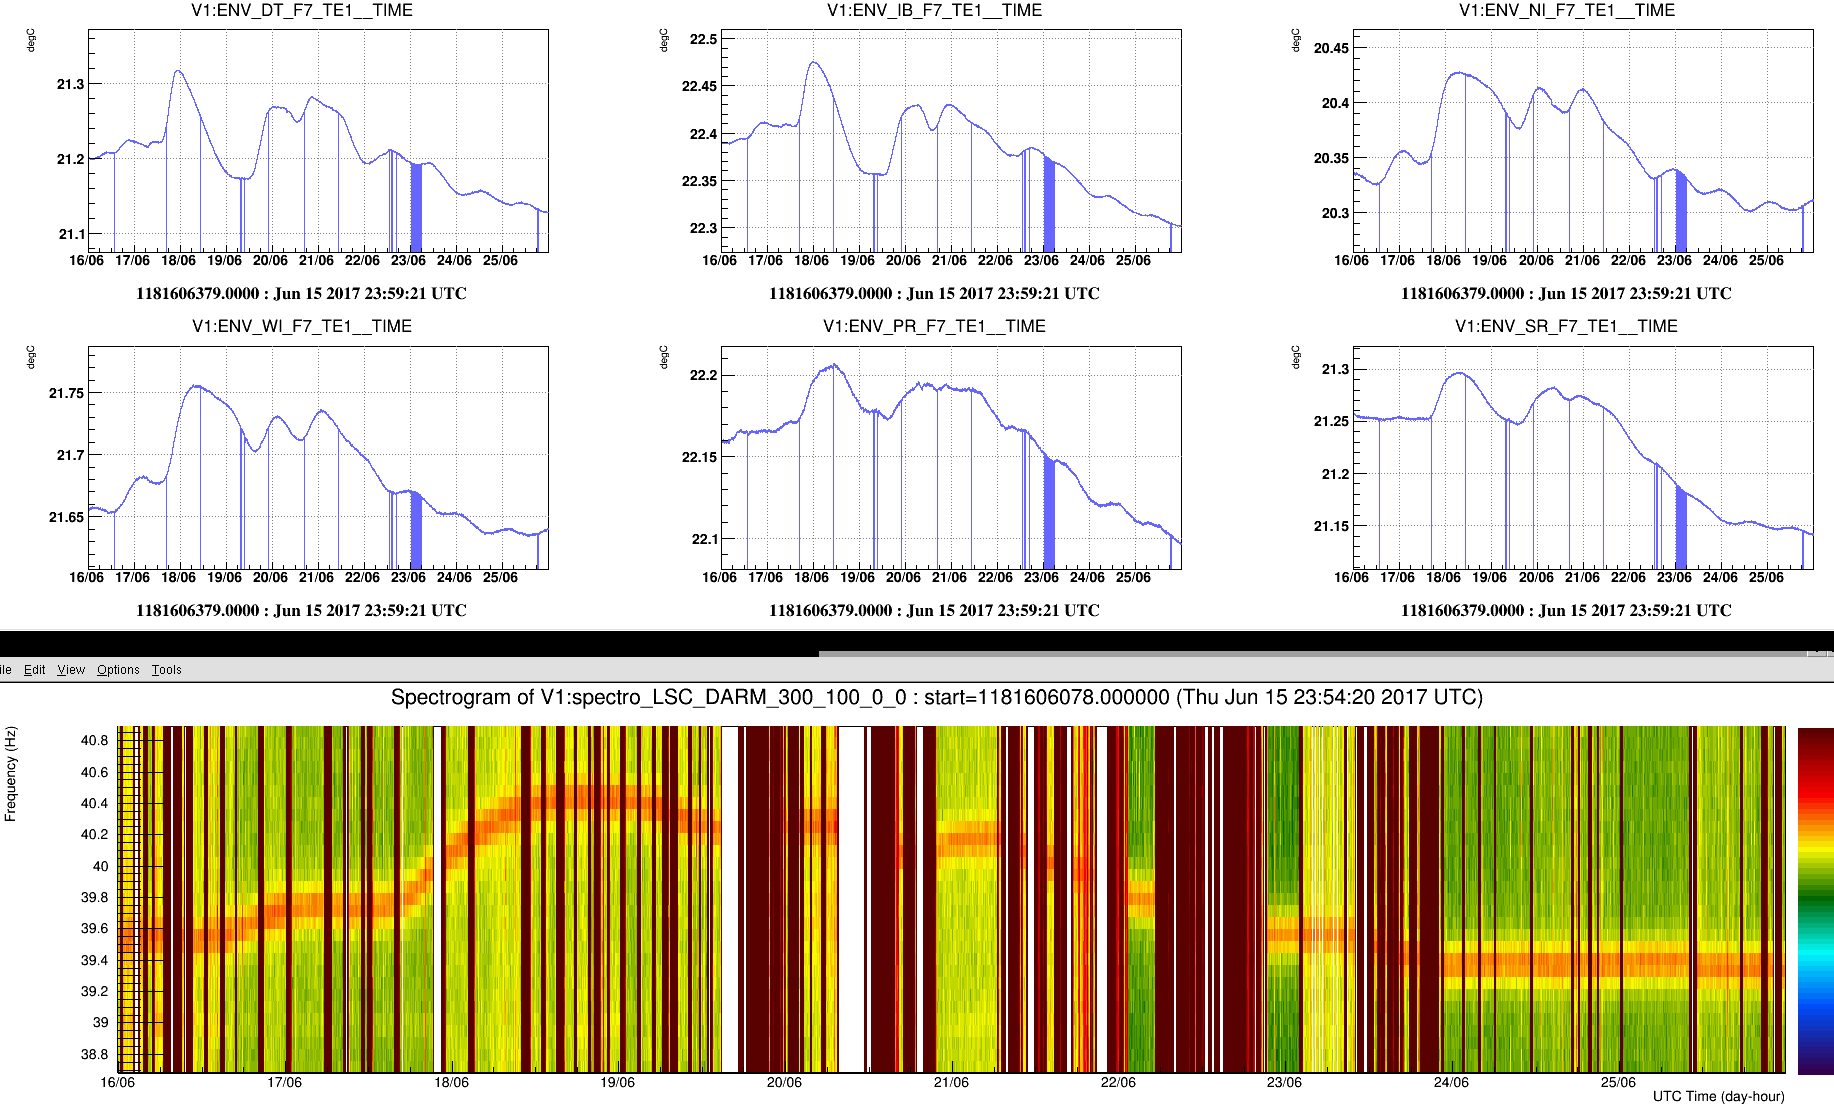
A visual inspection of DARM drifting lines over a 10 day period seems to confirm the correlation with in-tower temperature sensors that was found by the brute force correlation analysis done over ER11/a.
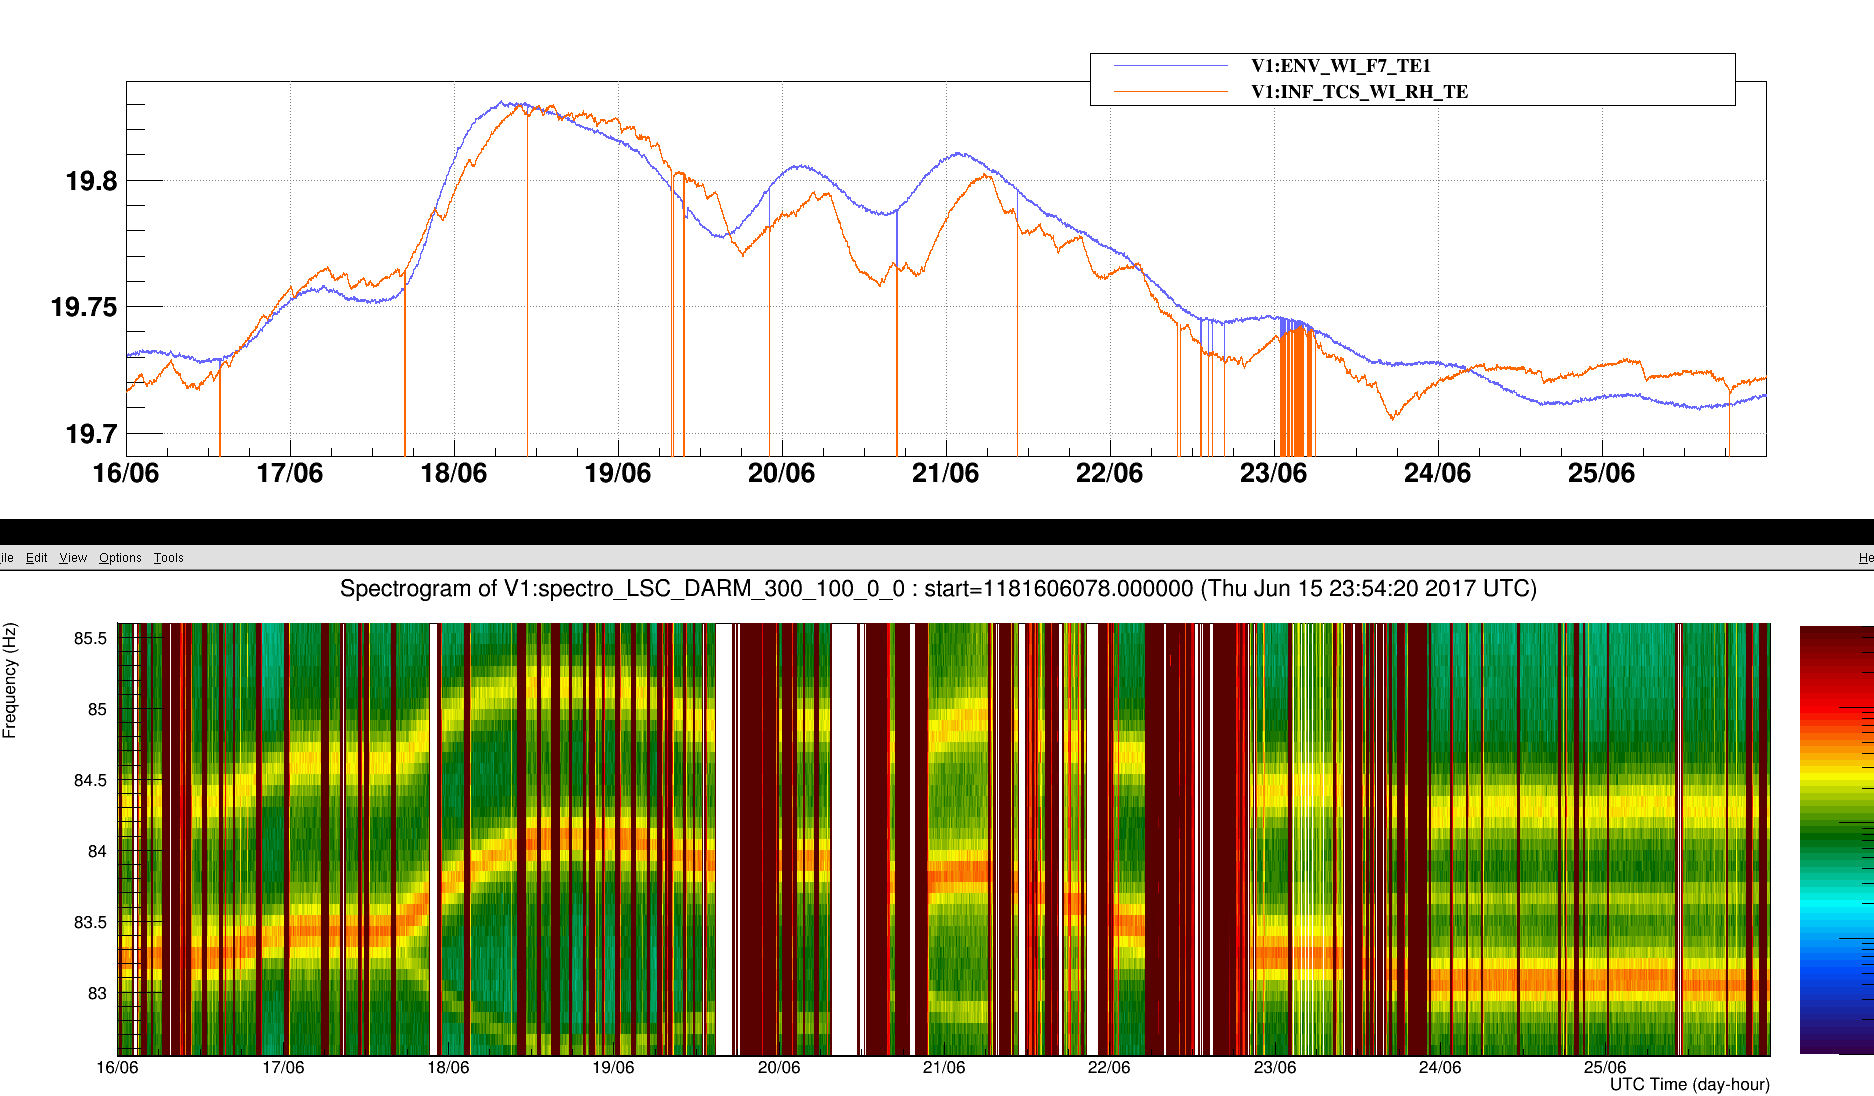
Attached are some spectrogram (**) shots of the forest of drifting peaks: Figure 1, Figure 2
We tentatively found two families of peaks:
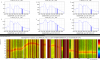
- peaks whose frequency drift correlates (or anti-correlates) with the temperature of CEB towers. Among which the one that qualitatively matches best are sensors at the level of F7 or RH inside WI tower (Figure 3, Figure 4)
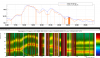
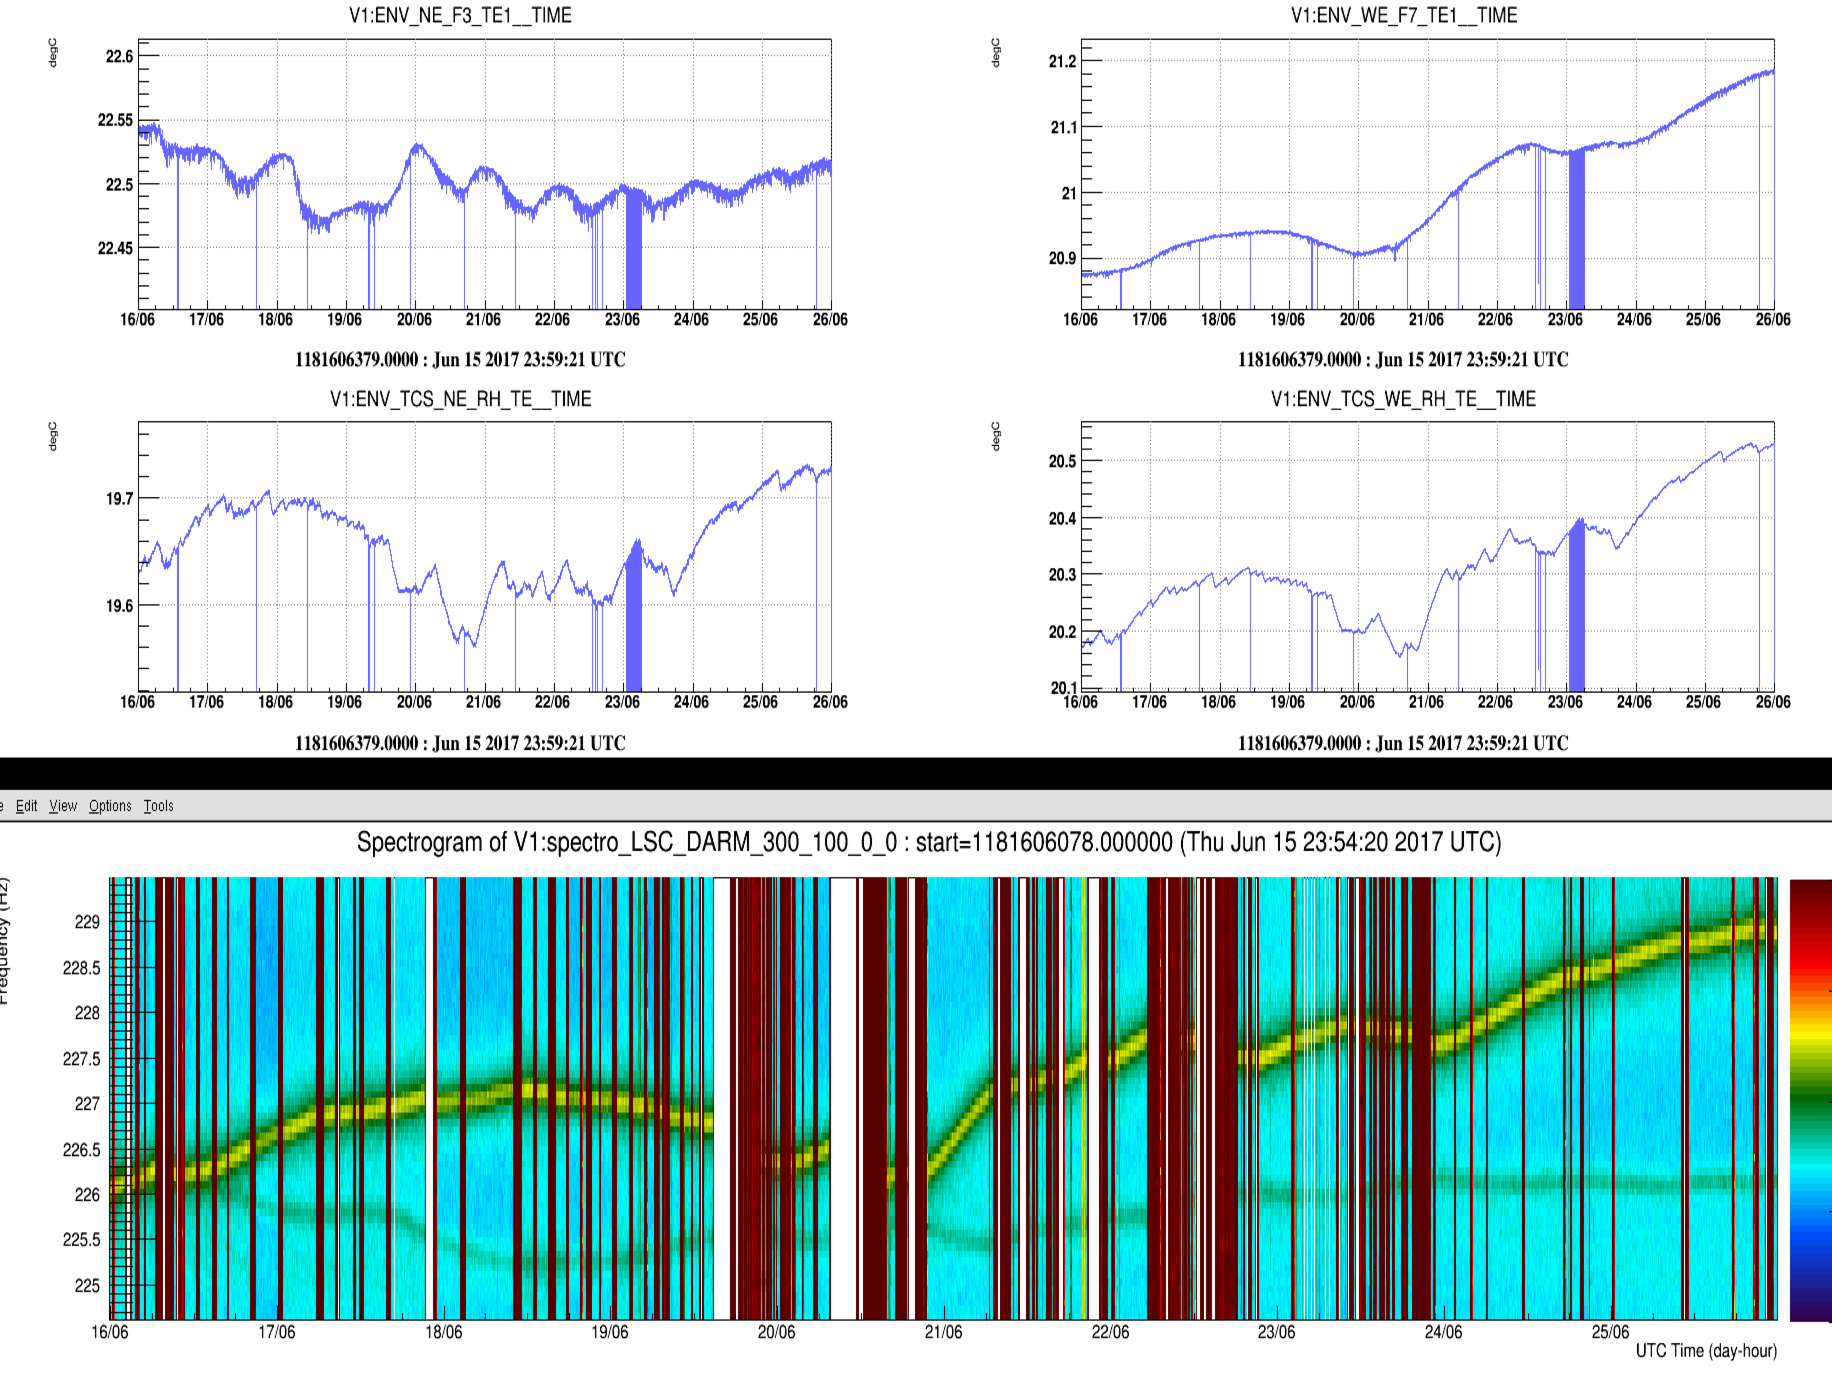
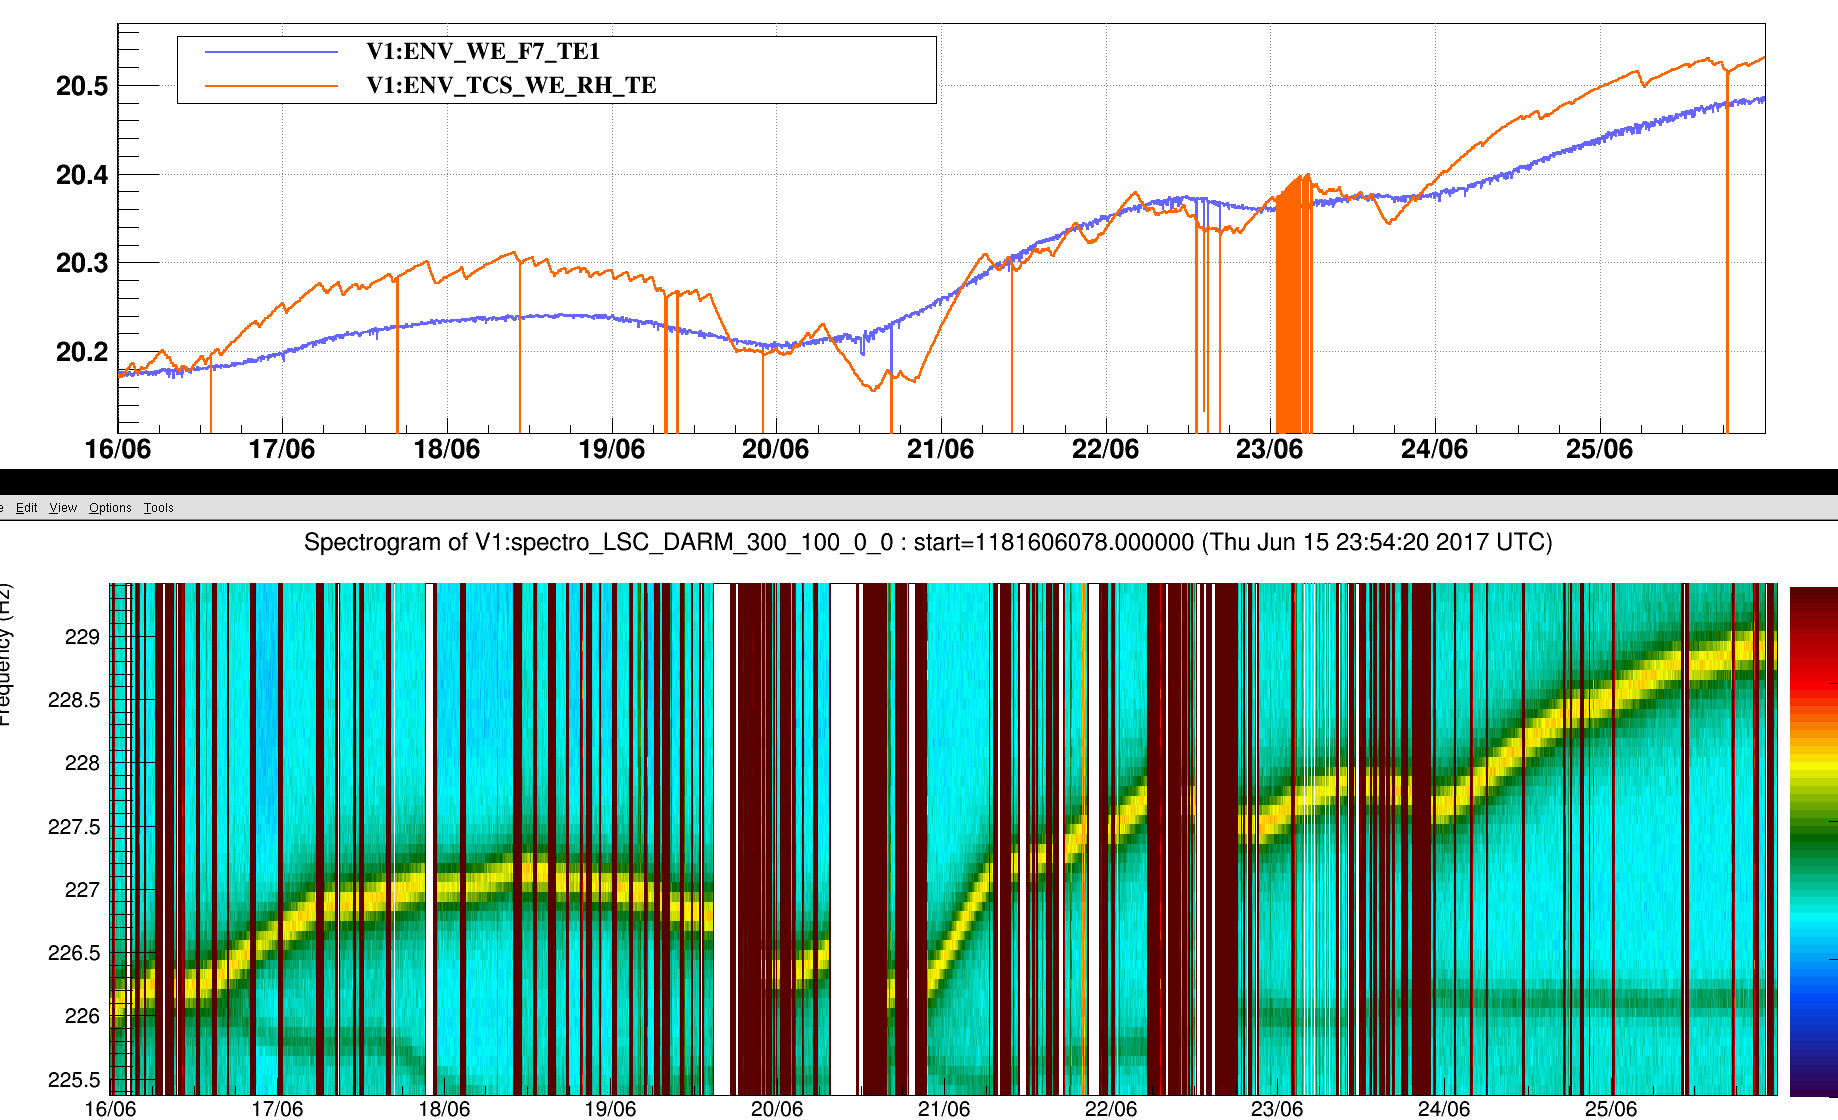
- peaks correlating (or anti) with the WE tower temperature sensors (Figure 5). A deeper insight among WE tower temperature sensors shows a visually good correlation with the TE sensor at the WE ring heater (Figure 6)
These qualitative observations have to be verified with correlation analyses.
--------------------------------------------------------------------------------------------
(**) this is magic Didier's command to get this spectrogram:
$ROOTROOT/$UNAME/bin/root.exe -l /opt/w3/vim/spectro/spectro_auto.C\(\"LSC_DARM\",1181180000,864000,0.1,0,500,0,0,0\)
plus you need to have the file .rootrc in your home dir:
cat ~fiori/.rootrc
Unix.*.Root.DynamicPath: .:$(ROOTSYS)/$(UNAME):$(ROOTSYS)/lib:$(FRROOT)/$(UNAME)
Unix.*.Root.MacroPath: .:$(ROOTSYS)/macros:$(FRROOT)/root
Rint.Logon: $(FRVROOT)/root/FrvLogon.C
Rint.History: $(HOME)/.root_hist