Frequency bands analyzed,
1) 89.5 +- 1 Hz (gradual decrease in frequency)
2) 83.5 +- 0.7 Hz (increase in frequency)
3) 63.4 +- 0.4 Hz (increase in frequency)
Good correlation was observed with the temperature recorded by the sensors V1:ENV_NI_F7_TE1, V1:ENV_NI_F7_TE2, V1:ENV_PR_F7_TE1, V1:ENV_PR_F7_TE2, V1:ENV_SR_F7_TE1, and so on. A full report of the findings is attached along.
It would be nice to understand if the temperature variation in this channels is the reason for the drifting(frequency) noise lines.
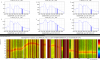
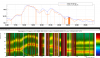
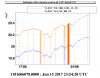
The brute force correlation analysis points for a correlation of drifting lines (at least the3 checked till now) with temperature probes INSIDE towers. The first figure here reproduces for conveninence one figure of the .pdf, which is showing graphs of the top-10 correlated channels for 89Hz drifting line during ER11/part2
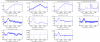
A reasonable question is: can we really discriminate between inside and outside (hall) temperatures?
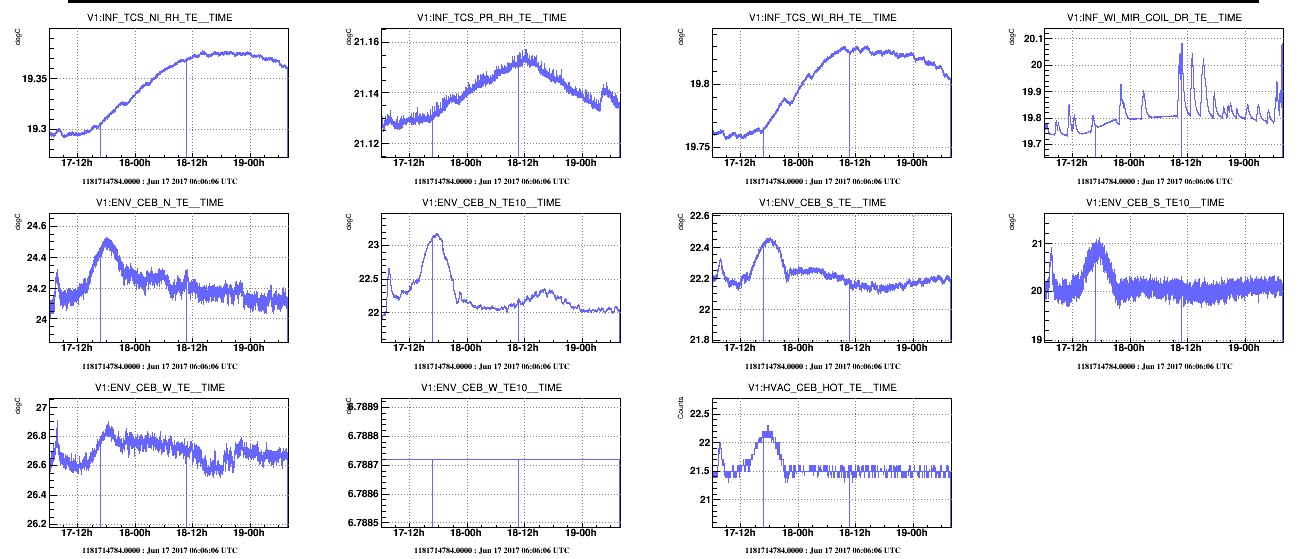
The answer seems yes. Look at Figure 2 comparing over the same ER11/2 period the tempeature evolution measured inside and outside CEB towers: they are significanly different (it is not even easy to spot the expected phase delay.... maybe it is because inside temperature is dominated by internal heat sources...). Figure 3 shows the same temperature probes since ER11/part2 till today: again inside and outside temperatures do not look much correlated.
So, seems to me that the frequency drift of these lines correlates with INSIDE temperatures.
Maybe improving the resolution of the reconstructed line's frequency evolution can allow improving correlations and hopefully disentangle between towers.
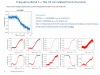
The effect is more evident in the plots on the left column.
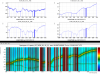
The second figure is a zoom of the plots of the left column around a maximum: this shows that there is a time delay between the environment and SA and along the chain of the S, as well.
The delay between the external environment and the F0 is around 5 hours and between F0 and F7 is around 9 hours.
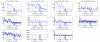
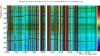
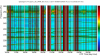
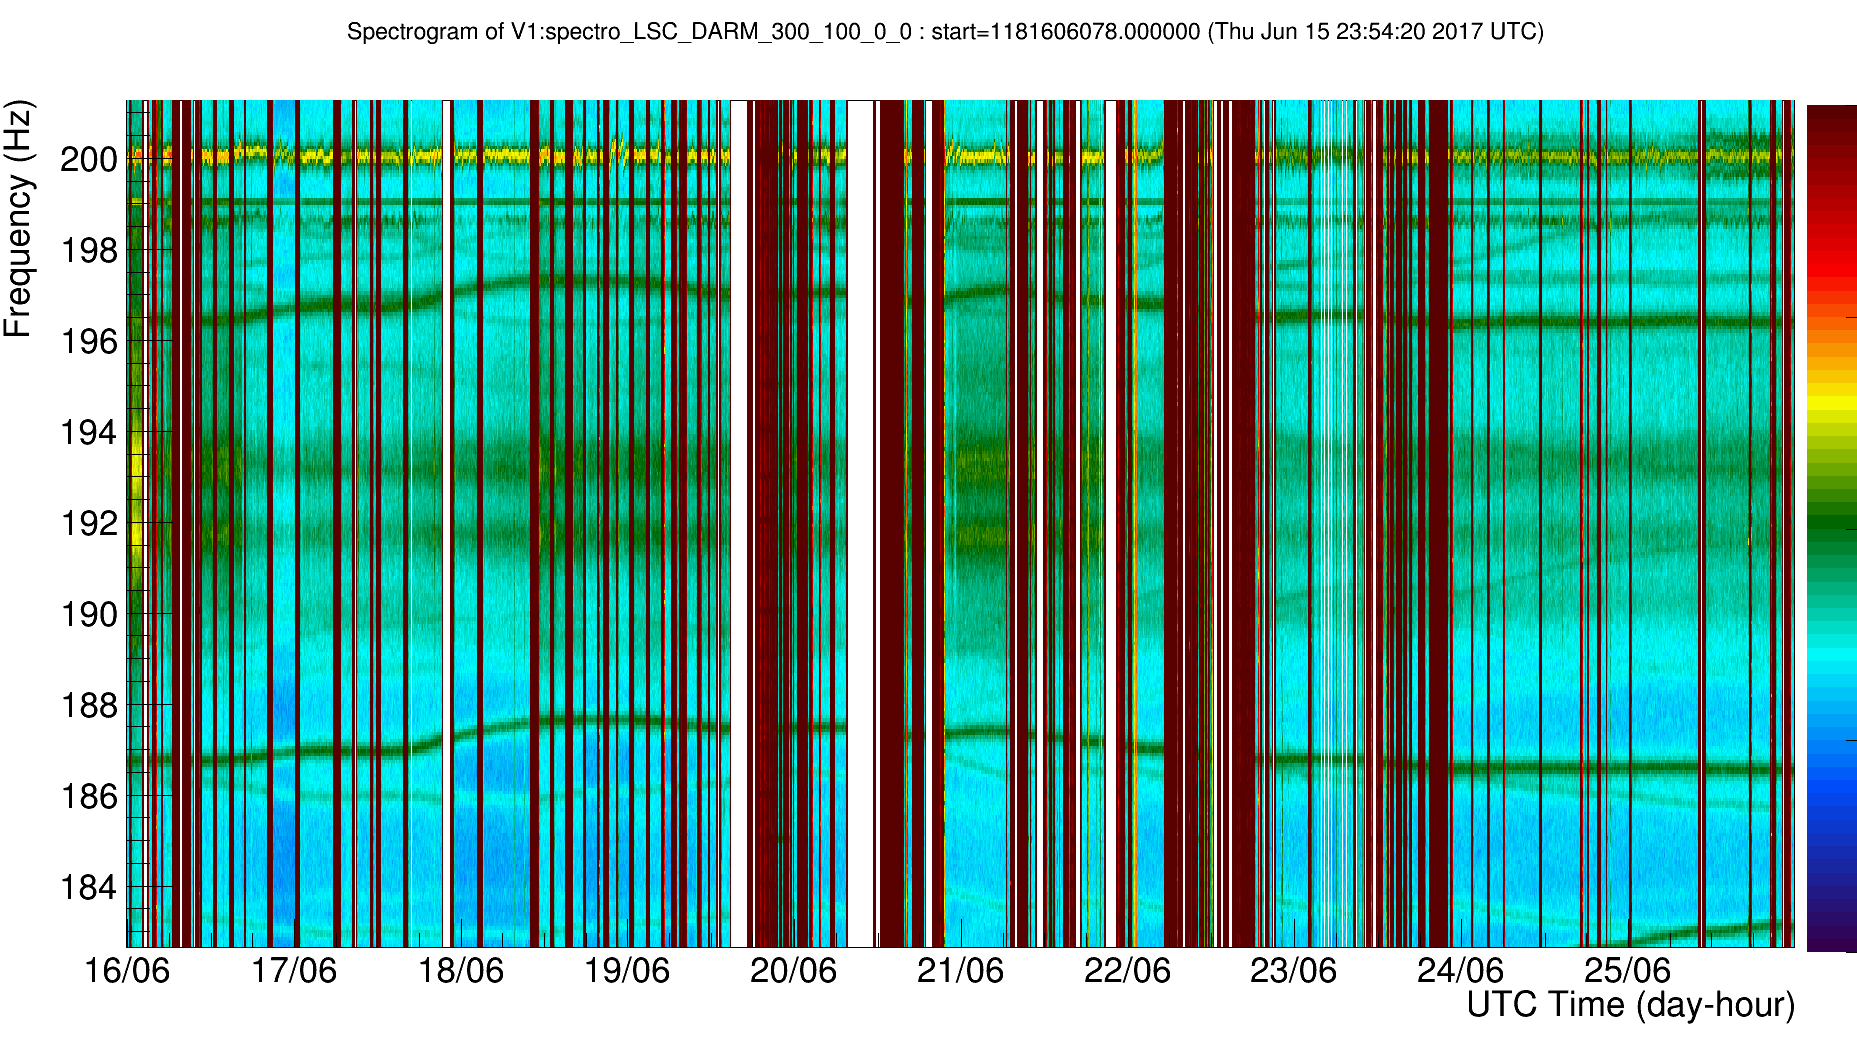
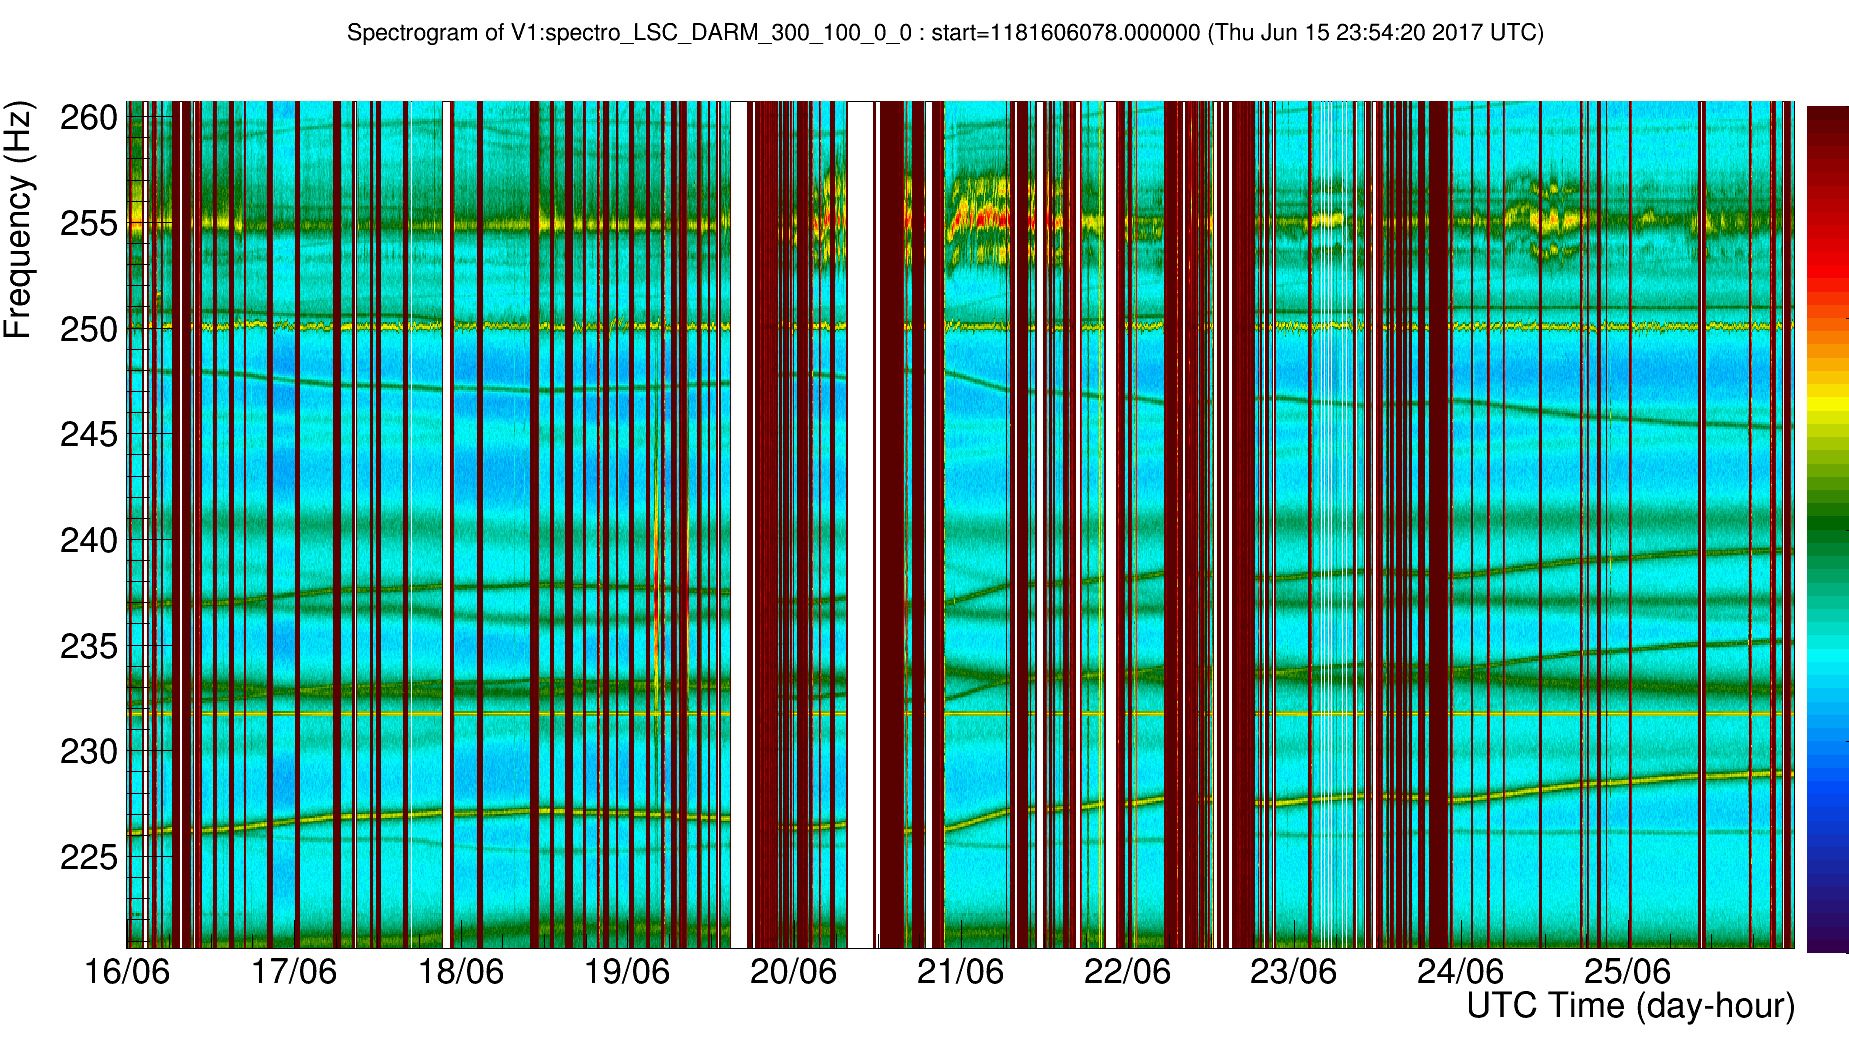
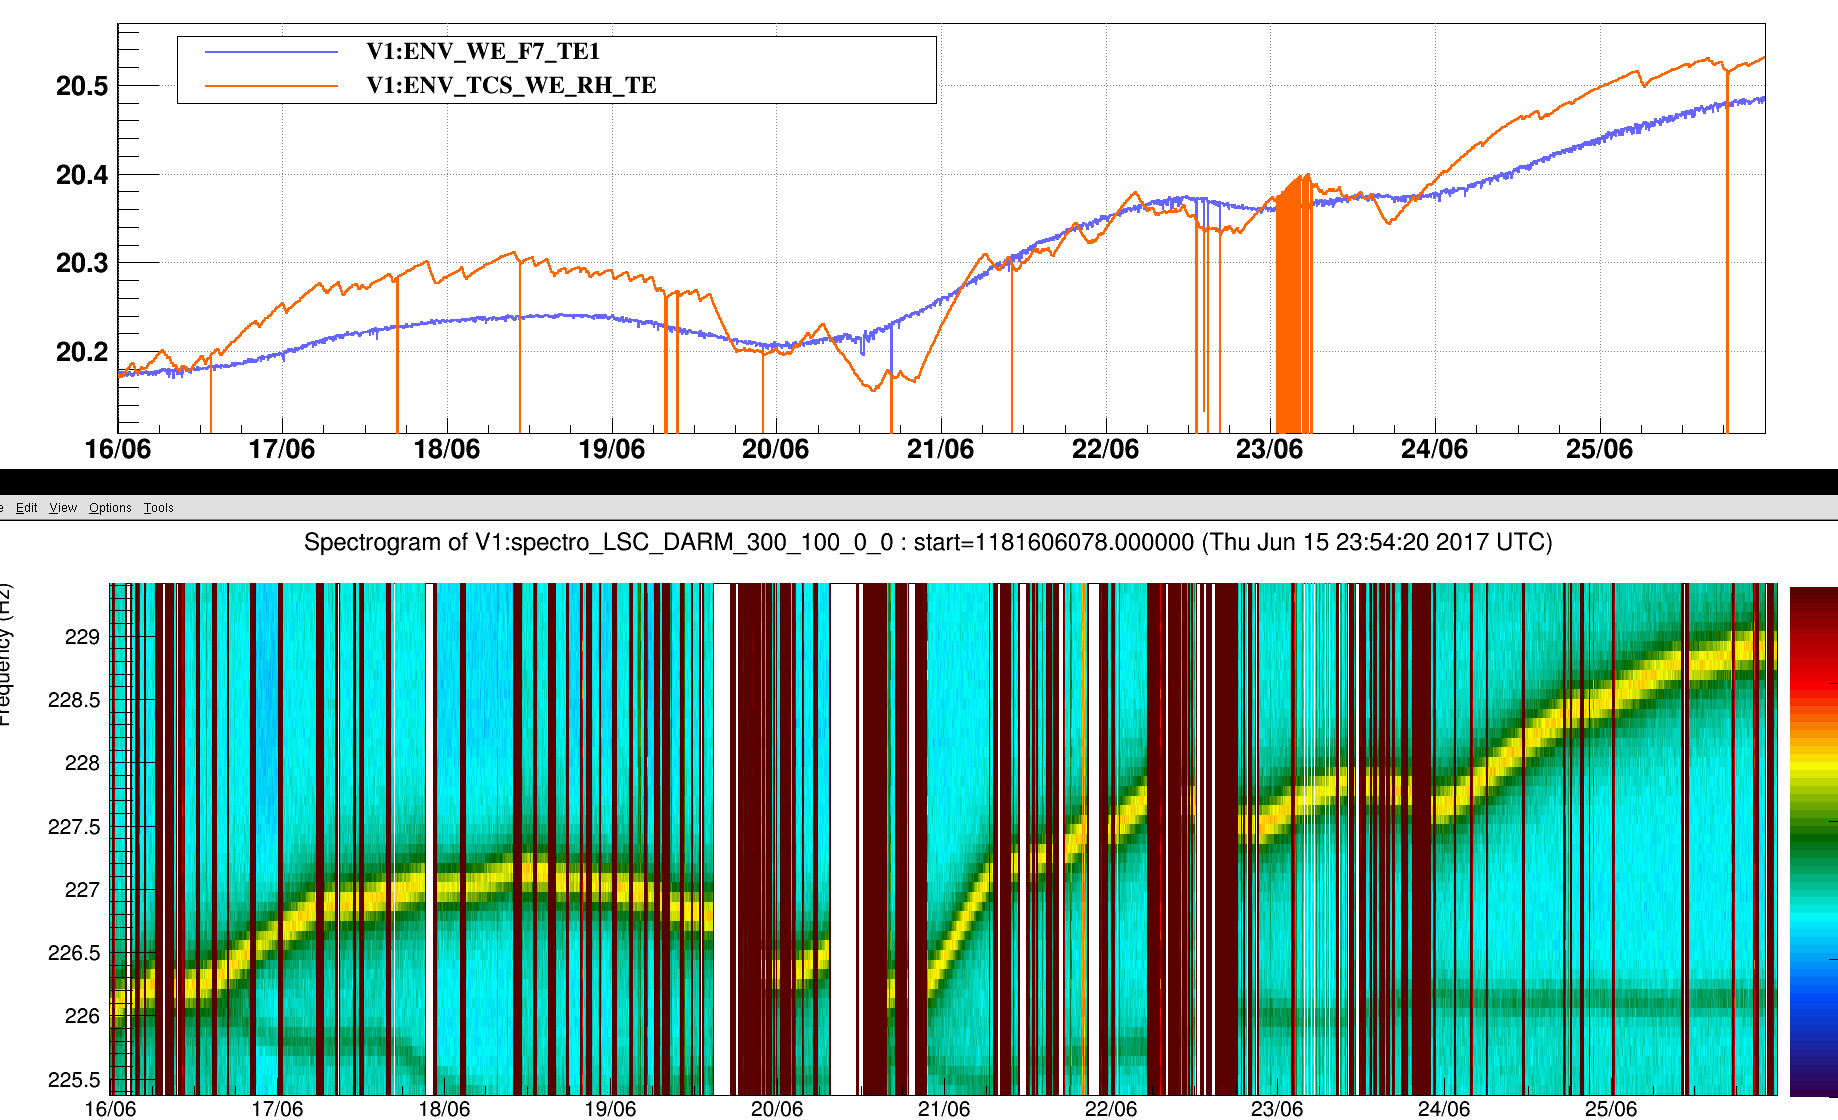
A visual inspection of DARM drifting lines over a 10 day period seems to confirm the correlation with in-tower temperature sensors that was found by the brute force correlation analysis done over ER11/a.
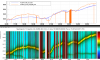
Attached are some spectrogram (**) shots of the forest of drifting peaks: Figure 1, Figure 2
We tentatively found two families of peaks:
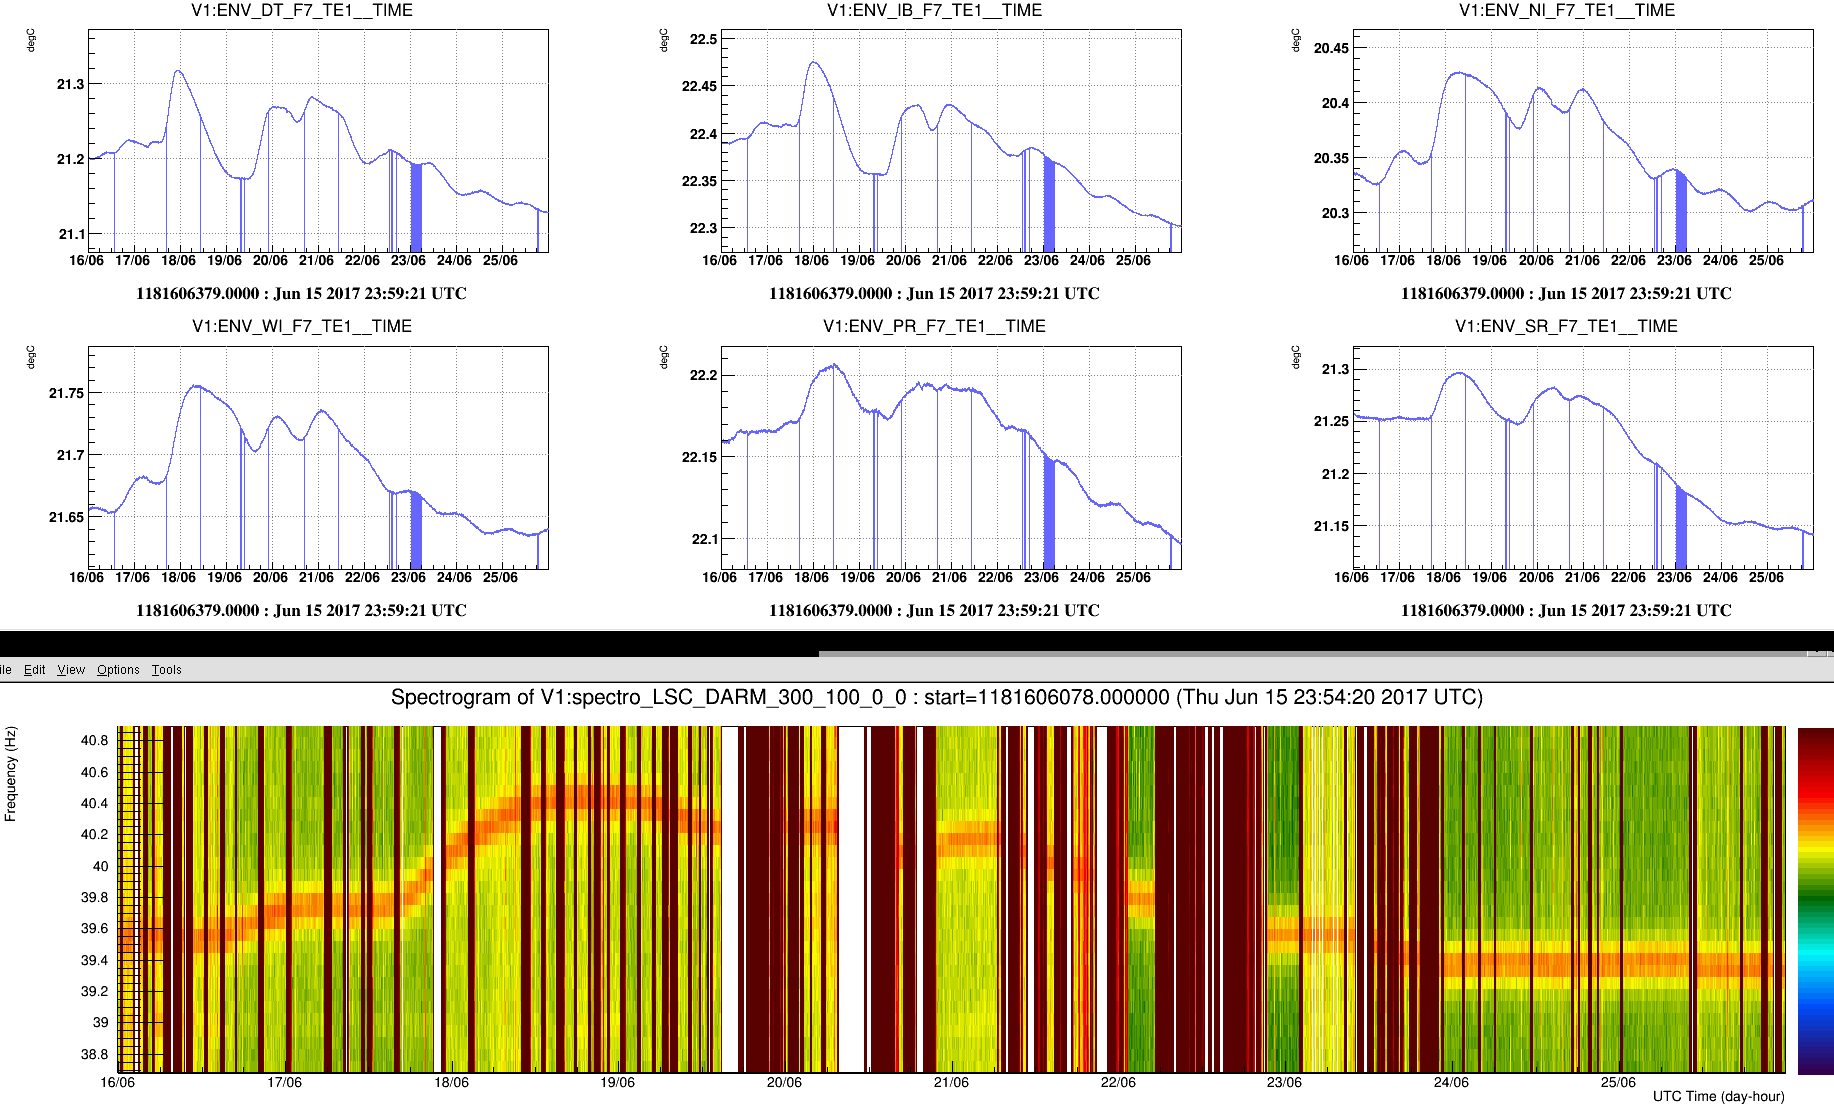
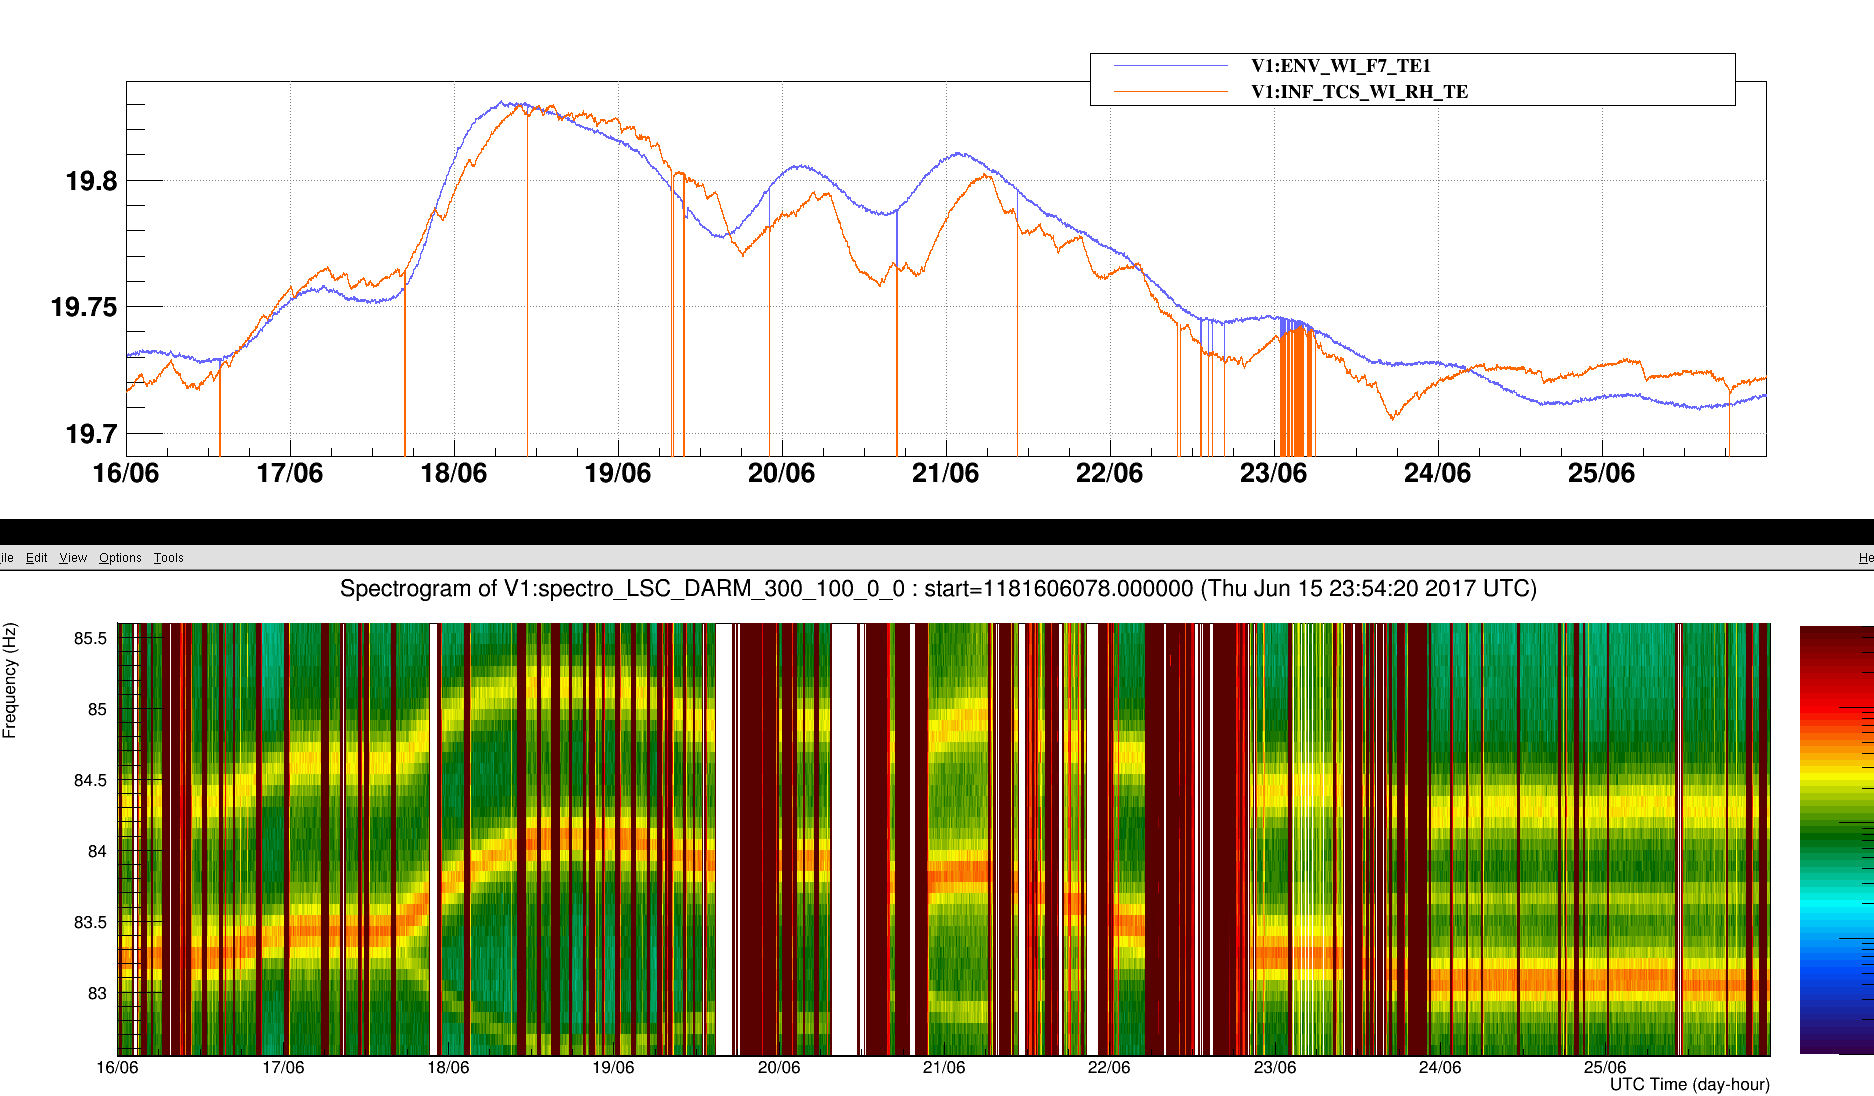
- peaks whose frequency drift correlates (or anti-correlates) with the temperature of CEB towers. Among which the one that qualitatively matches best are sensors at the level of F7 or RH inside WI tower (Figure 3, Figure 4)
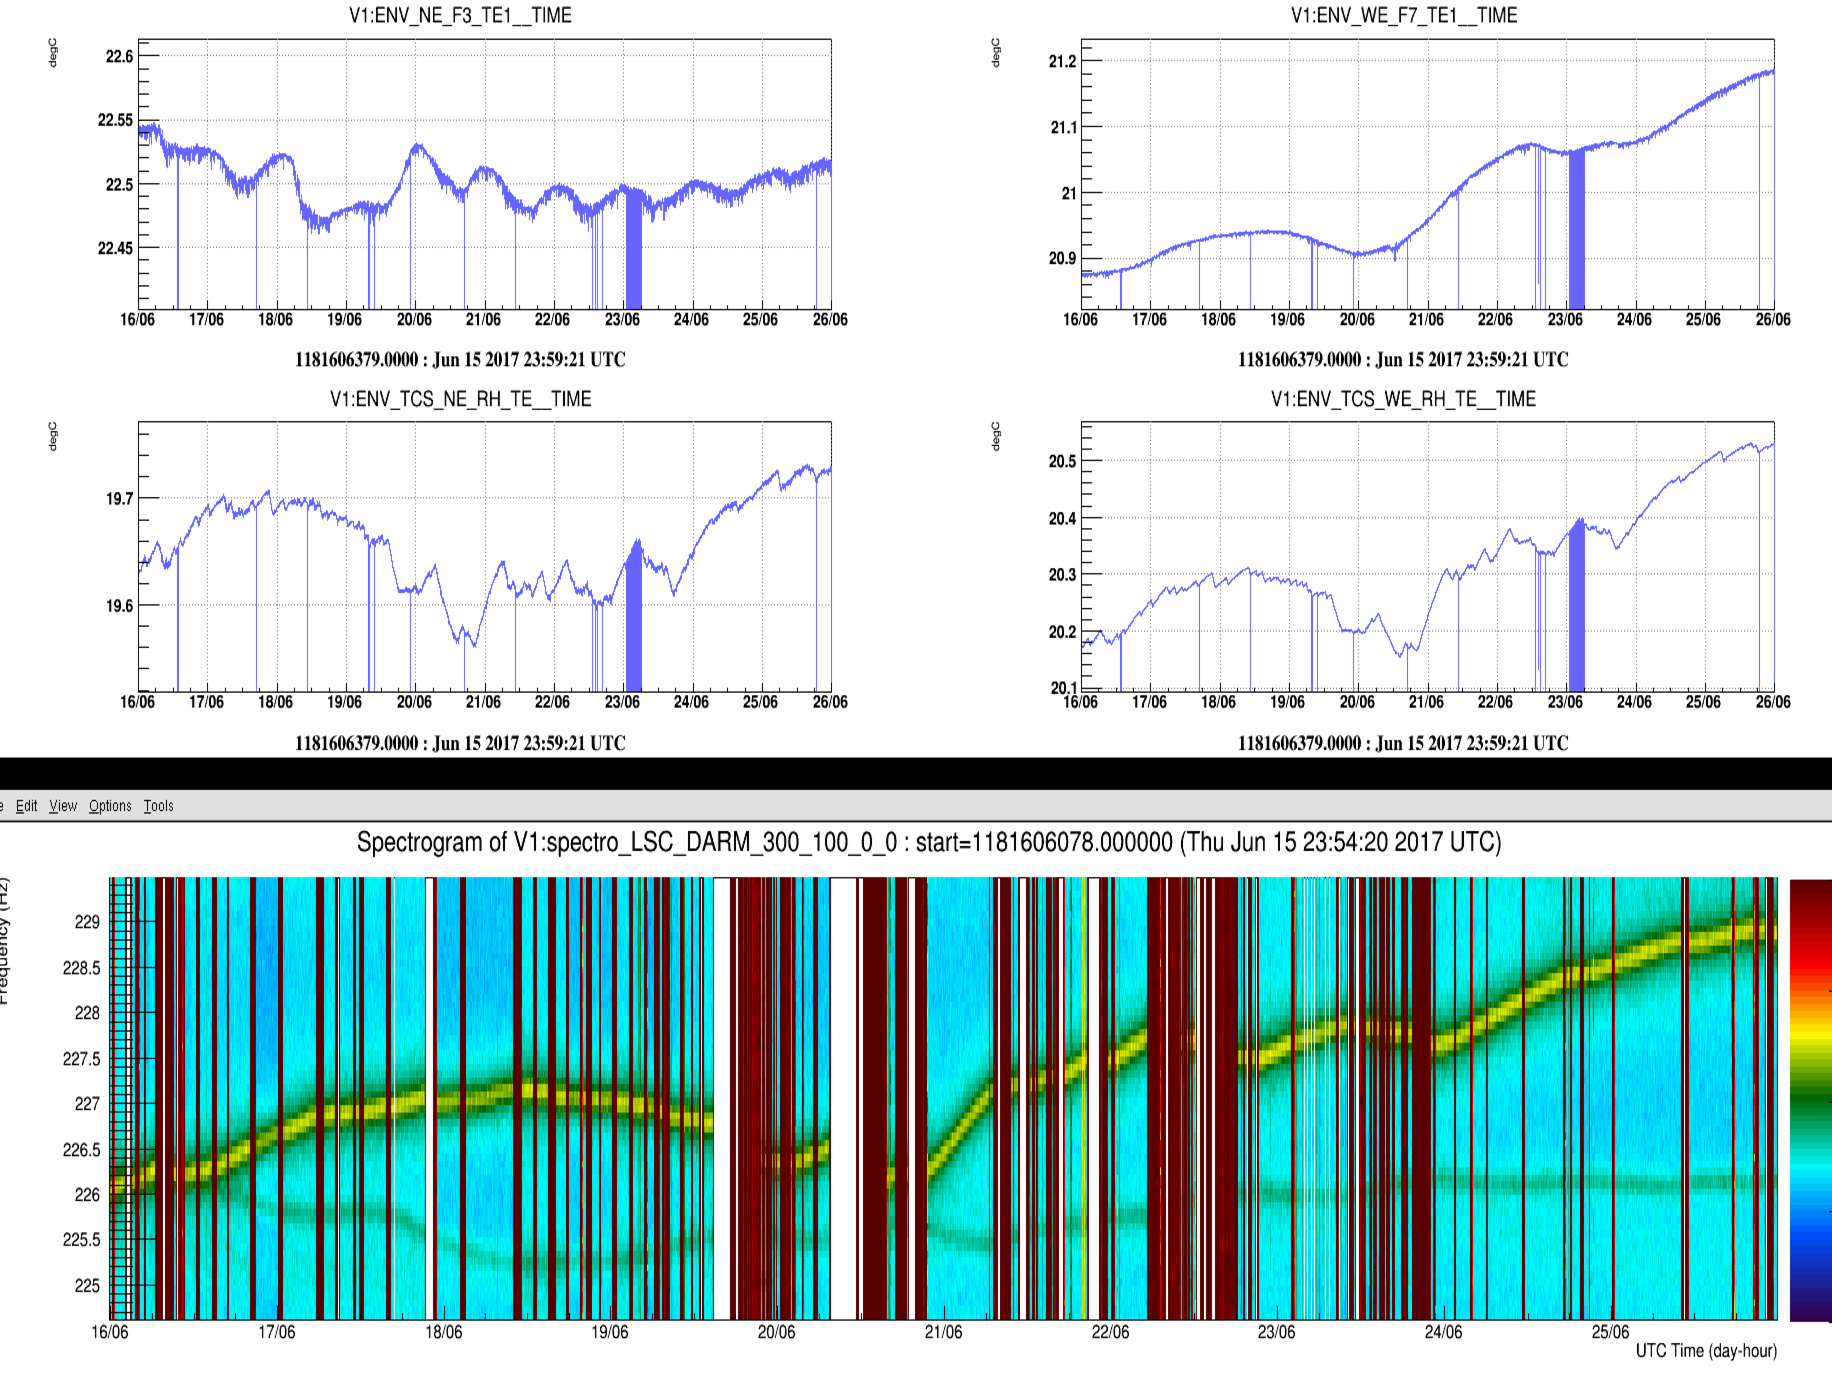
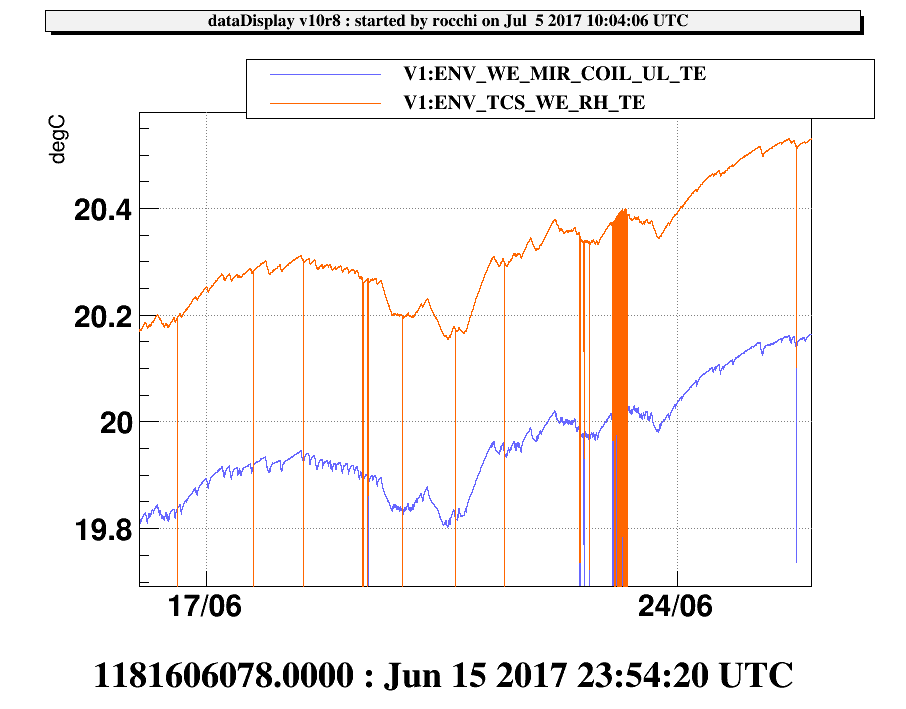
- peaks correlating (or anti) with the WE tower temperature sensors (Figure 5). A deeper insight among WE tower temperature sensors shows a visually good correlation with the TE sensor at the WE ring heater (Figure 6)
These qualitative observations have to be verified with correlation analyses.
--------------------------------------------------------------------------------------------
(**) this is magic Didier's command to get this spectrogram:
$ROOTROOT/$UNAME/bin/root.exe -l /opt/w3/vim/spectro/spectro_auto.C\(\"LSC_DARM\",1181180000,864000,0.1,0,500,0,0,0\)
plus you need to have the file .rootrc in your home dir:
cat ~fiori/.rootrc
Unix.*.Root.DynamicPath: .:$(ROOTSYS)/$(UNAME):$(ROOTSYS)/lib:$(FRROOT)/$(UNAME)
Unix.*.Root.MacroPath: .:$(ROOTSYS)/macros:$(FRROOT)/root
Rint.Logon: $(FRVROOT)/root/FrvLogon.C
Rint.History: $(HOME)/.root_hist
Attached are two files corresponding the families of drifting lines seen throughout ER11/a and /b. These families have been associated qualitatively with WE and WI temperature sensors respectively. However, a brute correlation is being run with all temperature channels to provide a quantitative confirmation.
Attached are plots highlighting the lines previous noted to be moving in frequency. These figures are divided into 100Hz bands from 0 to 500Hz. The lines with the box outline correspond to the family potentially associated with WI, and the filled box is the family potentially associated with the WE. It's worth noting the initial list of lines generated was only from 0 to 500Hz, so there may be more lines in the families above 500Hz.
Paolo discussed lately this matter on Friday in order to asses some conclusions concerning the need of opening the bottom parts of WI vacuum chamber in order to fix
a possible problem on F7 filter. SOME SIMPLE CONSIDERATIONS DESERVE TO BE REPORTED HERE.
Some activity after the tests of moving SDB1/2 VS illuminated spots on the benches was performed, in spite of the fragility of the locks, from the night of THU and FRI afternoon.
I synthesise here, further entries will follow later. At first I remark that two TF measurements shown in https://logbook.virgo-gw.eu/virgo/?r=38167 have to be redone. During the check Paolo improved the driving. Now it's OK.
1) In general WI,WE payload appear softer than NI,NE. Notice that the lines moving in frequency as the Temperature of F7/actuation-cage are those of WI and WE.
2) It is easy excite the peaks of WI payload, as shown in https://logbook.virgo-gw.eu/virgo/?r=38167, but the frequencies of those peaks DO NOT MOVE
=> The peaks moving in frequency, as shown by Irene et Al., are not related to the mechanics neither of payloads nor of related actuation cages
3) Notice that the temperature has of course the same behaviour as F7 LVDT elongation (on the overall chain the effect is smaller).
4) Incidentally we noticed one peak, just above 100 Hz, that could apparently be related to the payload mechanics, and impacts on the sensitivity (it could be cured by accessing it through the bottom flange)
5) No bi-stability: Paolo moved up and own the crossbar of WI F7, rejecting the hypothesis of loose centring wires.
=> NO NEED TO OPEN THE BOTTOM PART OF WI SUSPENSION TO ACCESS AND CURE F7 CROSSBAR
=> POSSIBLE FURTEHR TESTS ARE NEEDED, TO IDENTIFY A NOISE CROSS-COUPLING OF A DISTURBANCE, WHOSE ORIGIN IS STILL UNKNOWN, MODULATED BY RELATIVE POSITION PAYLOAD ACTUATION CAGES (electromagnetic ? other ?).
Another sensor that could be used for the correlations is the termometer on the mirror coil...