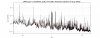
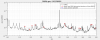
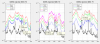
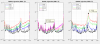
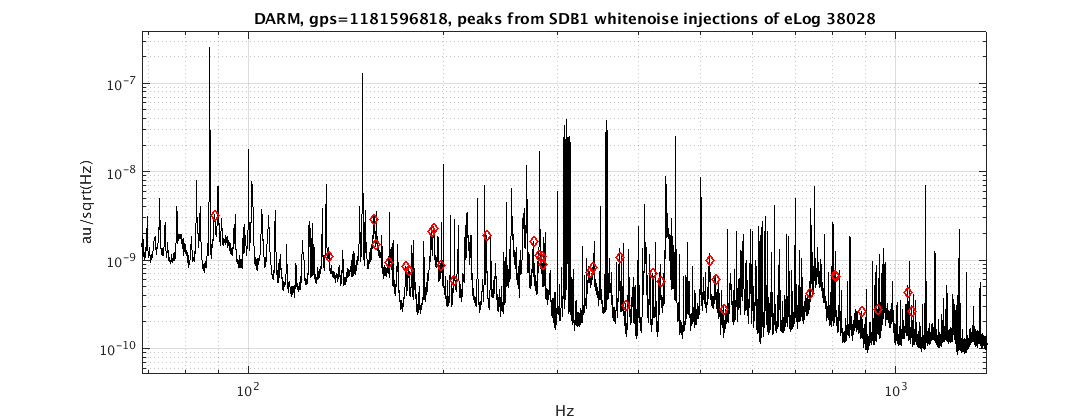
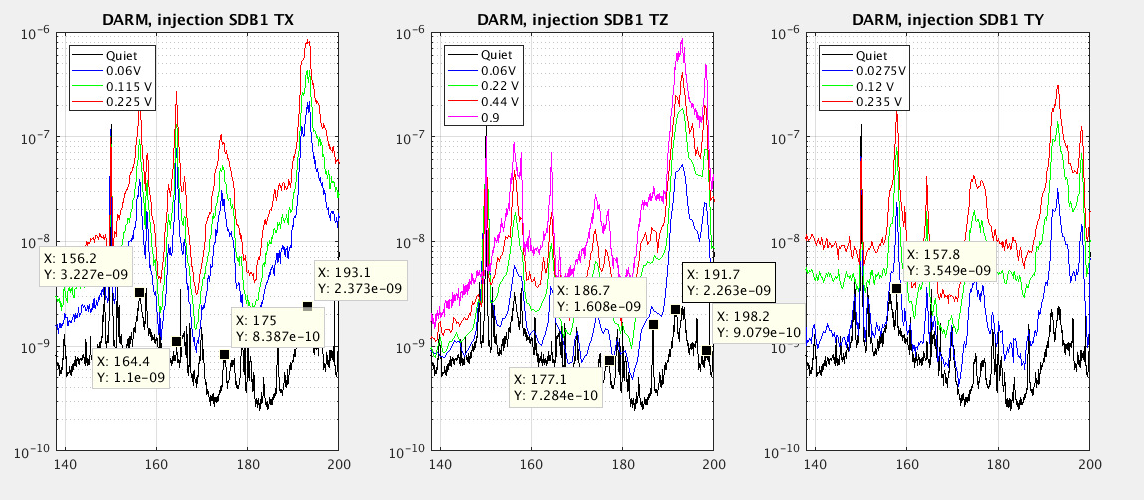
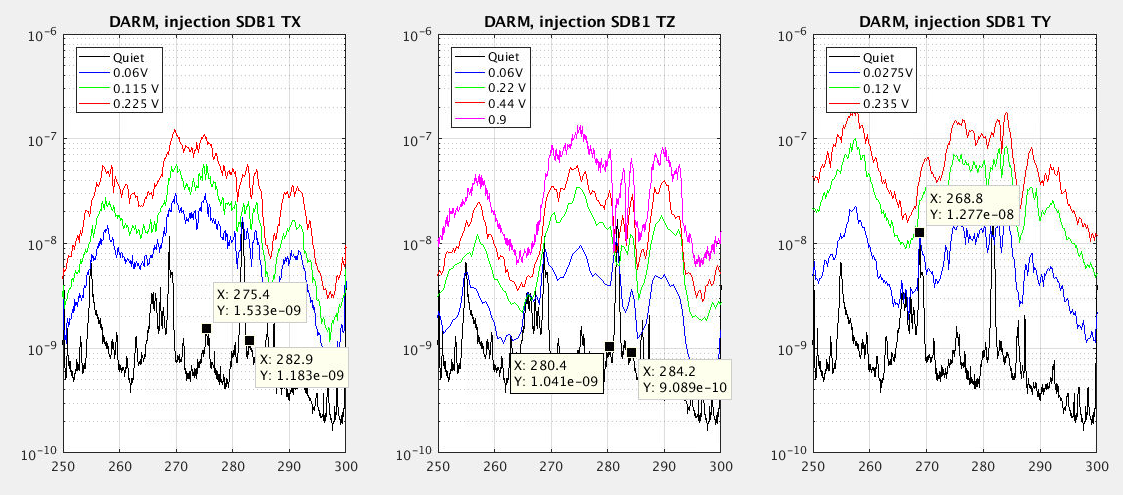
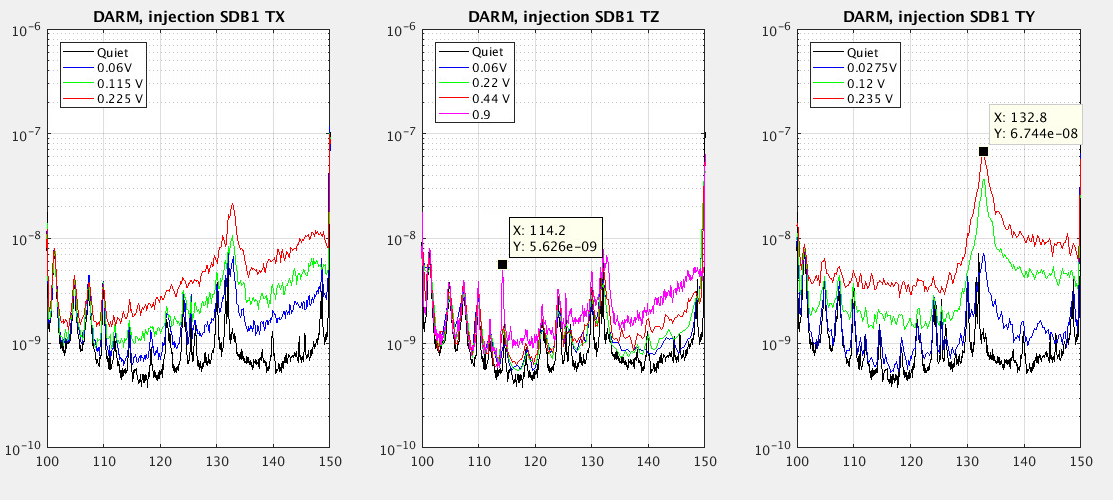
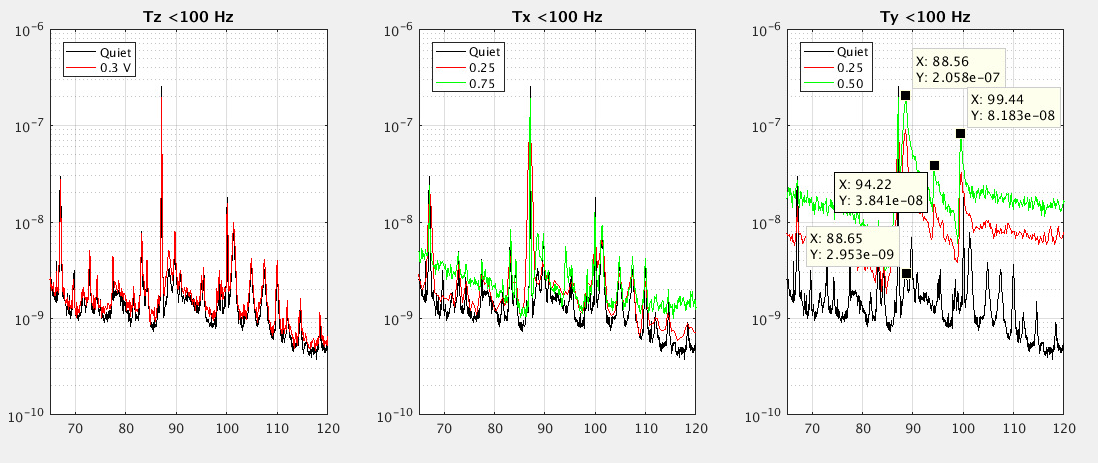
We extracted a tentative list of peaks in DARM which looked excited by the SDB1 white injections. We found about 30 peaks which are displayed in Figure 1 and Figure 2 (zoom-in) and listed below. We list just peaks that we could confidently identify because they are nicely shaped in DARM quiet spectrum and rised quite precisely during the injection (some example of identified peaks in Figures 3, 4 and 5 and 6).
Still many peaks of DARM could not be associated to these shakings (Figure 2 for example). This is either because in some frequency regions the noise rised in wide bumps possibly hiding other peaks excitation (see for example Figure 3,4,5) or because they appeared not to be affected (see for example Figures 5 and 4).
% Hz %dof of injection %comment
29.73 %TX,TY
88.6 %TY %(small)
132.9 %TY %(small)
156.2 %TX
157.4 %TY
164.4 %TX
175.0 %TX
177.1 %TY,TZ
186.7 %TZ,TX
191.7 %TX
193.4 %TX
198.2 %TY,TZ
207.2 %TY %(small)
233.3 %TX,TZ %(not sure association to DARM structure)
275.3 %TX
280.4 %TX %(small)
283.2 %TX %(small)
284.4 %TX %(small)
336.0 %TX %(broad peak)
340.7 %TX %(broad peak)
374.5 %TZ
382.1 %TZ
421.7 %TZ
433.2 %TY,TZ
515.8 %TZ
526.3 %TZ
541.6 %TZ
737.4 %TZ
804.8 %TZ
806.4 %TZ
884.5 %TX
938.9 %TZ
1045 %TZ
1058 %TZ

