Reports 1-1 of 1 Clear search Modify search
AdV-COM (AdV commissioning (1st part) )
hoak, gouaty, ruggi, enomoto, nagano, fidecaro - 1:38 Friday 16 June 2017 (38028) Print this report
SDB1 excitations - many mechanical resonances between 100-1000Hz

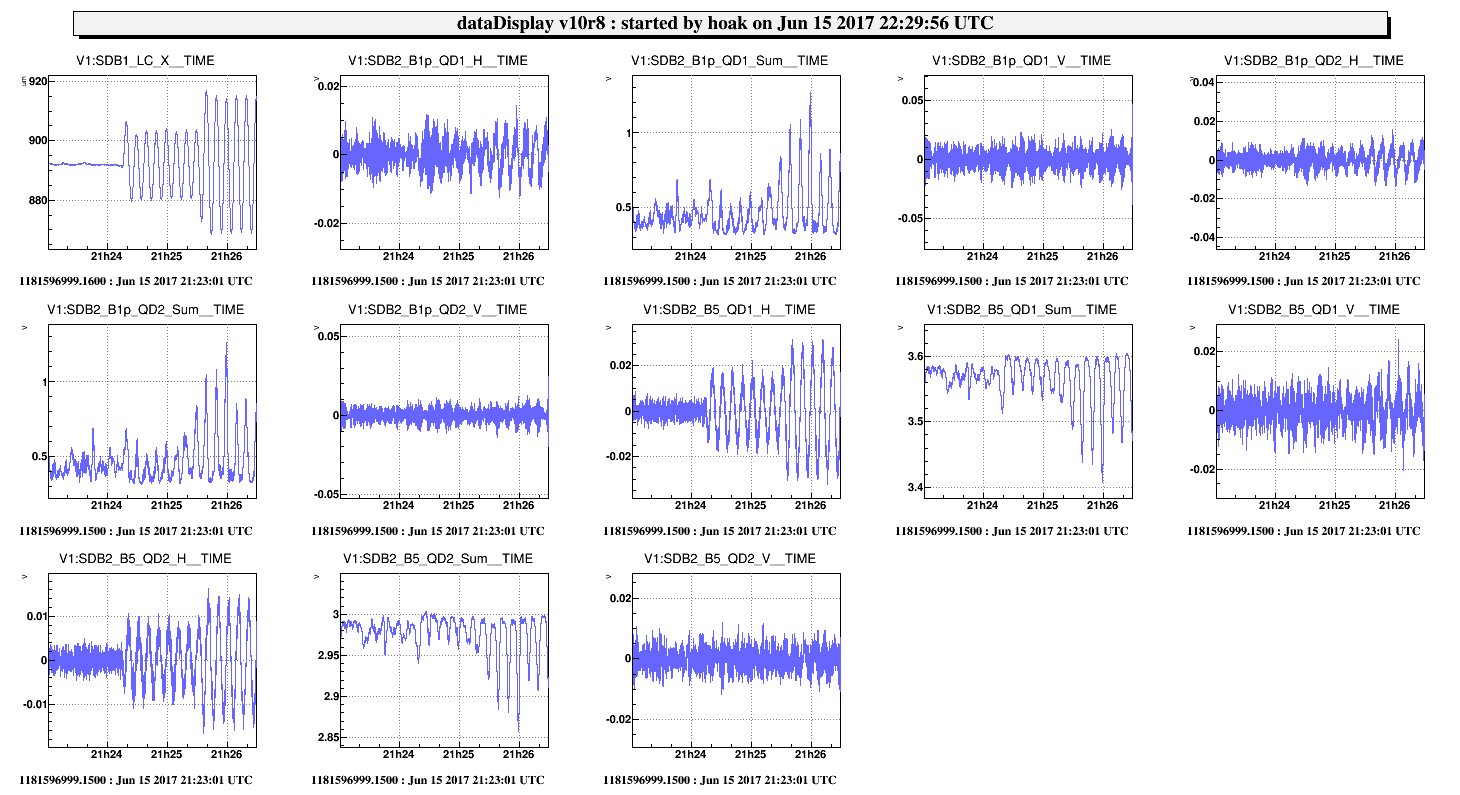
Tonight we made a series of noise injections to the SDB1 bench.  First we did low-frequency sine waves into the Z and X directions, then we made broadband noise injections into the angular degrees of freedom.

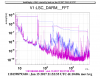
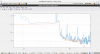
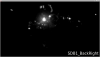
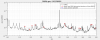
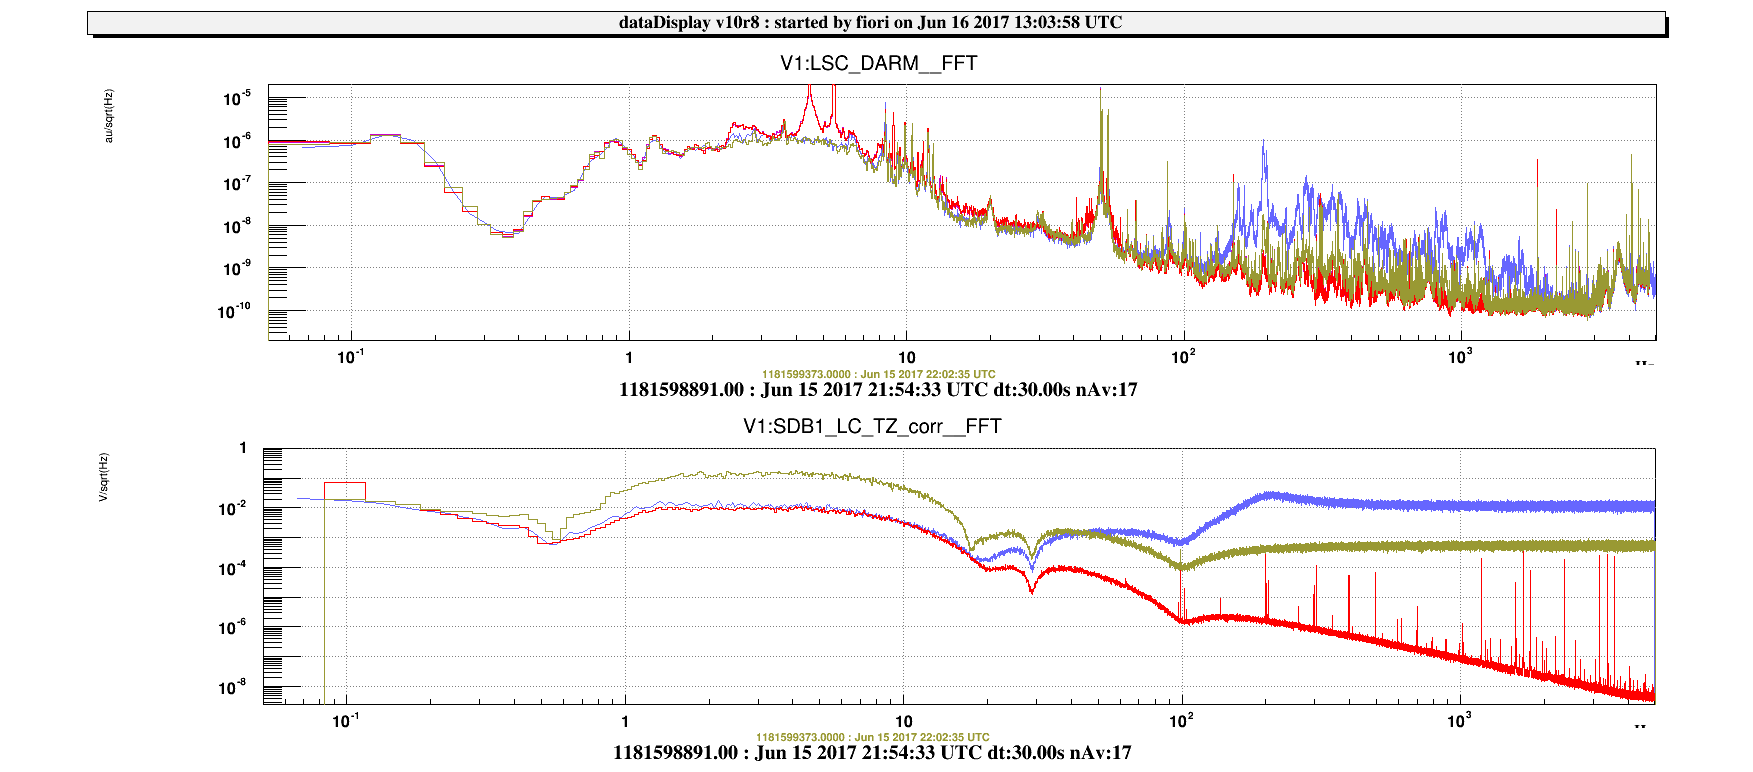
The Z-direction excitation produced a clear scattering shelf, see Figure 1.  This is similar to what we observed when SDB2 was similarly excited last week.

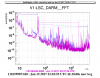
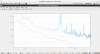
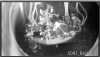
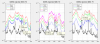
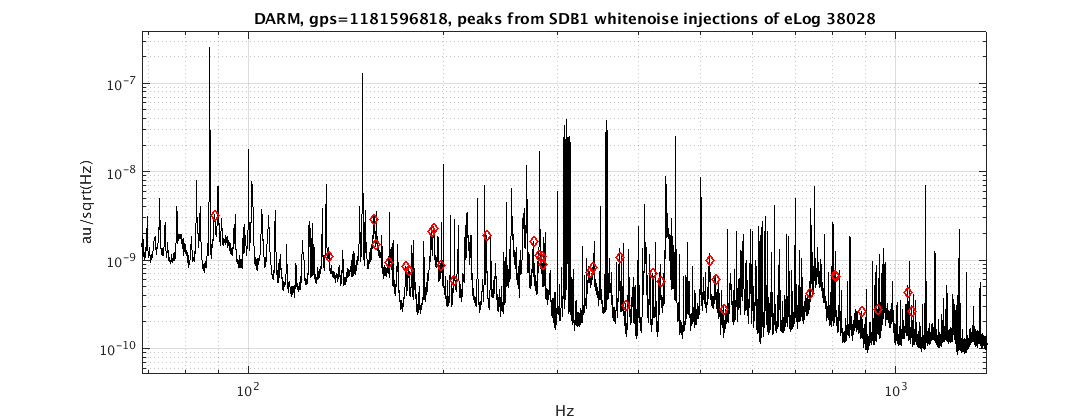
The X-direction excitation caused the B5 quadrants to become misaligned, and this subsequently caused the BS to become misaligned.  See Figure 2


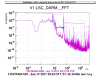
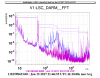
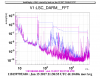
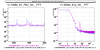
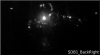
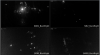
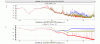
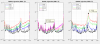
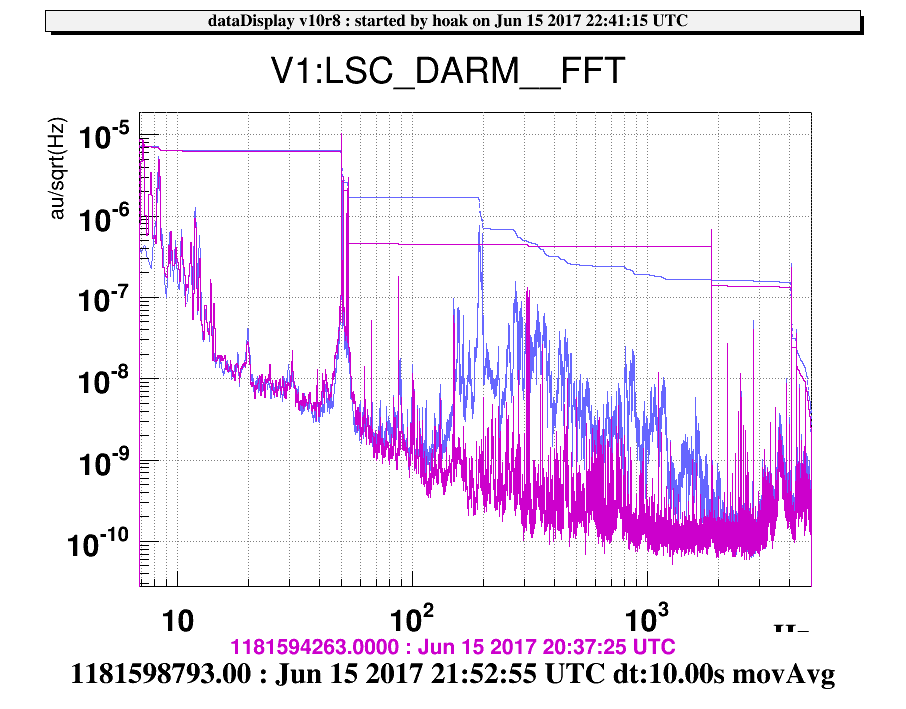
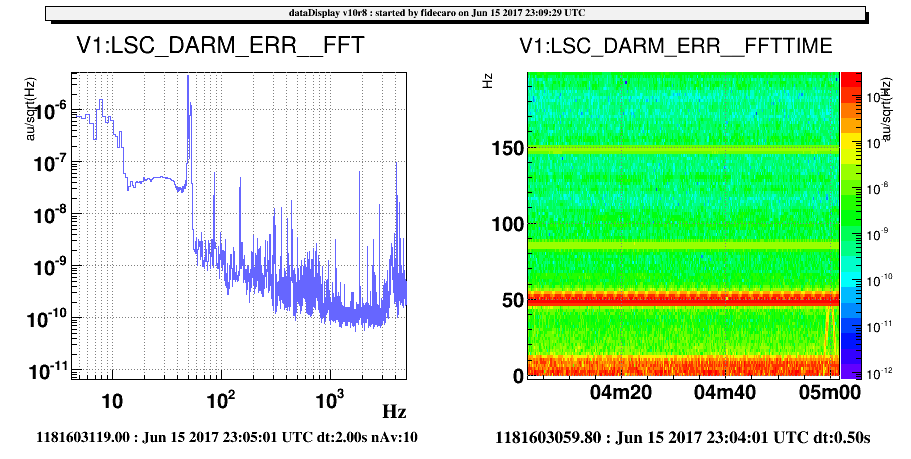
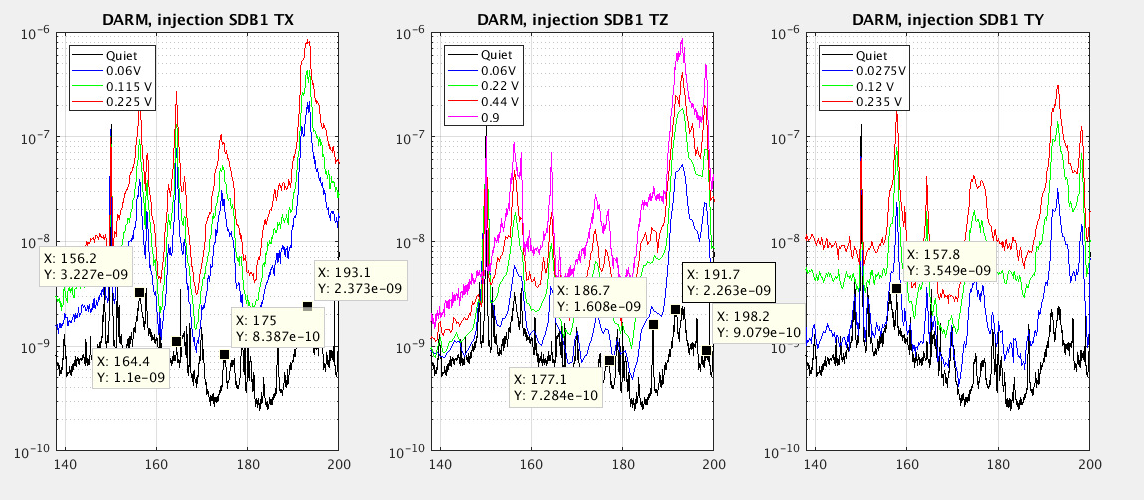
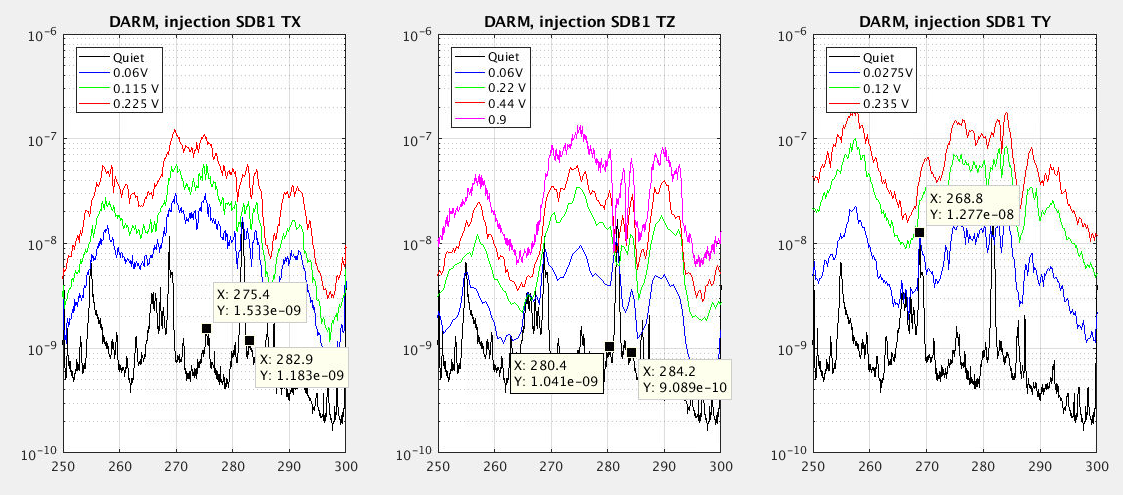
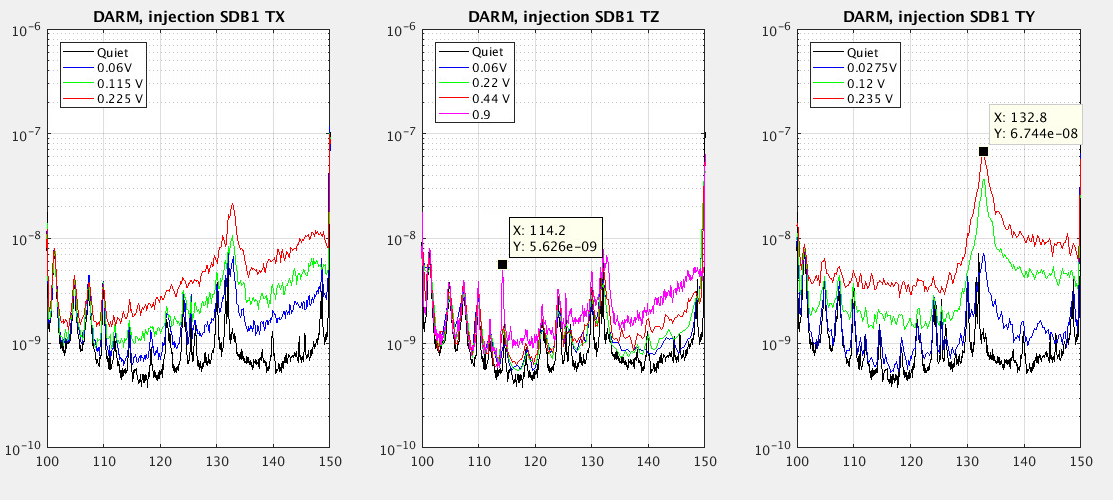
The most interesting results were from the broadband noise injections to SDB1 LC TX, TY, and TZ.  Romain constructed a few filters that injected a lot of noise above 100Hz.  This excited many features in the DARM spectrum, for example the line at 190Hz that Paolo observed to breath with the alignment of the bench, and many other features.  See Figures 3, 4, and 5.  There's a lot of features to explore.

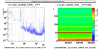
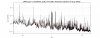
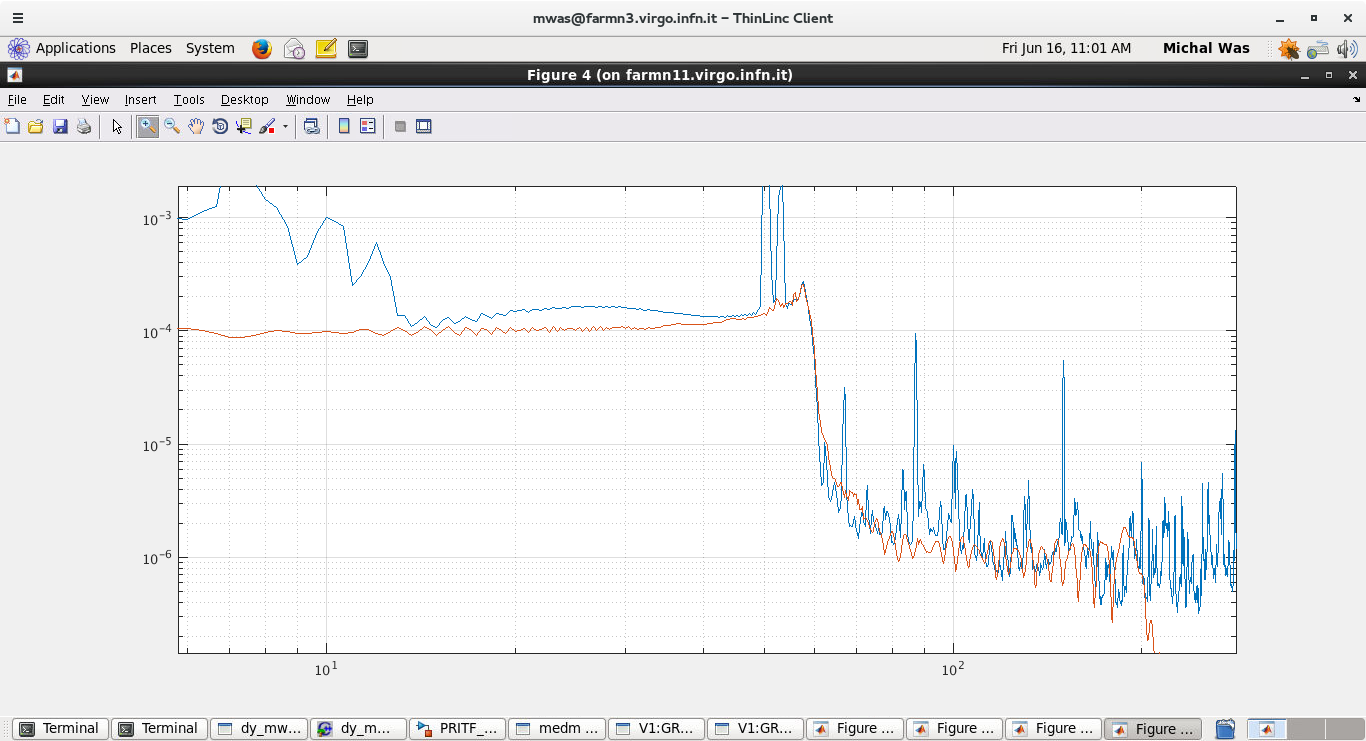
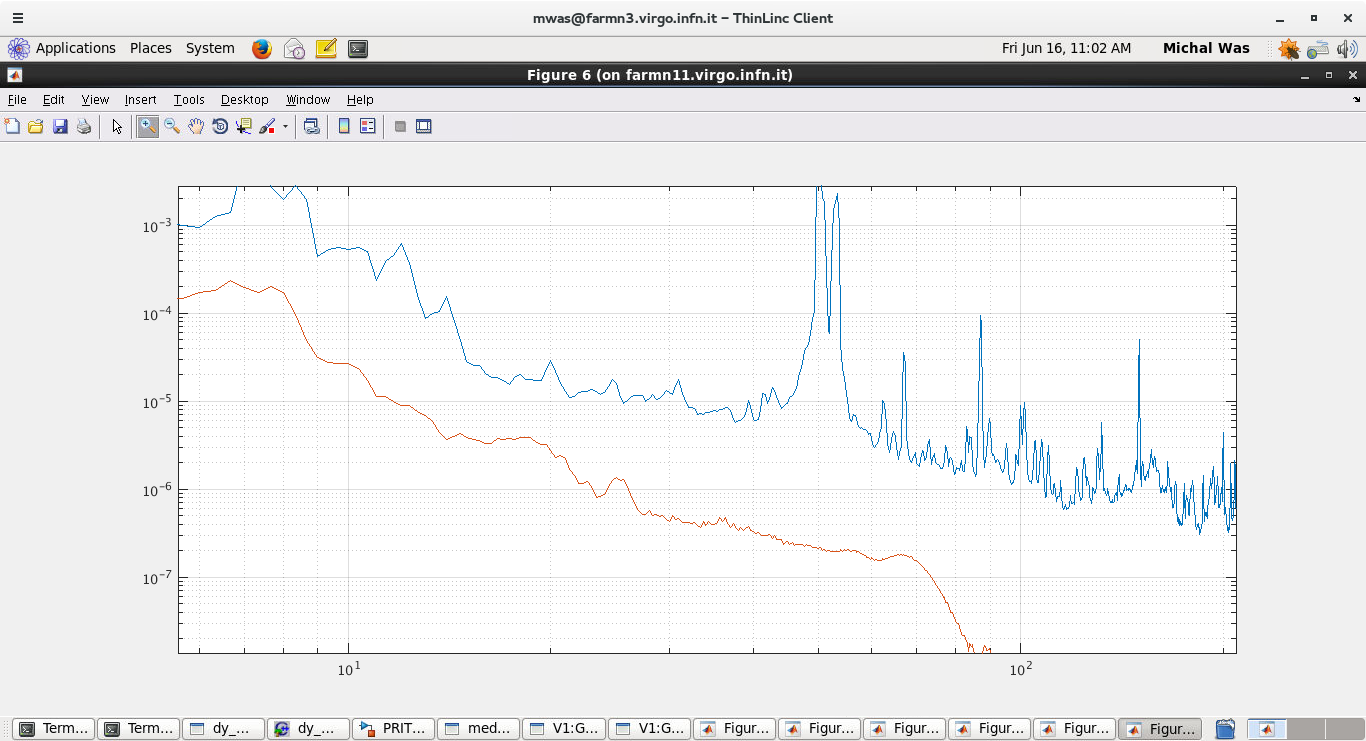
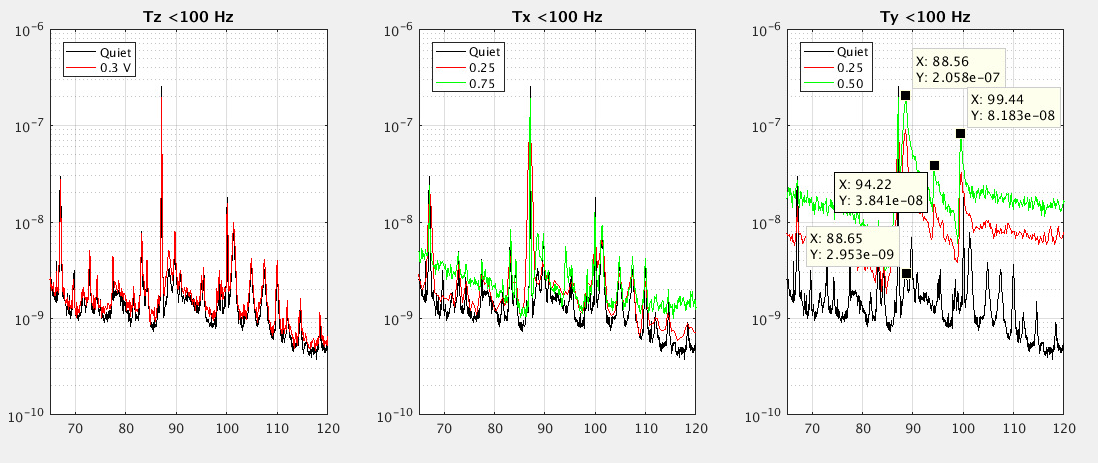
Romain also made injections to SDB1 LC TX and TY with white noise, to see if we could increase the DARM noise below 100Hz.  In fact we could, and in a smooth way.  See Figures 6 and 7.


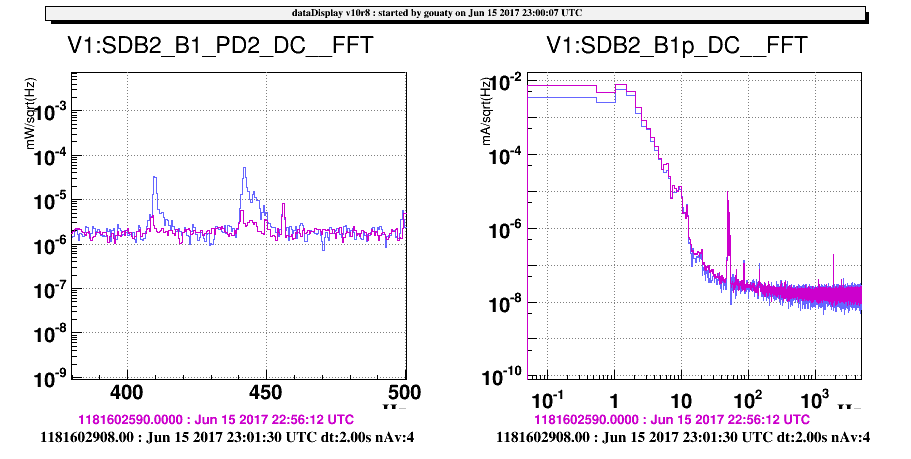
We also went to the detection lab and waved an IR card in front of the B1s1 beam on EDB.  There was no scattering noise in DARM, so probably it's ok for this beam to come out of the vacuum.  We made some tap tests of EDB and SDB2, there is a ~450Hz line that can be excited when we tap on the SDB2 doors, see Figure 8.  Also pushing on the EDB side of the SDB2 tower causes scattering shelves, see Figure 9 -- this could be moving the whole bench and causing the same scattering that we see when we make a low-frequency Z injection.

The switch to BS low noise is working, but Paolo found the marionette reallocation needs to be tuned, so we have commented the lines in metatron that switch the BS coils to low noise.

Images attached to this report
Comments to this report:
mwas - 11:11 Friday 16 June 2017 (38034) Print this report
I have looked at the data with the SDB1 slow Z excitation. Using the same method as for SDB2 and the SDB1-SDB2 as the position signal works very well.

Figure 1, the observed B1 spectrum and the projected scattered noise. The coupling factor is 3 times larger than for SDB2. So SDB1 is a more critical bench in terms of scattering.

Figure 2, the same for the quite time the noise is about a factor 10 below the sensitivity curve in the 20-80Hz range. So not that far away.

It would be good to look through the viewports with a IR viewer and at the IP cameras to see if there is some obvious source of scattering on SDB1.
Images attached to this comment
Allocca, Trozzo, Fiori - 12:53 Friday 16 June 2017 (38038) Print this report

Figure 1 - screenshot of SDB1_BackRight camera while locked in DC readout. 

Figure 2 - same bench compared to other benches.

It could be useful to switch on a light (in any) in SDB1 to better identify what is the scattering source.

Images attached to this comment
bonnand - 13:42 Friday 16 June 2017 (38039) Print this report

Here is 2 screenshot of SDB1_BackRight IPcam, first one is in DC-readout and second one is with the light from the IP camera on  when the ITF was down (that can be useful to locate the source of the scattered light).

The second image is not that clear and it could be useful to switch on briefly the light spot in the DET tower (plug is in the DET lab) and take again this picture with the IR filter on of the IP cam, that way we could really identify each element with being bothered by the light coming from the ITF. Please contact me so I could set the IP cam properly.

Anyway one can see that there is a lot of scattered light coming from the region of the second parabolic mirror of the mode-matching telescope (SDB1_MMT_M2).

Some others scattered light is visible at a few places, inside the pipe coming from SR, between the 2 OMCs, at the output of the faraday and on the B5 path...

Images attached to this comment
fiori, koley - 15:12 Friday 16 June 2017 (38041) Print this report

For convenience we extracted the GPS times of the noise injections. The attached plot shows the shape of injected noise. The noise "below  100Hz" seems more shaped to excite below 10Hz.

reference gps QUIET = 1181596818.000000   len = 600s

WHITE noise 100-1000Hz
TX
amplitude SDB1_LC_TX_corr_rms, 0.06 V,  gps = 1181597508, 180s
amplitude SDB1_LC_TX_corr_rms, 0.115V,  gps = 1181597698, 140s
amplitude SDB1_LC_TX_corr_rms, 0.225 V, gps = 1181597843, 120s
TY
amplitude SDB1_LC_TY_corr_rms, 0.0275 V, gps = 1181598168, 50s
amplitude SDB1_LC_TY_corr_rms, 0.12 V,   gps = 1181598224, 100s
amplitude SDB1_LC_TY_corr_rms, 0.235 V, gps = 1181598335, 100s
TZ
amplitude SDB1_LC_TZ_corr_rms, 0.06 V, gps = 1181598530, 38s
amplitude SDB1_LC_TZ_corr_rms, 0.22 V, gps = 1181598570, 40s
amplitude SDB1_LC_TZ_corr_rms, 0.43 V, gps = 1181598614, 30s
amplitude SDB1_LC_TZ_corr_rms, 0.9 V,  gps = 1181598651, 250s


WHITE noise below 100Hz
TX
amplitude LC_TZ_corr_rms, 0.3 V, gps = 1181599118, 260s
TZ
amplitude LC_TX_corr_rms, 0.25 V, gps = 1181599658, 50s
amplitude LC_TX_corr_rms, 0.75 V, gps = 1181599710, 220s

TY
amplitude LC_TY_corr_rms, 0.25 V, gps = 1181601675, 120s
amplitude LC_TY_corr_rms, 0.50 V, gps = 1181601811, 180s


Images attached to this comment
fiori, koley - 9:06 Monday 19 June 2017 (38082) Print this report

We extracted a tentative list of peaks in DARM which looked excited by the SDB1 white injections. We found about 30 peaks which are displayed in Figure 1 and Figure 2 (zoom-in) and listed below.  We list just peaks that we could confidently identify because they are nicely shaped in DARM quiet spectrum and rised quite precisely during the injection (some example of identified peaks in Figures 3, 4 and 5 and 6).

Still many peaks of DARM could not be associated to these shakings (Figure 2 for example). This is either because in some frequency regions the noise rised in wide bumps possibly hiding other peaks excitation (see for example Figure 3,4,5) or because they appeared not to be affected (see for example Figures 5 and 4).

% Hz  %dof of injection %comment
29.73 %TX,TY
88.6  %TY  %(small)
132.9 %TY %(small)
156.2 %TX
157.4 %TY
164.4 %TX
175.0 %TX
177.1 %TY,TZ

186.7 %TZ,TX
191.7 %TX
193.4 %TX
198.2 %TY,TZ
207.2 %TY %(small)
233.3 %TX,TZ %(not sure association to DARM structure)
275.3 %TX
280.4 %TX %(small)
283.2 %TX %(small)
284.4 %TX %(small)
336.0 %TX %(broad peak)
340.7 %TX %(broad peak)
374.5 %TZ
382.1 %TZ
421.7 %TZ
433.2 %TY,TZ
515.8 %TZ
526.3 %TZ
541.6 %TZ
737.4 %TZ
804.8 %TZ
806.4 %TZ
884.5 %TX
938.9 %TZ
1045  %TZ
1058  %TZ
 

Images attached to this comment
Search Help
×

Warning

×