Reports 1-1 of 1 Clear search Modify search
Detector Characterisation (Spectral lines)
mwas - 16:27 Wednesday 20 March 2024 (63680) Print this report
Moving line at ~9kHz

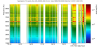
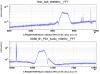
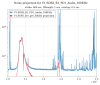
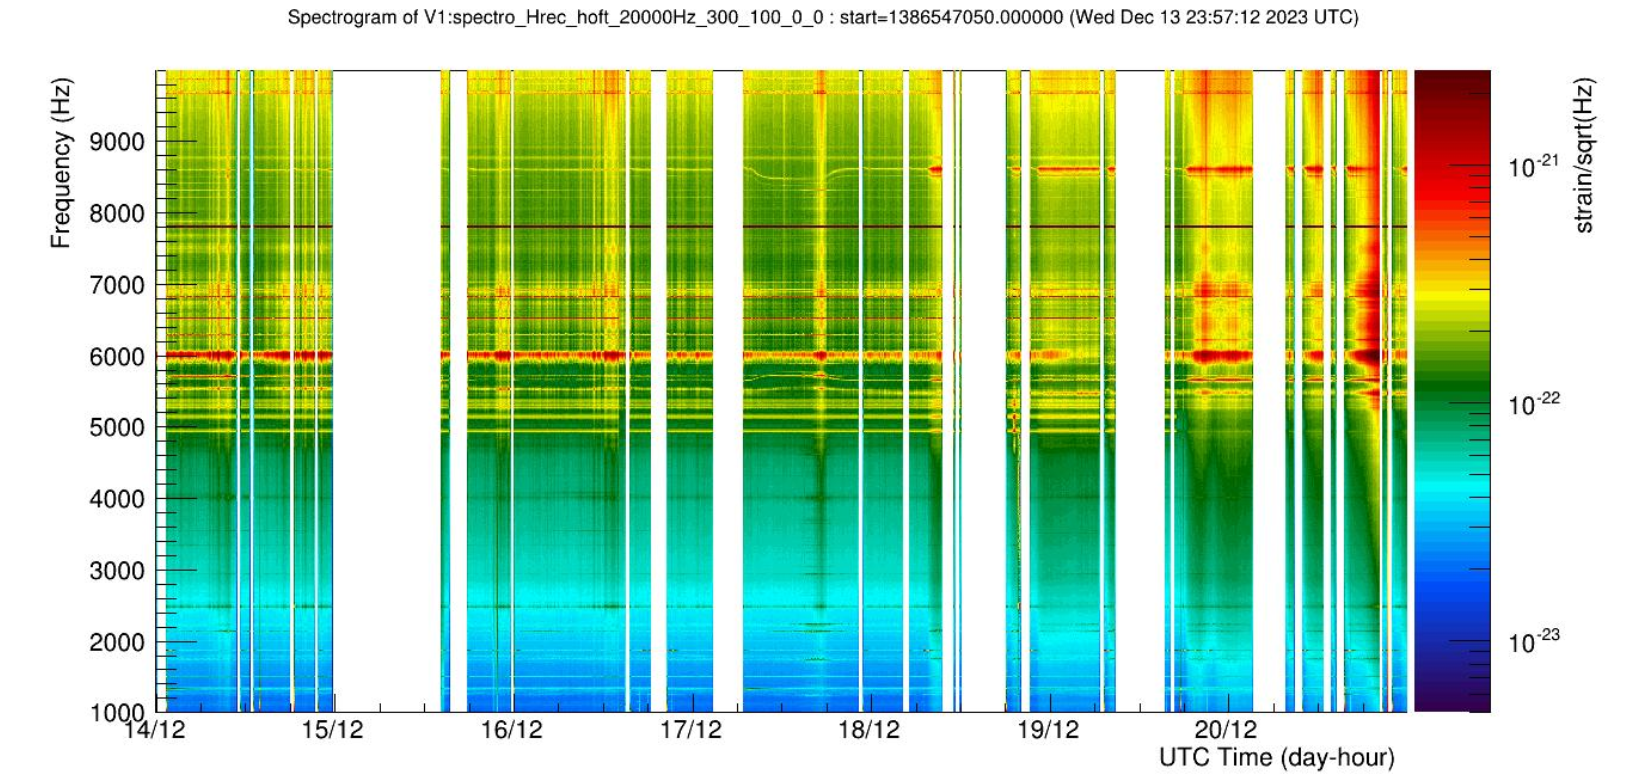
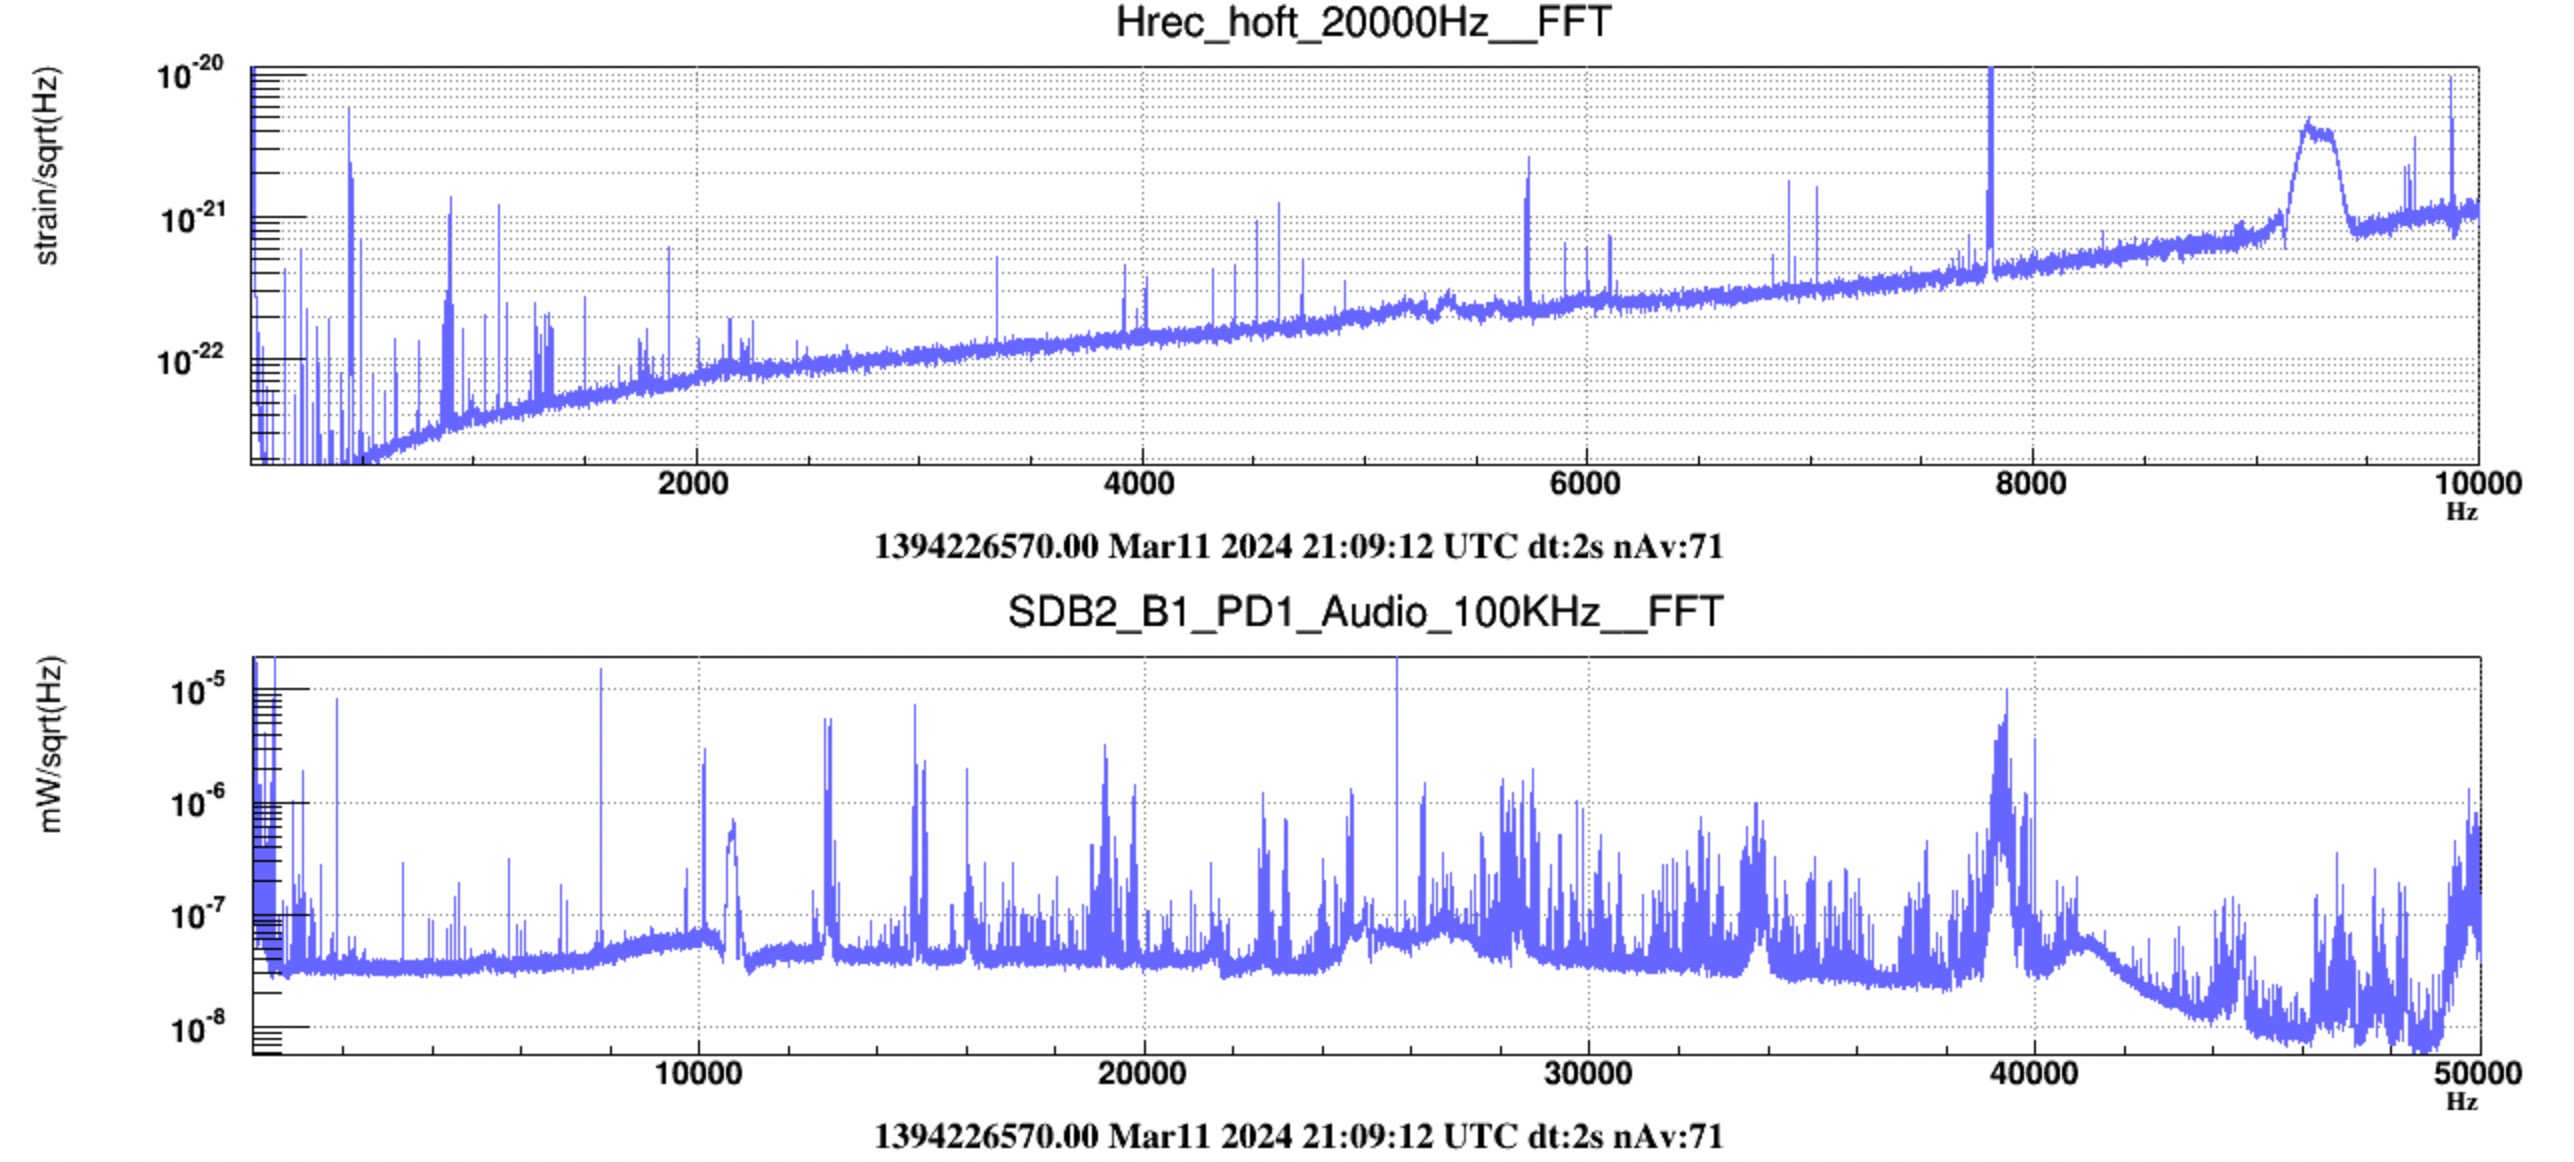
There is a line at ~9kHz that is very loud in the spectrum.

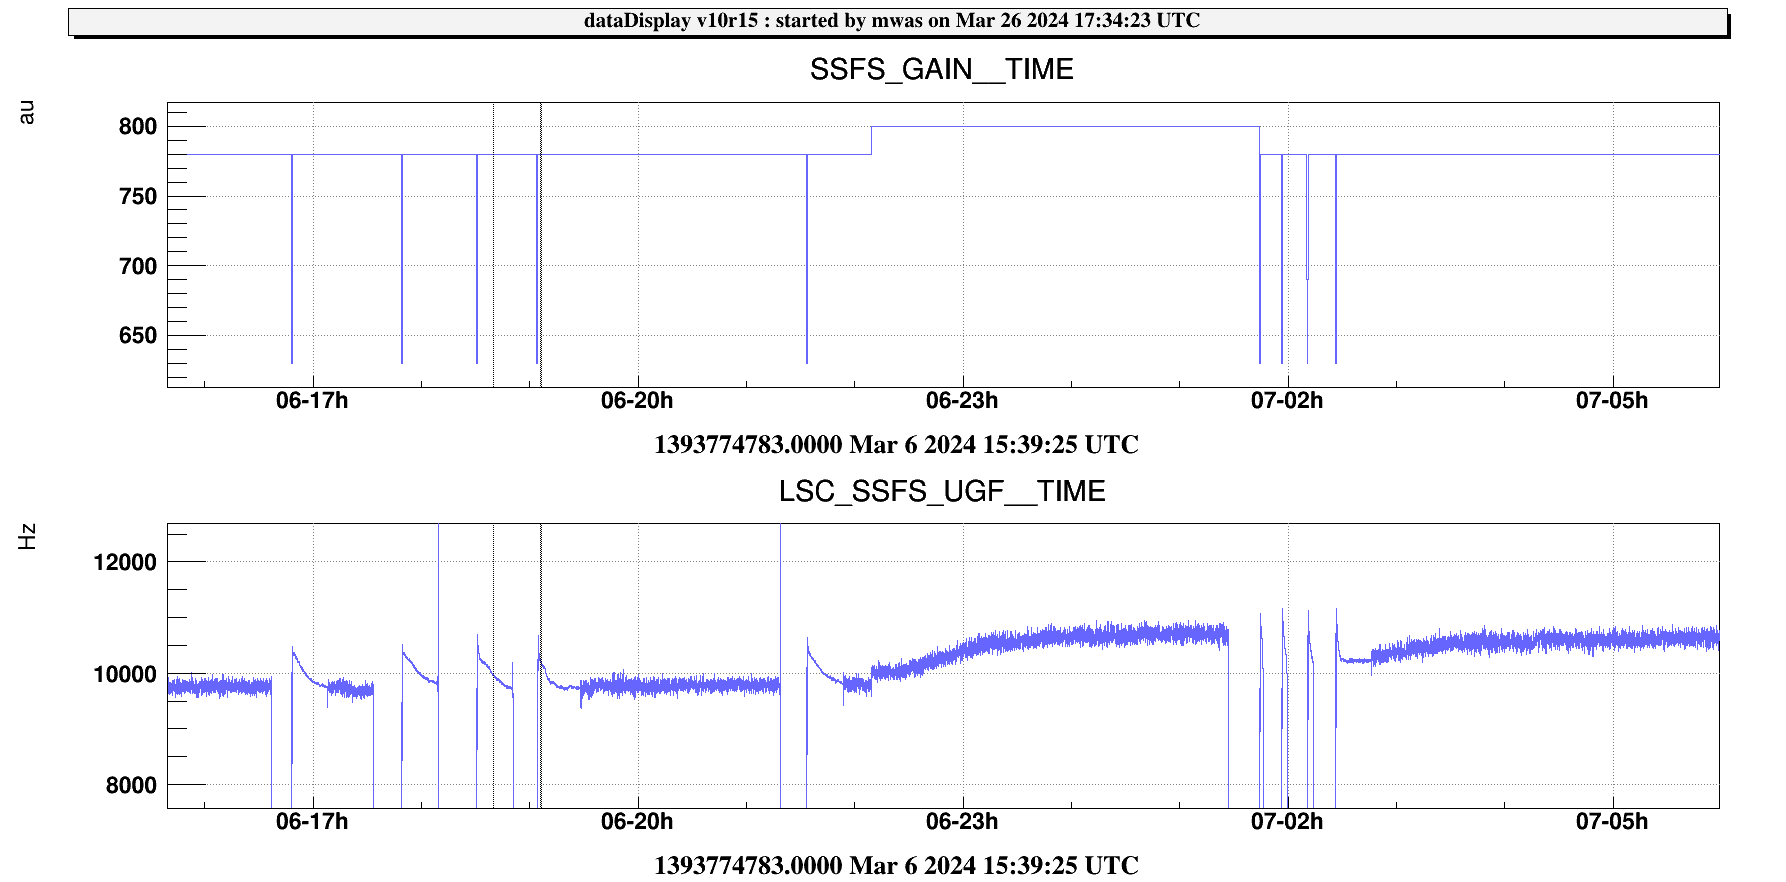
Figure 1. It started to be more visible on Dec 18. And has moved in frequency in steps getting progressively louder over the past 3 months.

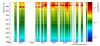
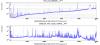
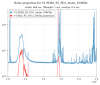
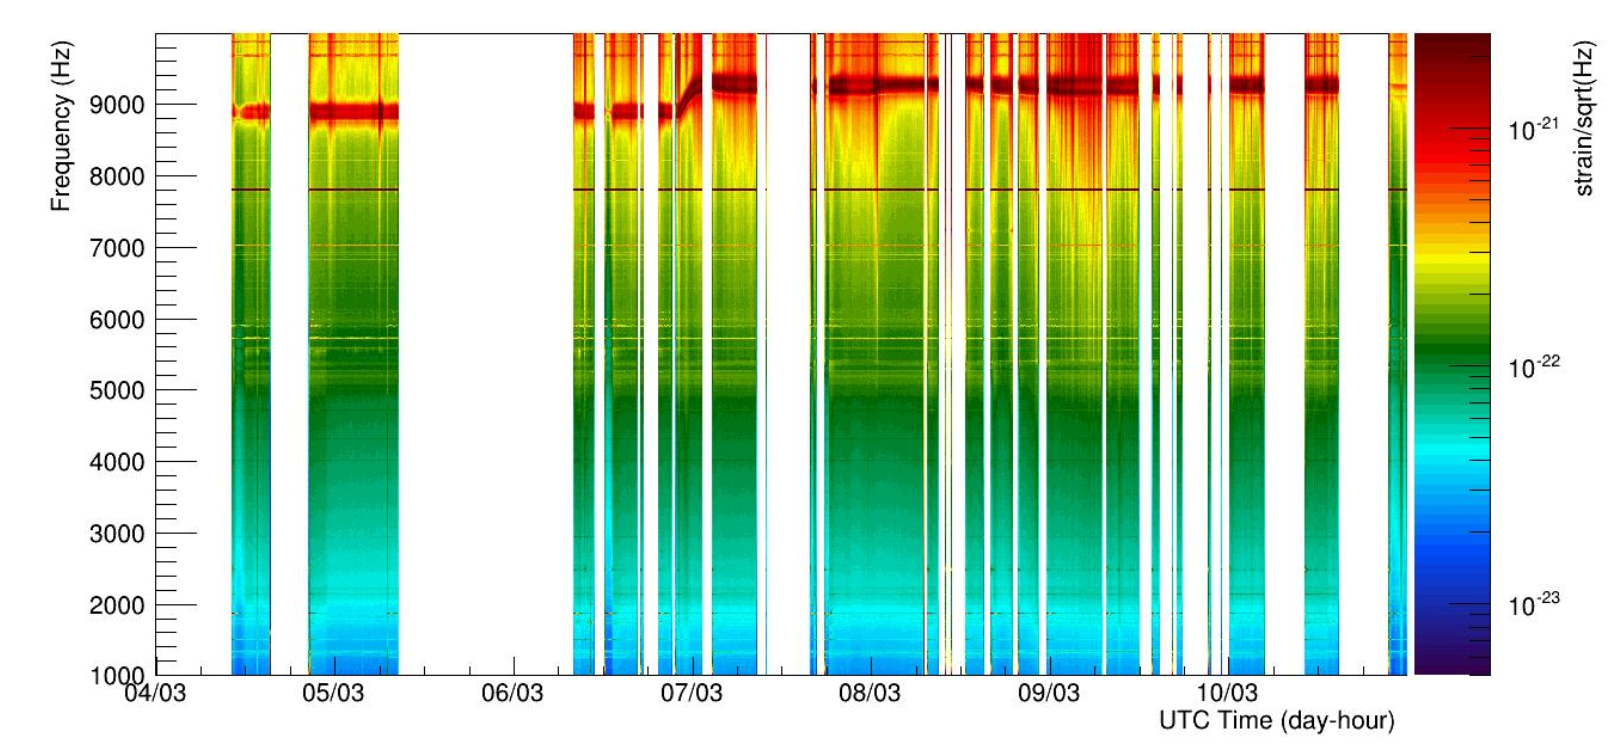
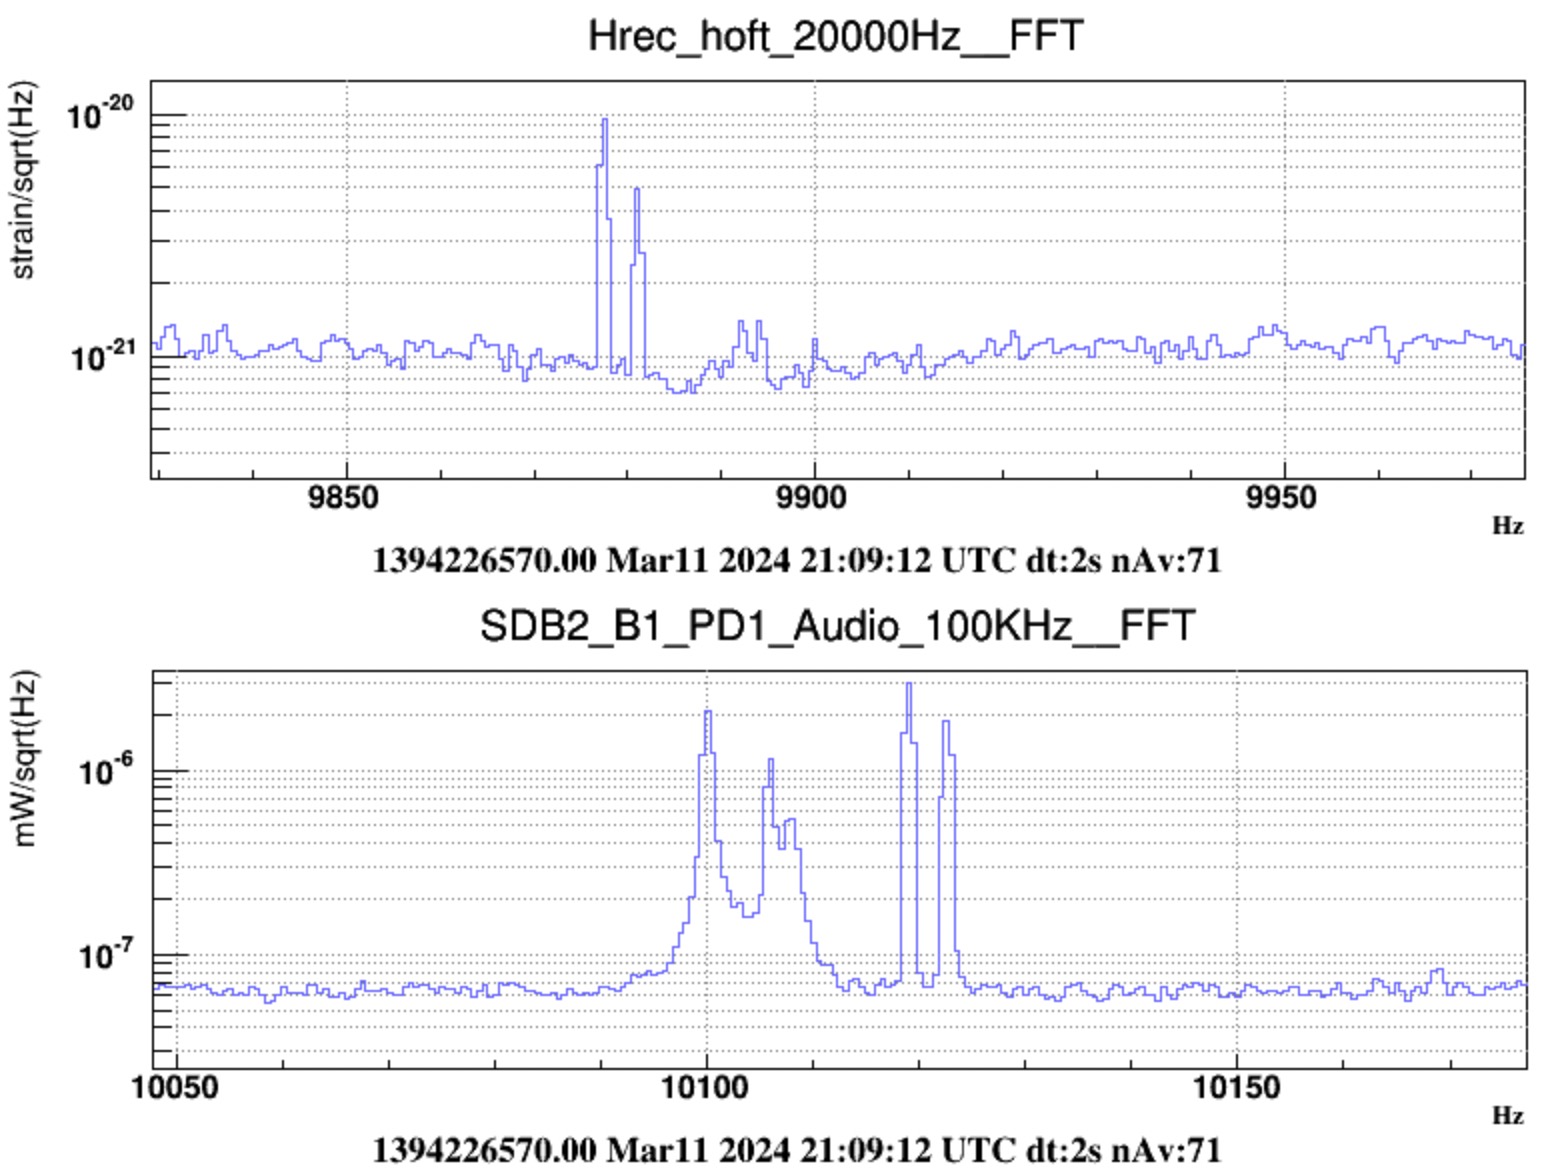
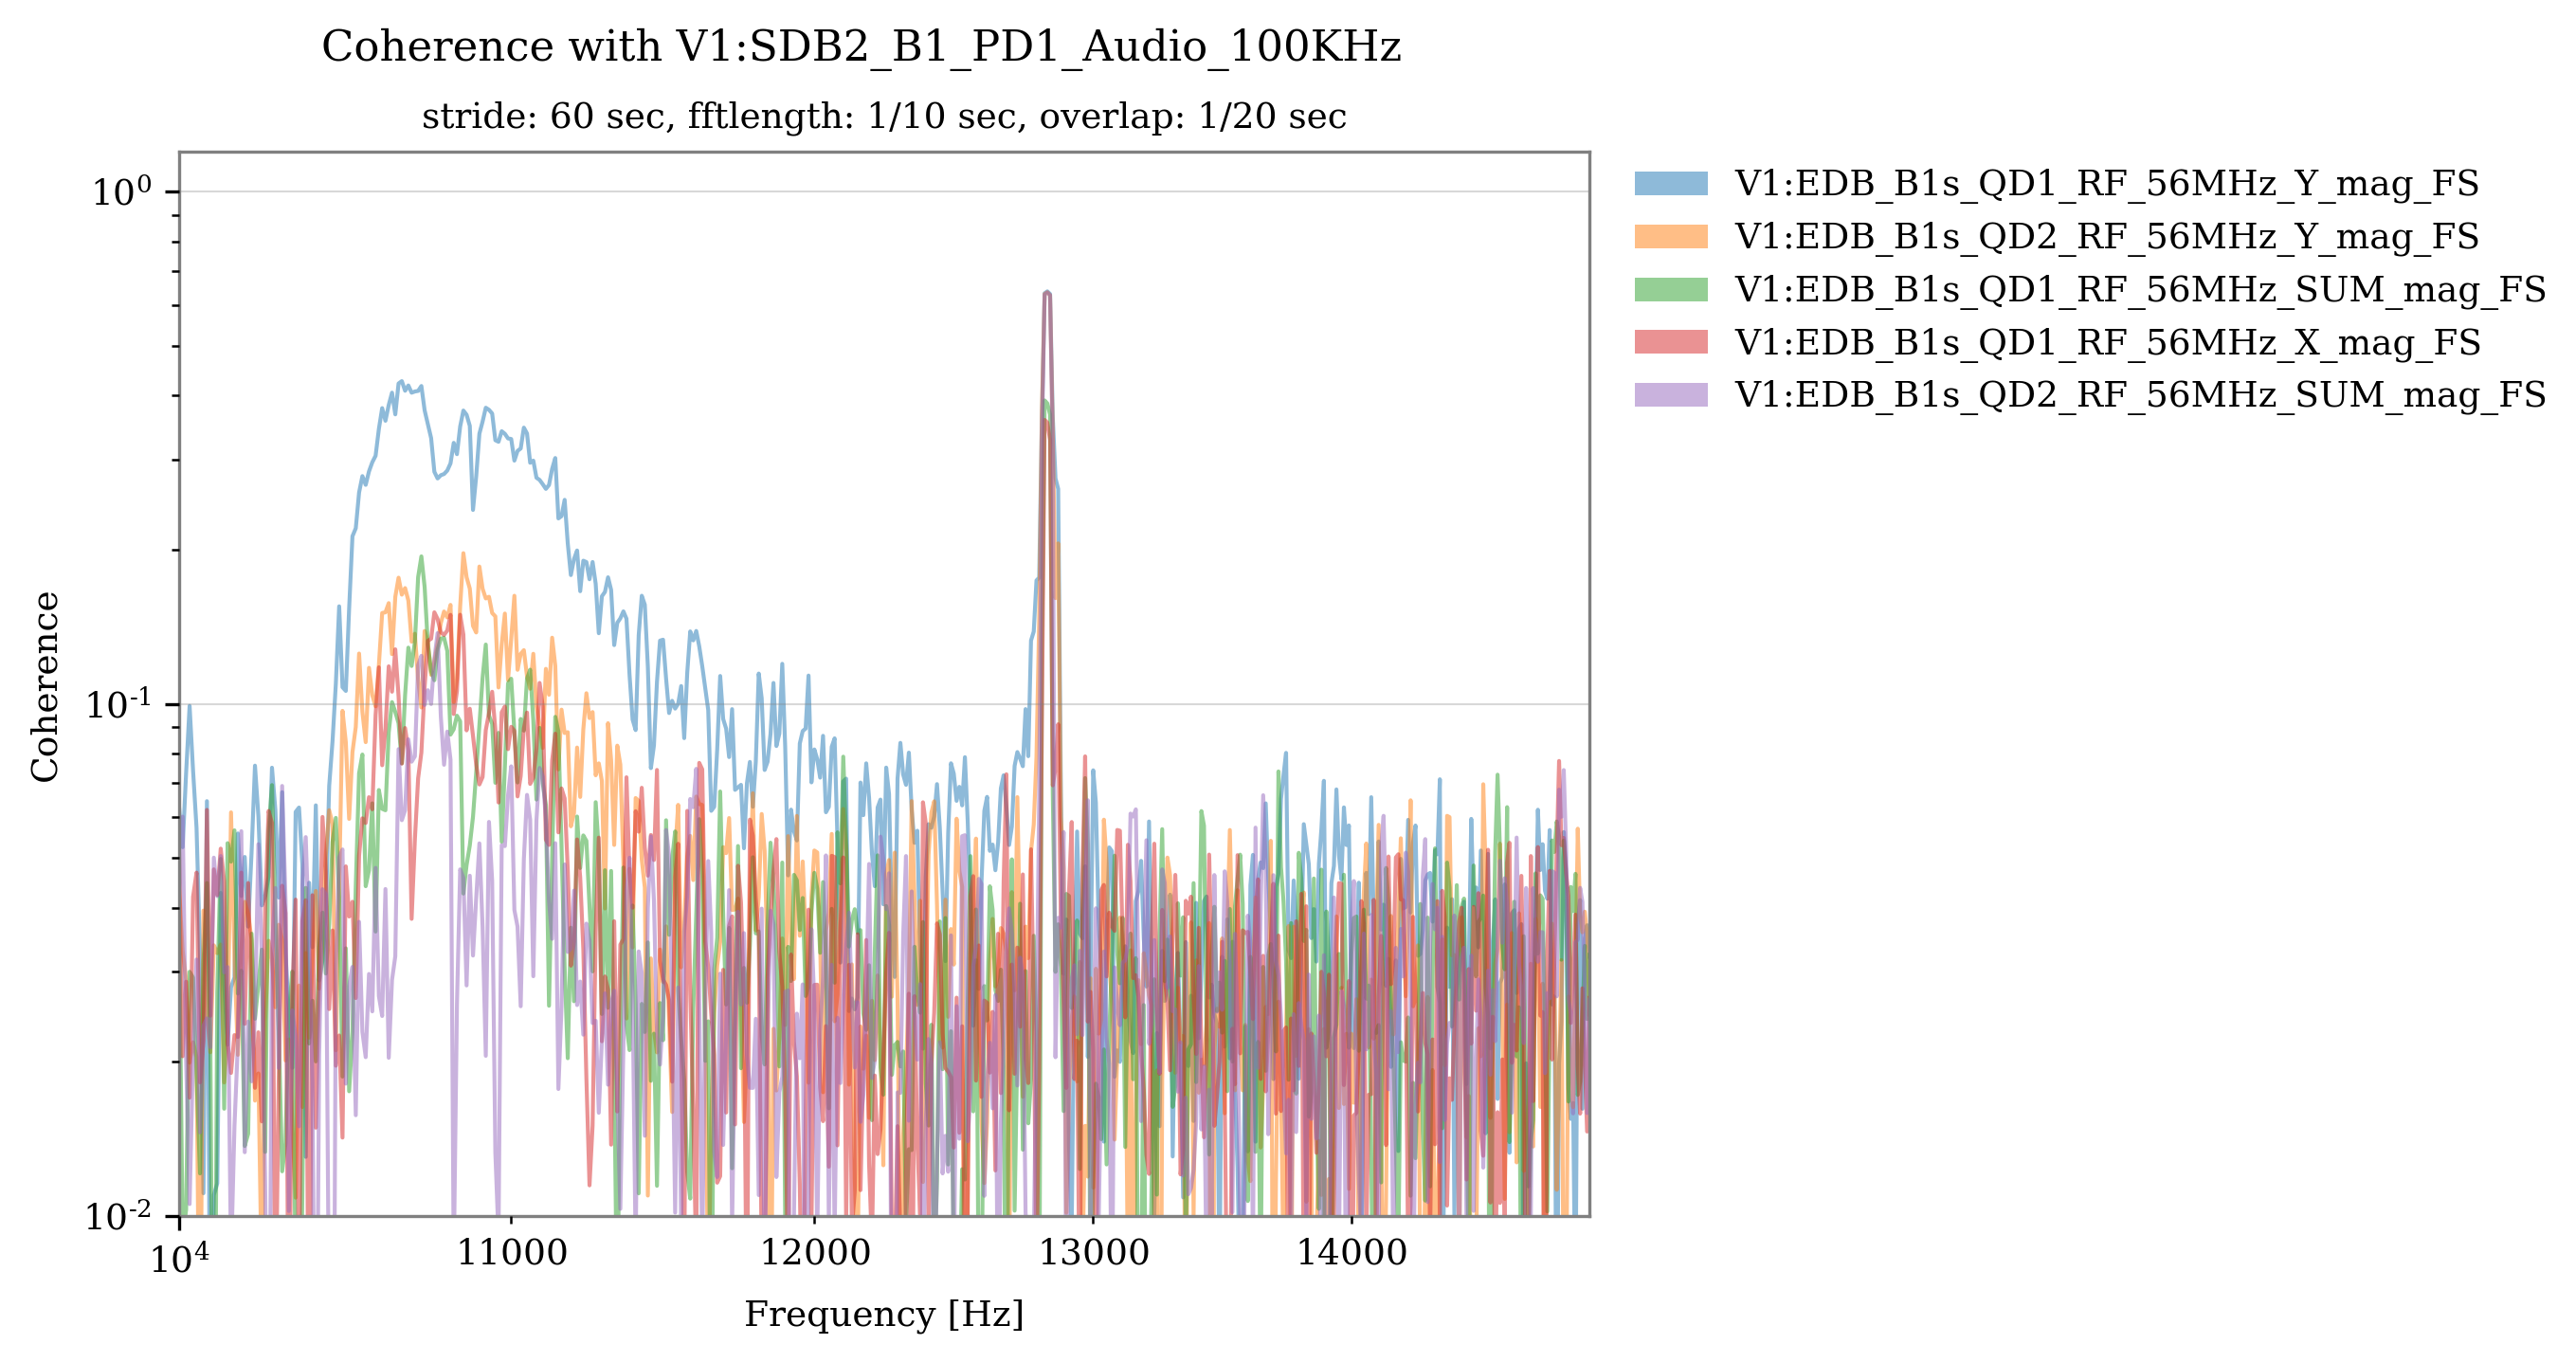
Figure 2 shows one of the more recent changes in frequency on March 7, it has become much louder and broader.

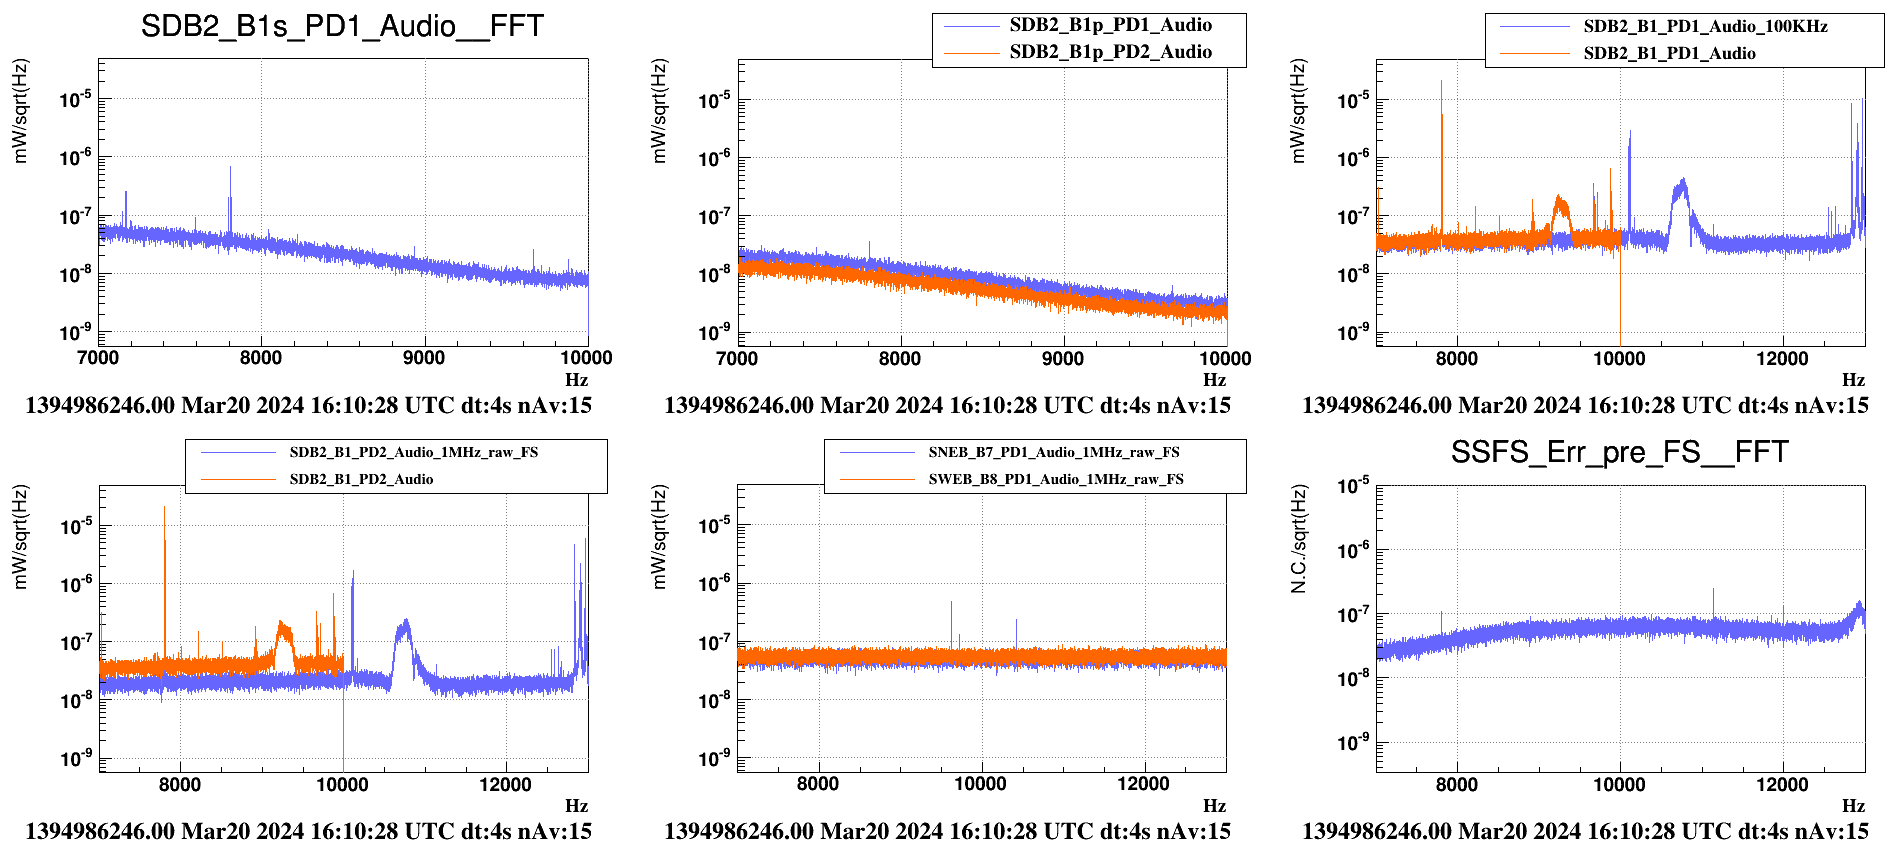
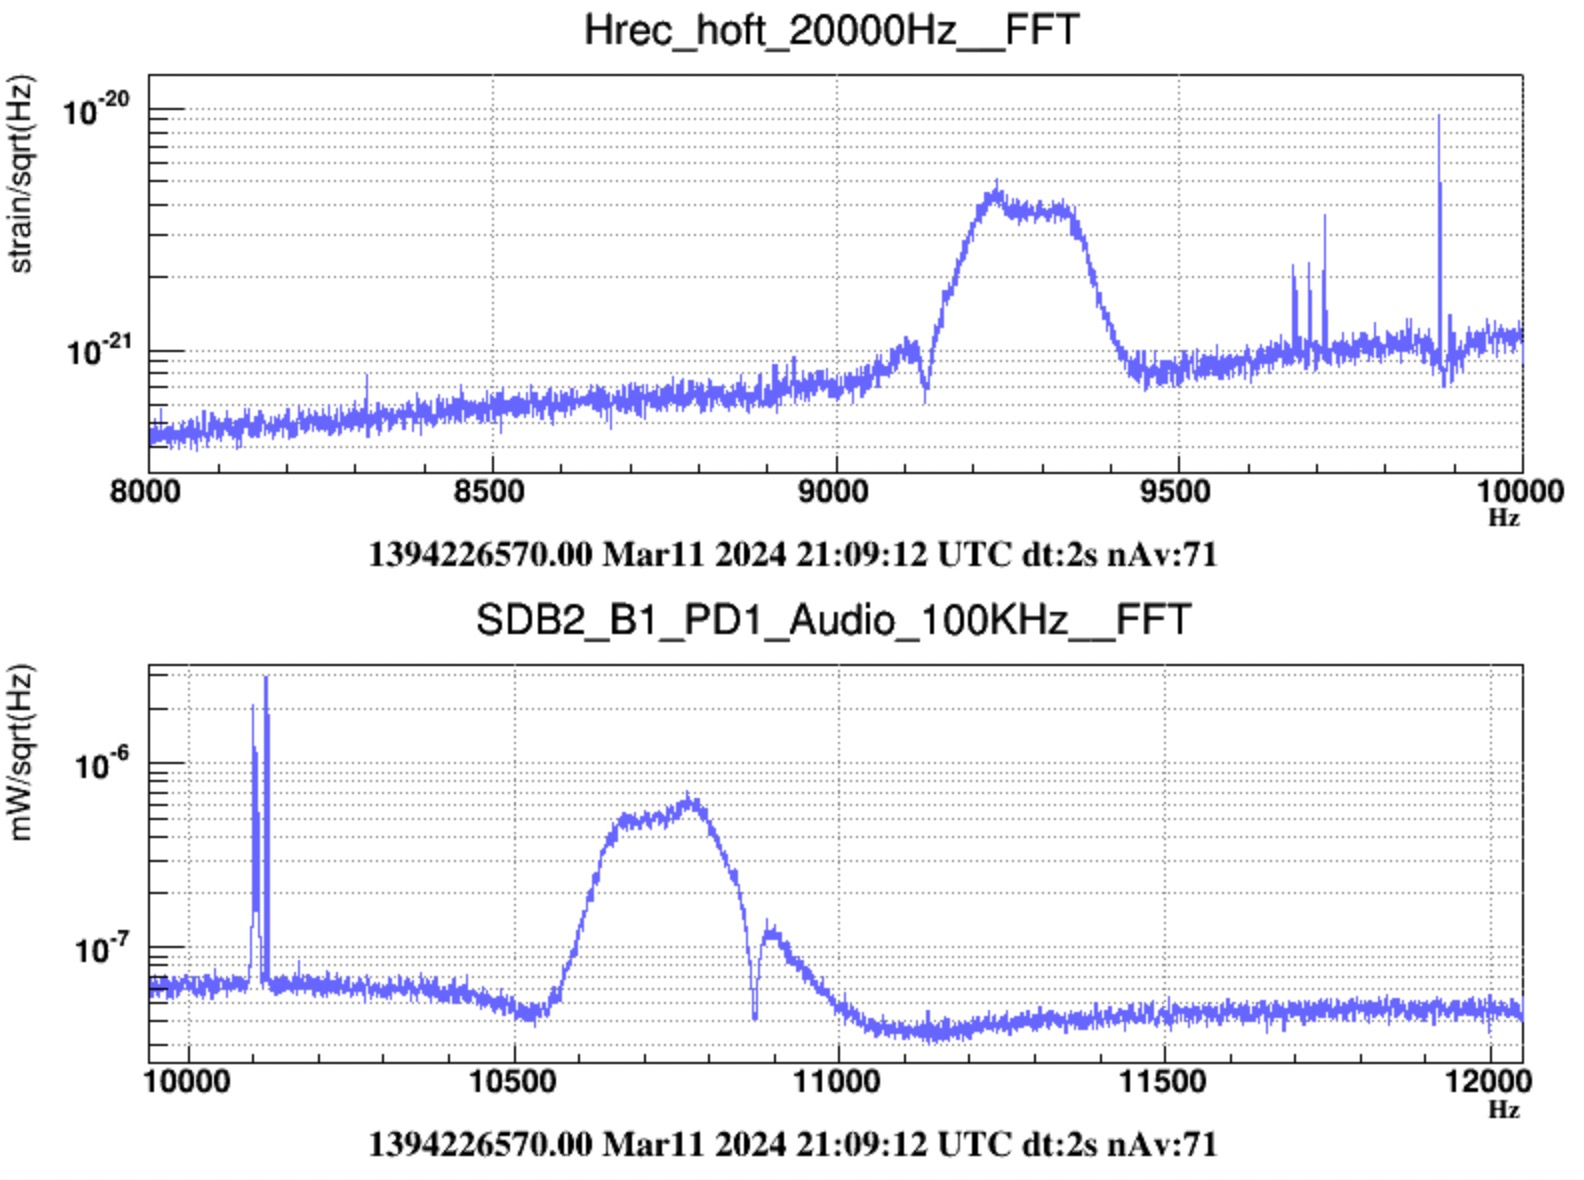
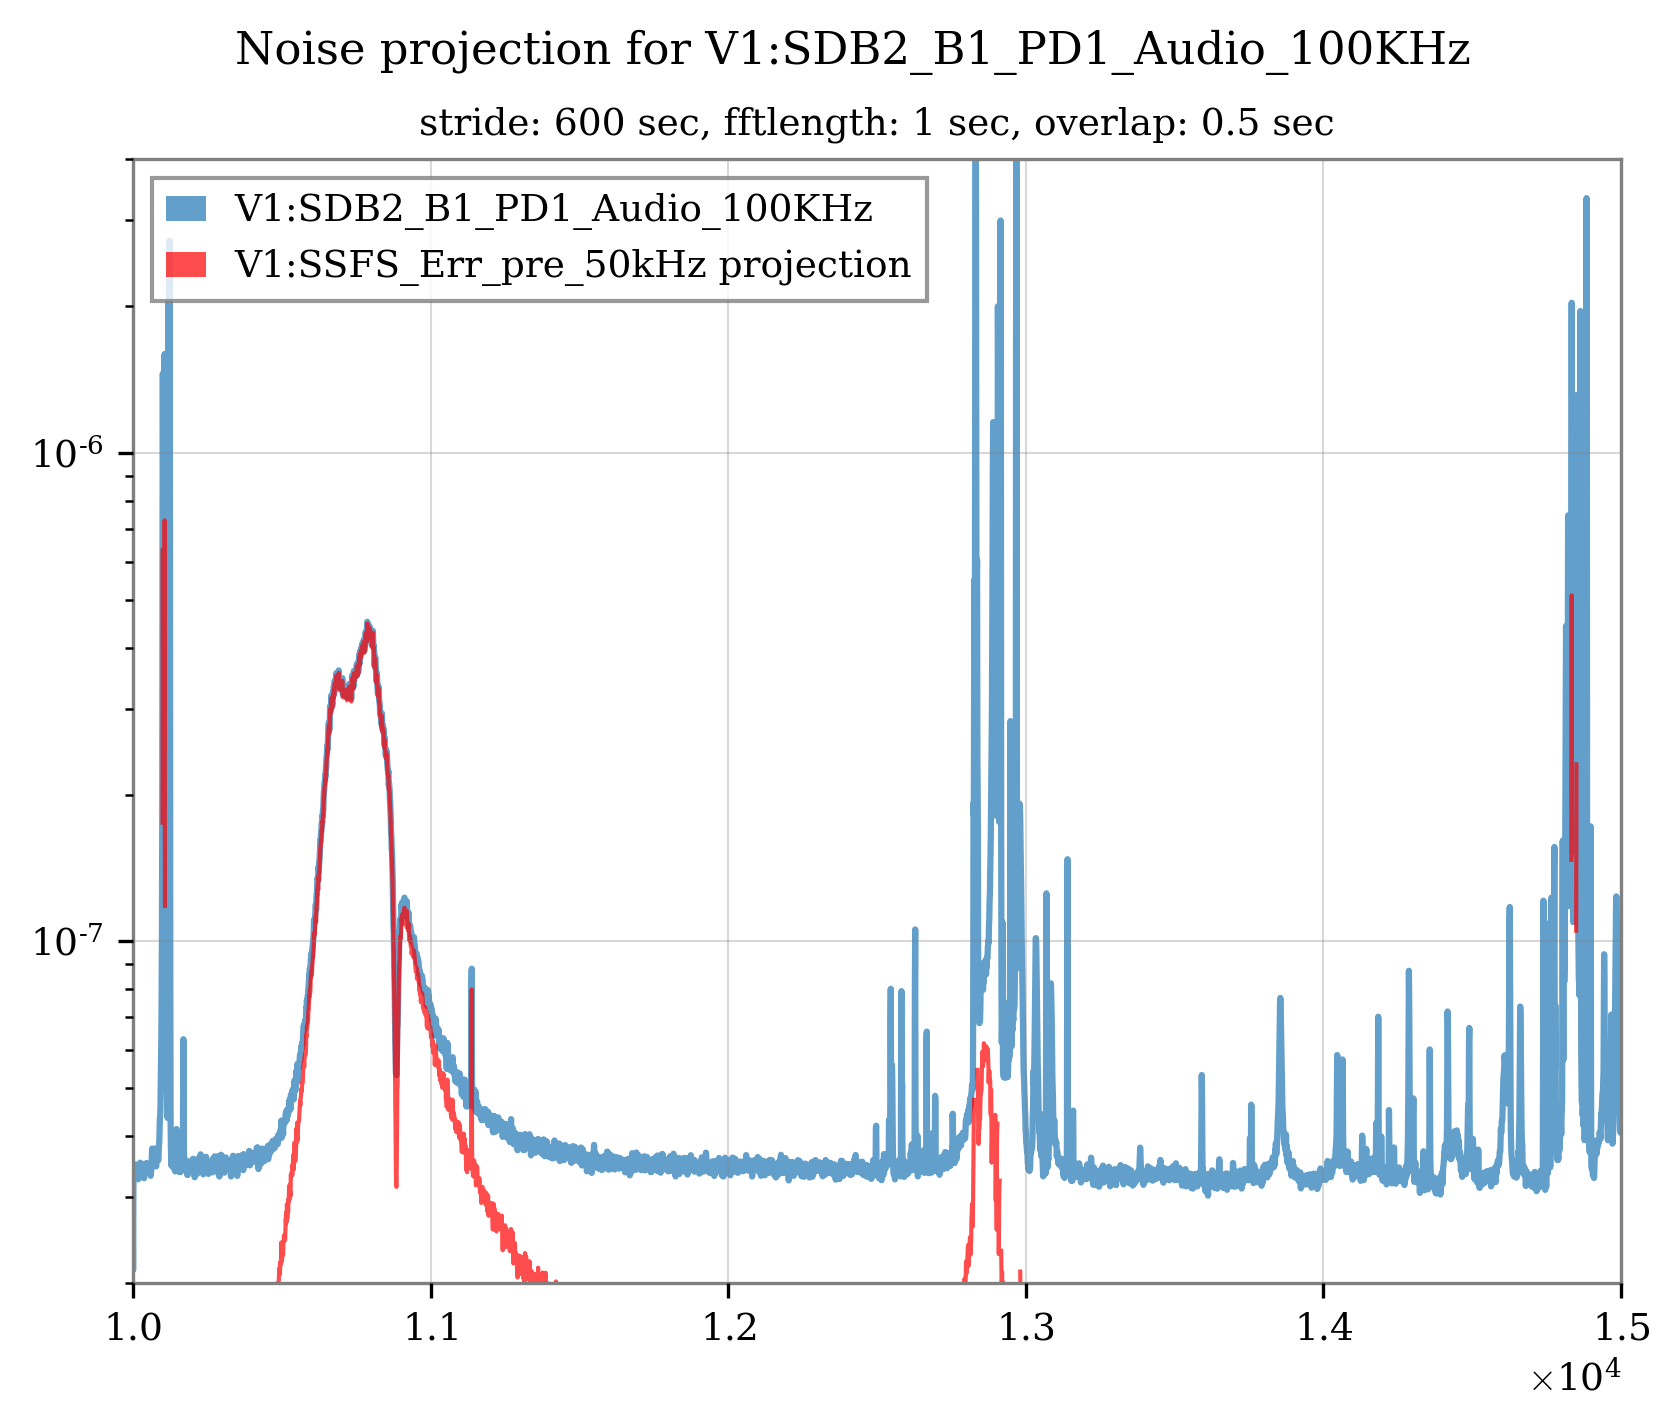
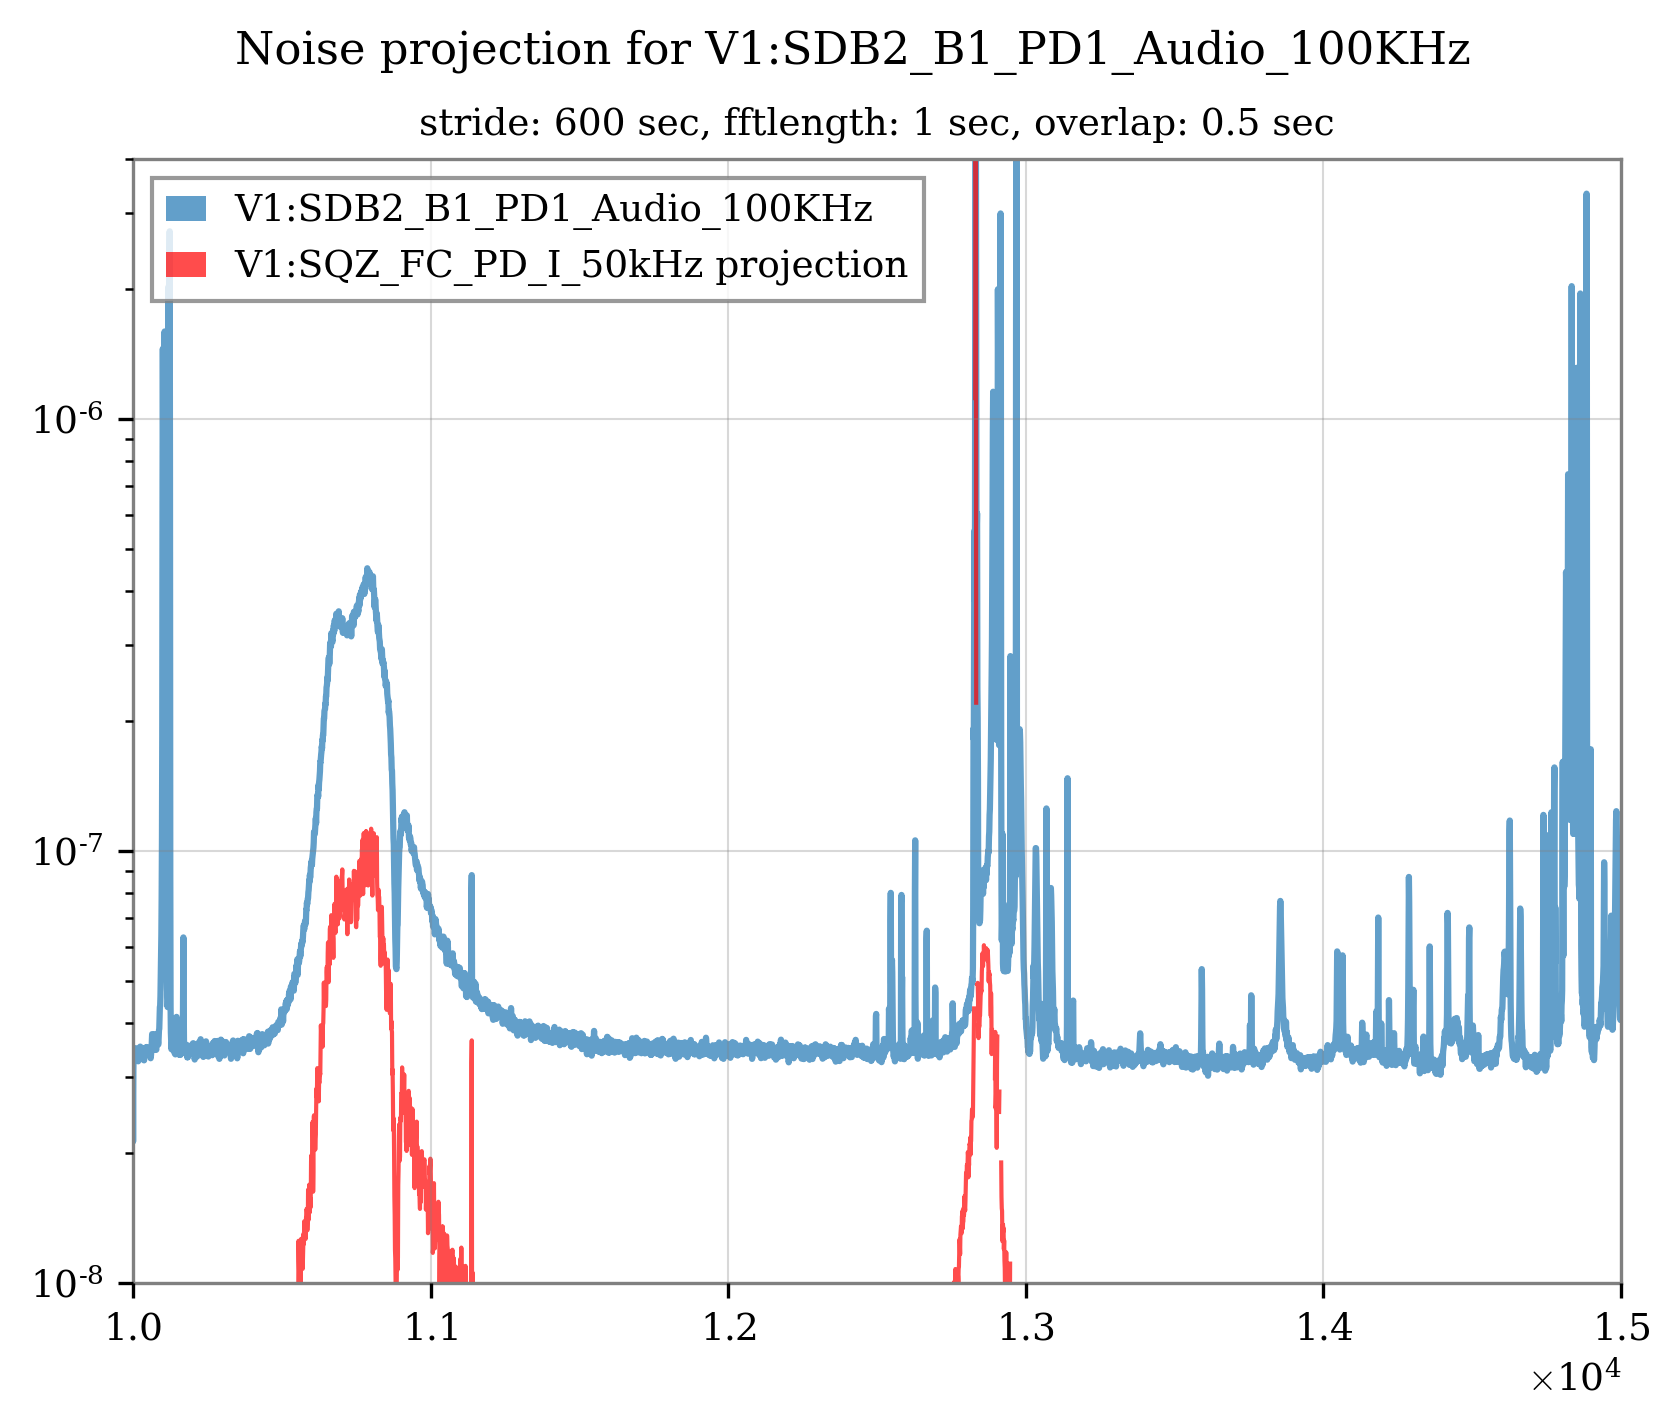
It would be good to understand what this is before it becomes more catastrophic.

Images attached to this report
Comments to this report:
masserot - 17:57 Wednesday 20 March 2024 (63682) Print this report

The moving line at 9KHz seem to be the aliasing of one at 11KHz present only in the B1 Audio channels, to be confirmed by the experts


Images attached to this comment
fiori - 18:25 Wednesday 20 March 2024 (63683) Print this report

This hrec bump seems to be the aliasing of the bump laying between 1.5 and 1.1 kHz which is visible in the Audio_100kHz channel.  ... to be found :-)

But that means that all ENV sensors are blind.

By the way the same happens for the hrec lines at 9877 and 9881 Hz, actually at 10119 and 10123 Hz.

Images attached to this comment
direnzo - 16:03 Tuesday 26 March 2024 (63739) Print this report

I've investigated the bump between 1.05 and 1.12 kHz by estimating the coherence of the channel V1:SDB2_B1_PD1_Audio_100KHz with all the raw channels with sampling rates larger than 20 kHz (46).

Figure 1: the 6 channels with significant coherence at the frequencies of the noise bump are shown in this figure, which represents the coherence with the target channel in the band 10-15 kHz. Some channels are clearly interdependent and naturally correlated with the target. I let the experts comment on how informative this result can be. Notice that the curves for V1:SSFS_Corr_50kHz  and V1:SSFS_Err_*_50kHz are superimposed.

Figure 2-3: noise projections with some of the above most coherent channels (ASD vs frequency: sorry for the missing axis labels)

I repeated the same analysis with all the raw_full channels with a sampling rate larger than 20 kHz (247):

Figure 4: the only channels exhibiting a significant coherence with this peak in SDB2_B1_PD1 are from the V1:EDB_B1s_QD1_RF_56MHz_* family. Not shown, a small barely significant coherence has also been measured with V1:SNEB_LC_LVDT_FL_V_out_raw_DS and the V1:SIB2_LC_LVDT_*_out_raw_DS family.

Comments and suggestions are welcome on whether these results are informative and what to test next.

Images attached to this comment
mwas - 18:45 Tuesday 26 March 2024 (63748) Print this report

Figure 1, the change in frequency of the line between March 6 and 7 corresponds also to a change of the SSFS UGF. So the SSFS loop is involved in that oscillation.

Images attached to this comment
Search Help
×

Warning

×