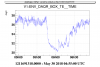
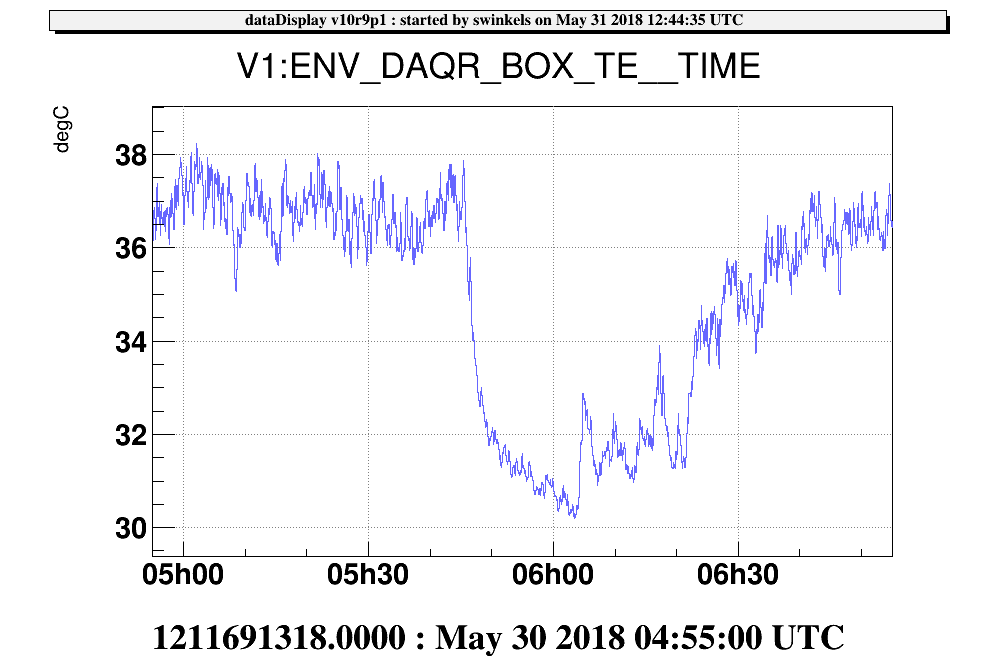
I quickly searched by hand among some environmental temperature sensors, the one from the DAQ room seems the most interesting, see the last figure. This has to be investigated in a more systematic way.
Does anyone know about any activity or event (switch-off of some machine, air-conditioning malfunction, doors of rooms opening, ...) yesterday around 8 LT?
Hunting for these lines this morning we did two things:
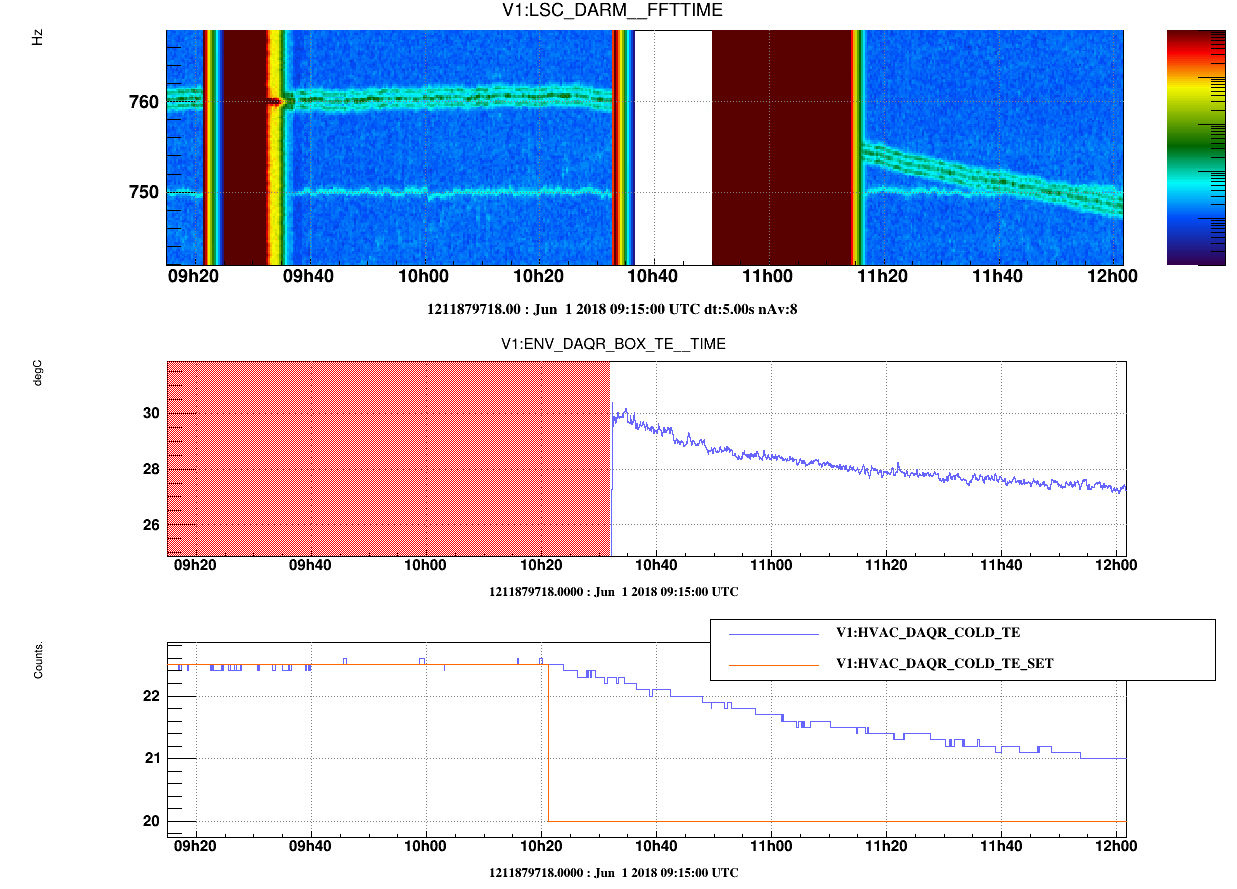
at 8:54 LT we switched off the ENV-DT temperature box located in DAQ room (the box that carries and reads out the temperature probe ENV_DAQR_BOX_TE)
at 10:21 LT Davide cooled down a bit the DAQ room changing the temperature set point from 22.5deg to 20deg.
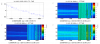
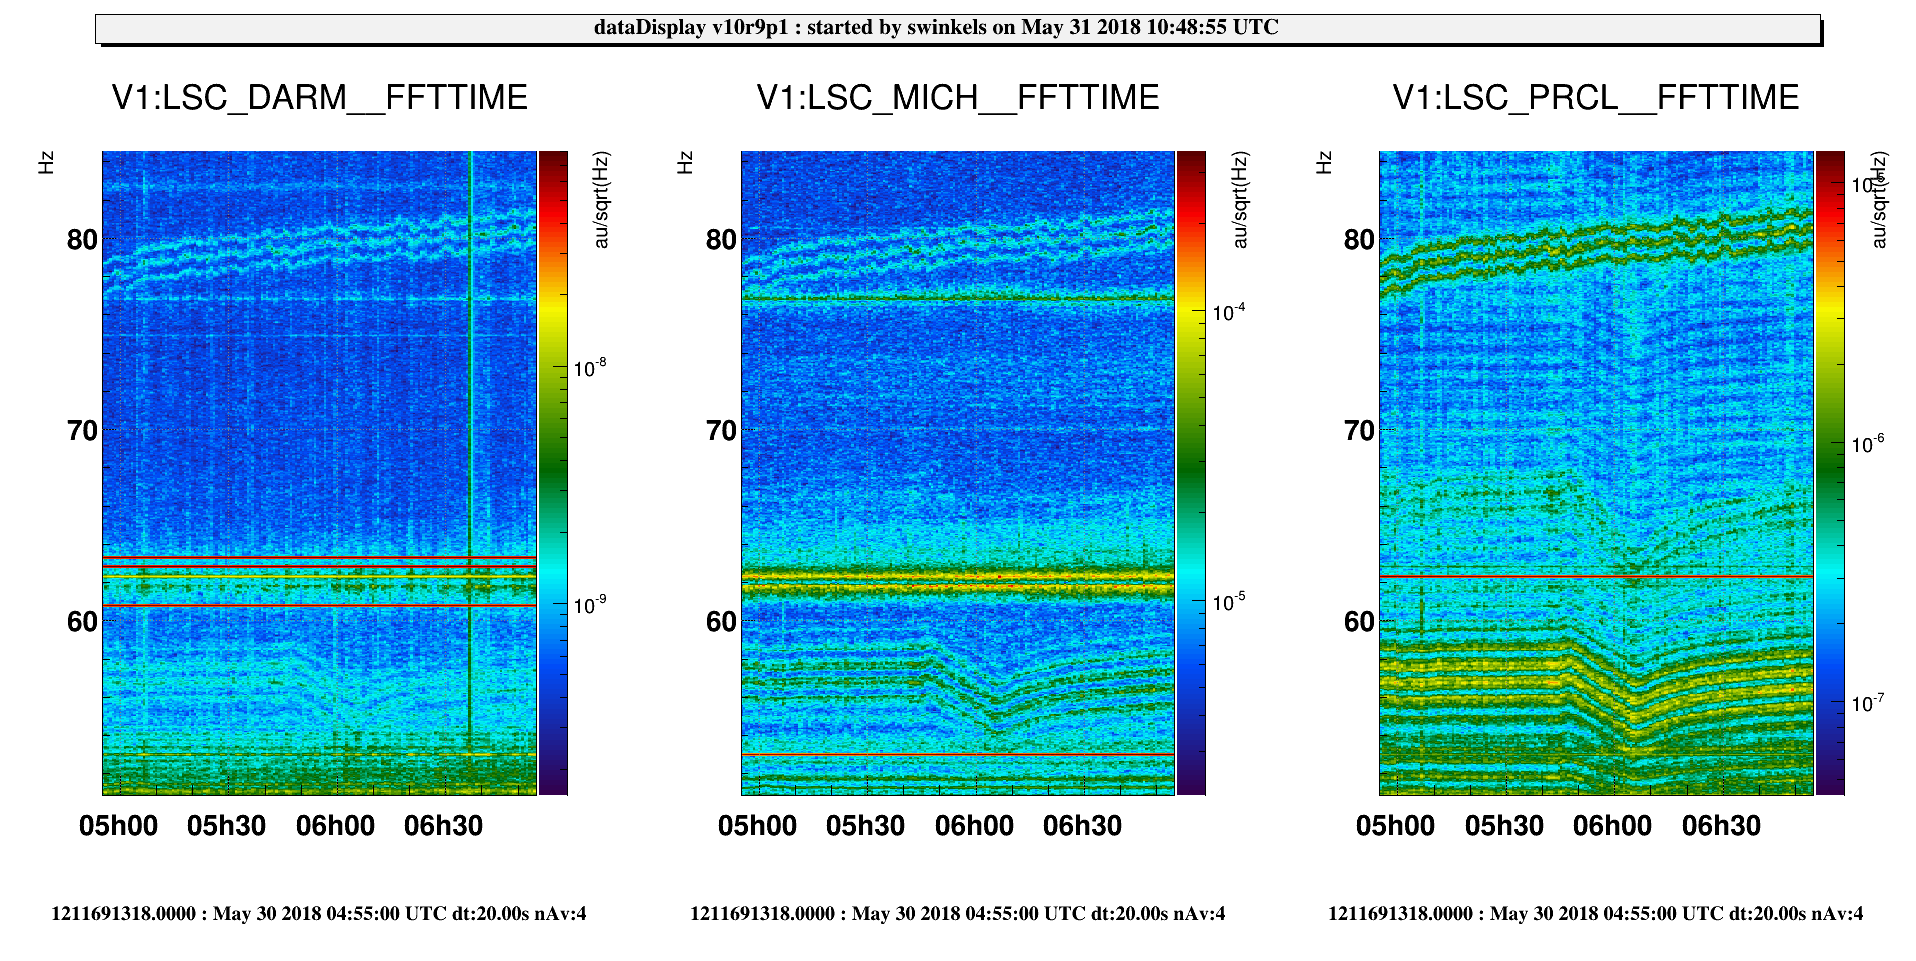
The first action (switching off the BOX) did not affect the lines, while the lines started drifting down following the DAQ room temperature descrease: see the attached plot.
... to be continued
One peculiarity is that these lines have 1Hz spacing withing each bunch (see also 41485).

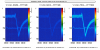
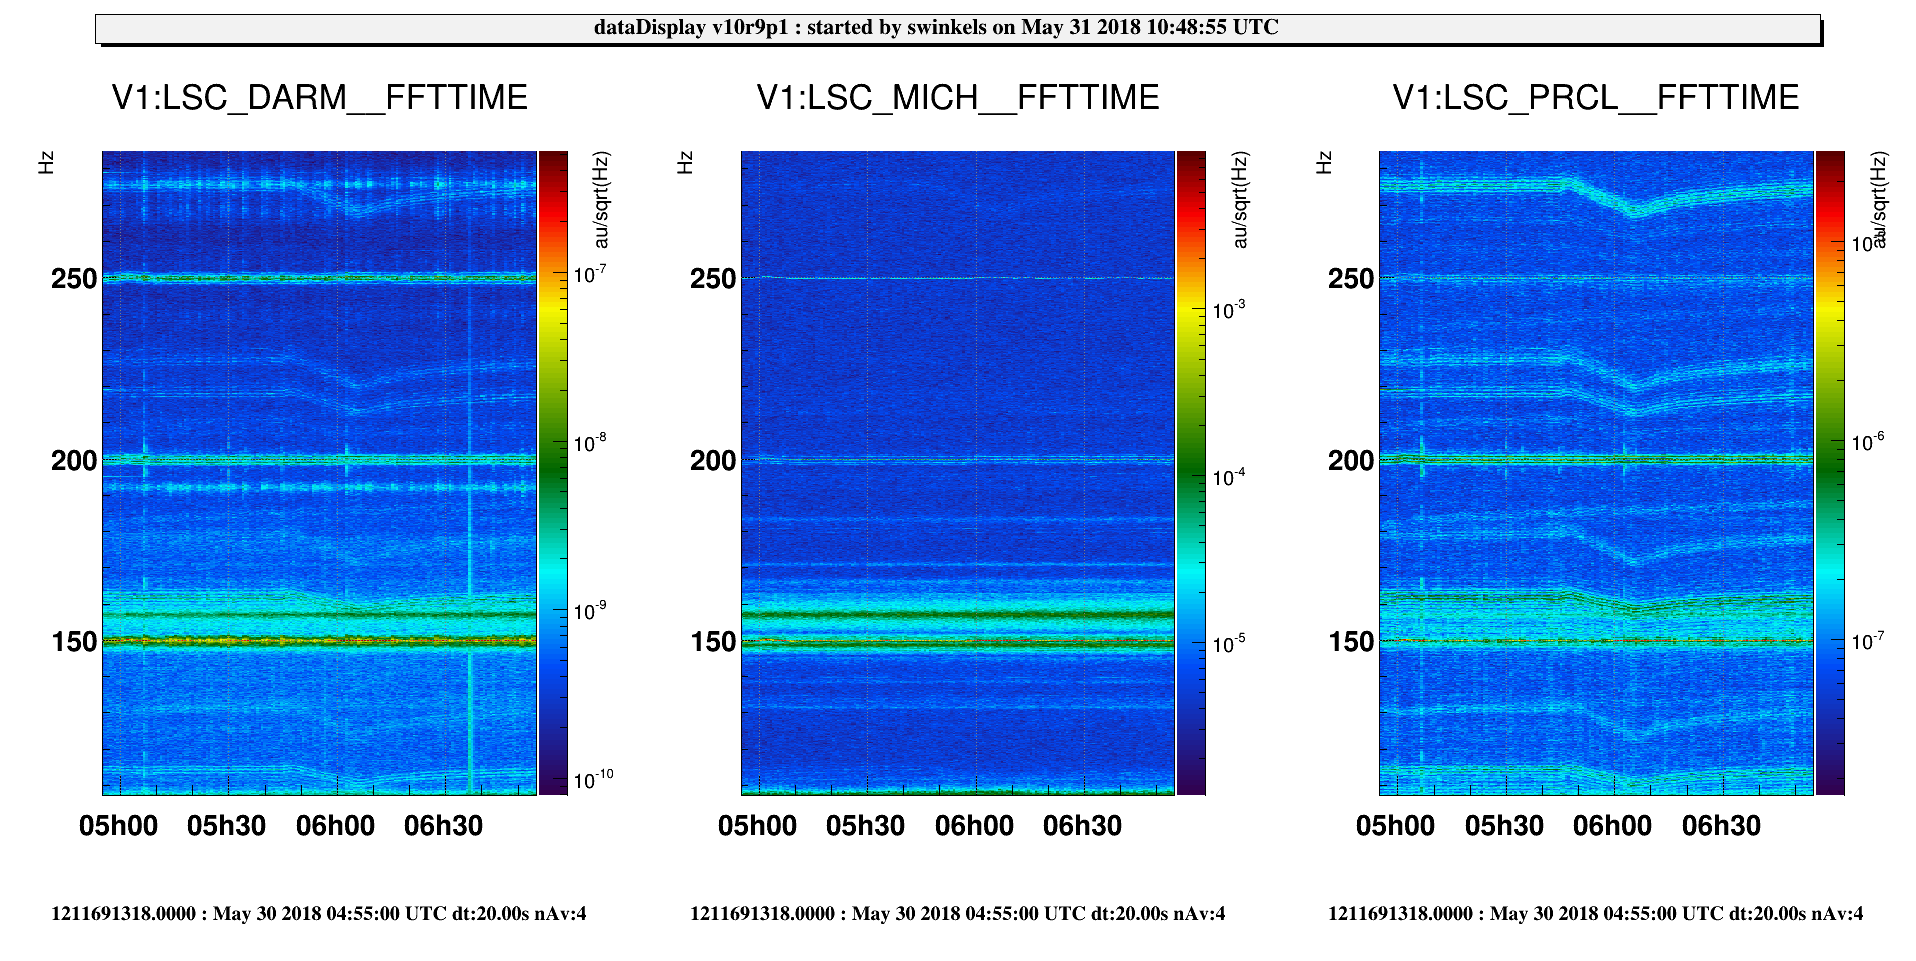
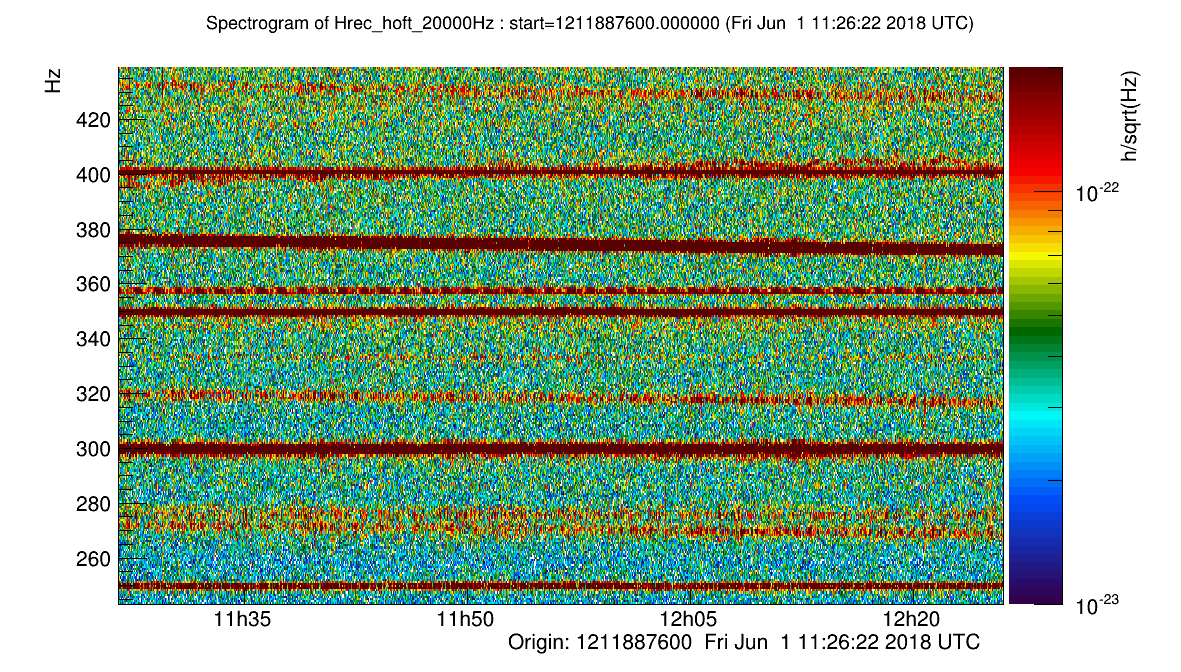
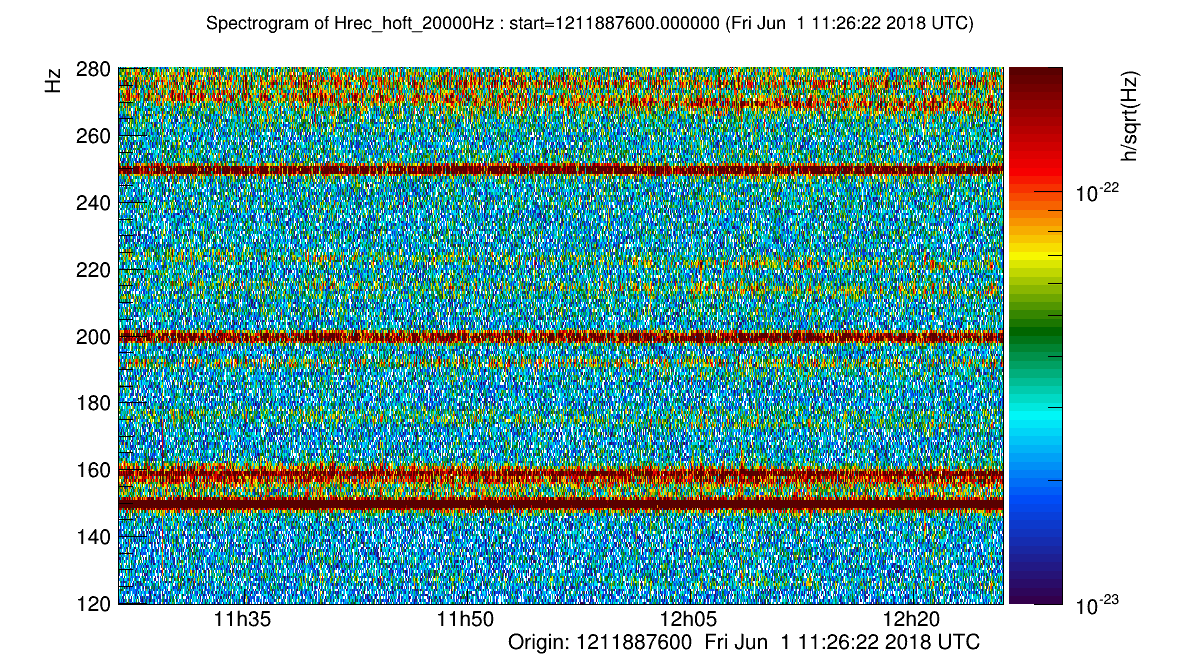
During this test on moving lines with DQ room cooling. Other lines are visible in h(t) spectrogram, which are also decreasing in frequency.
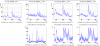
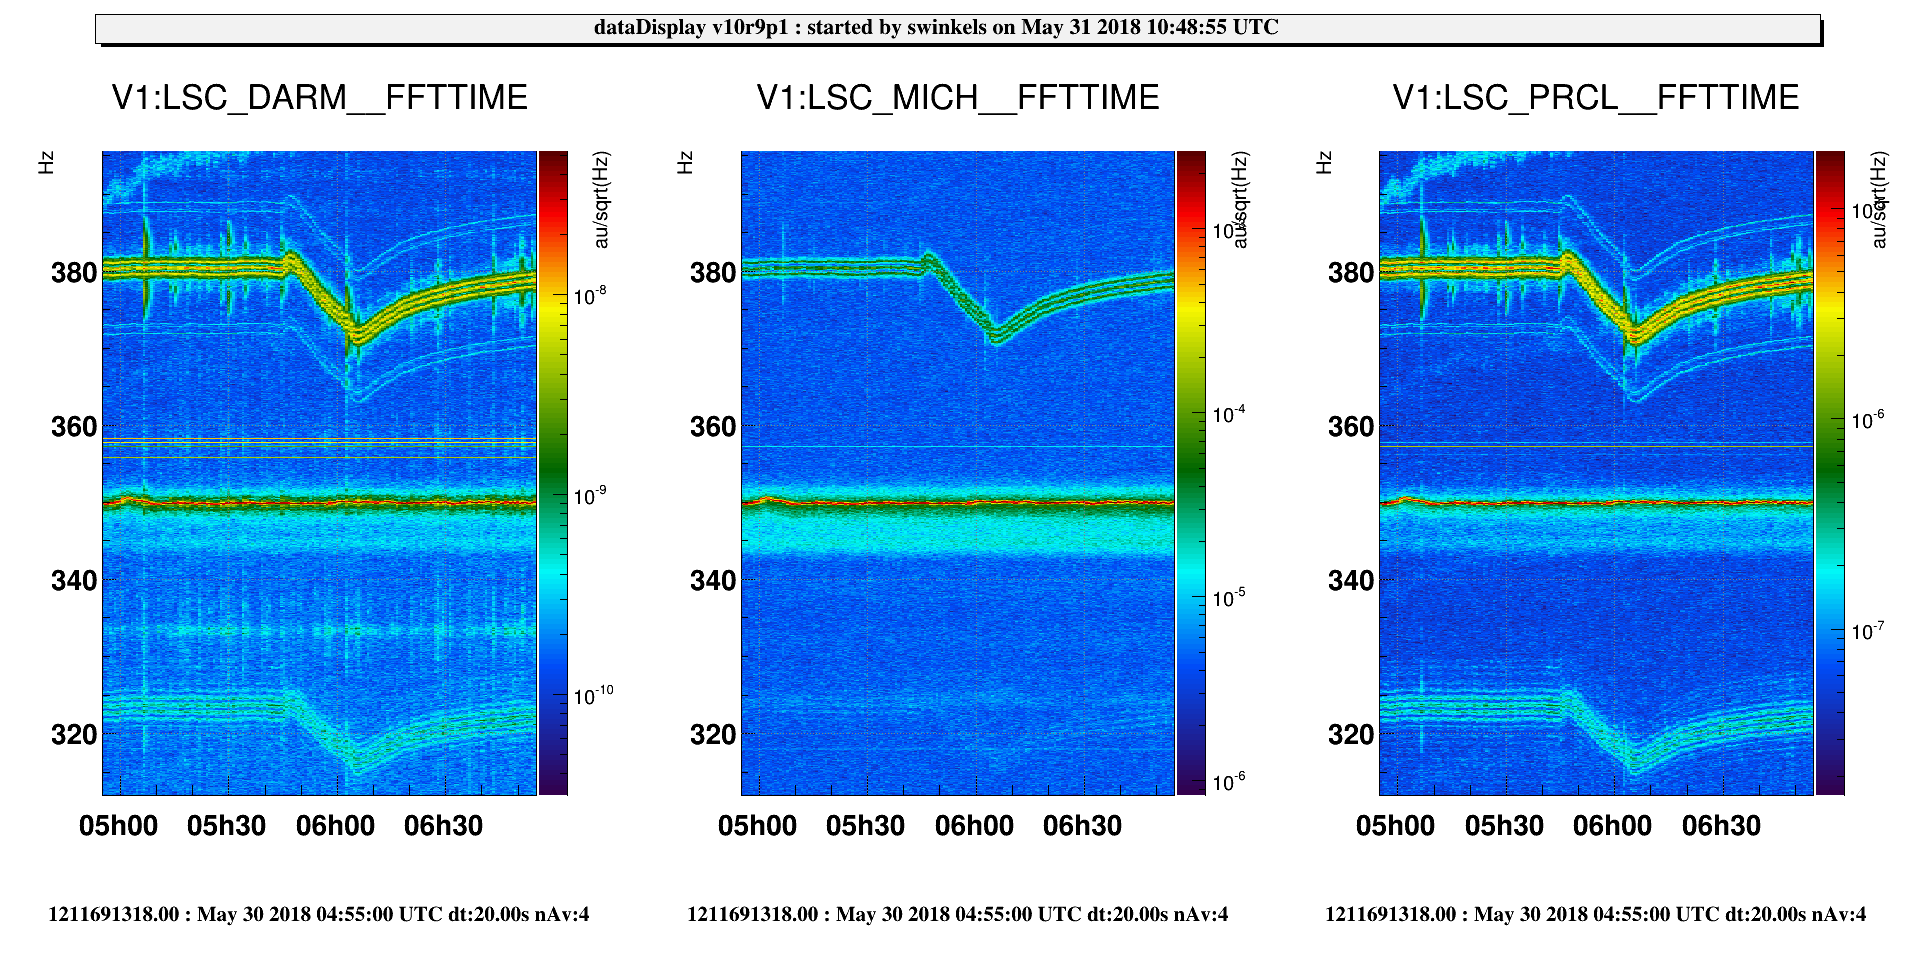
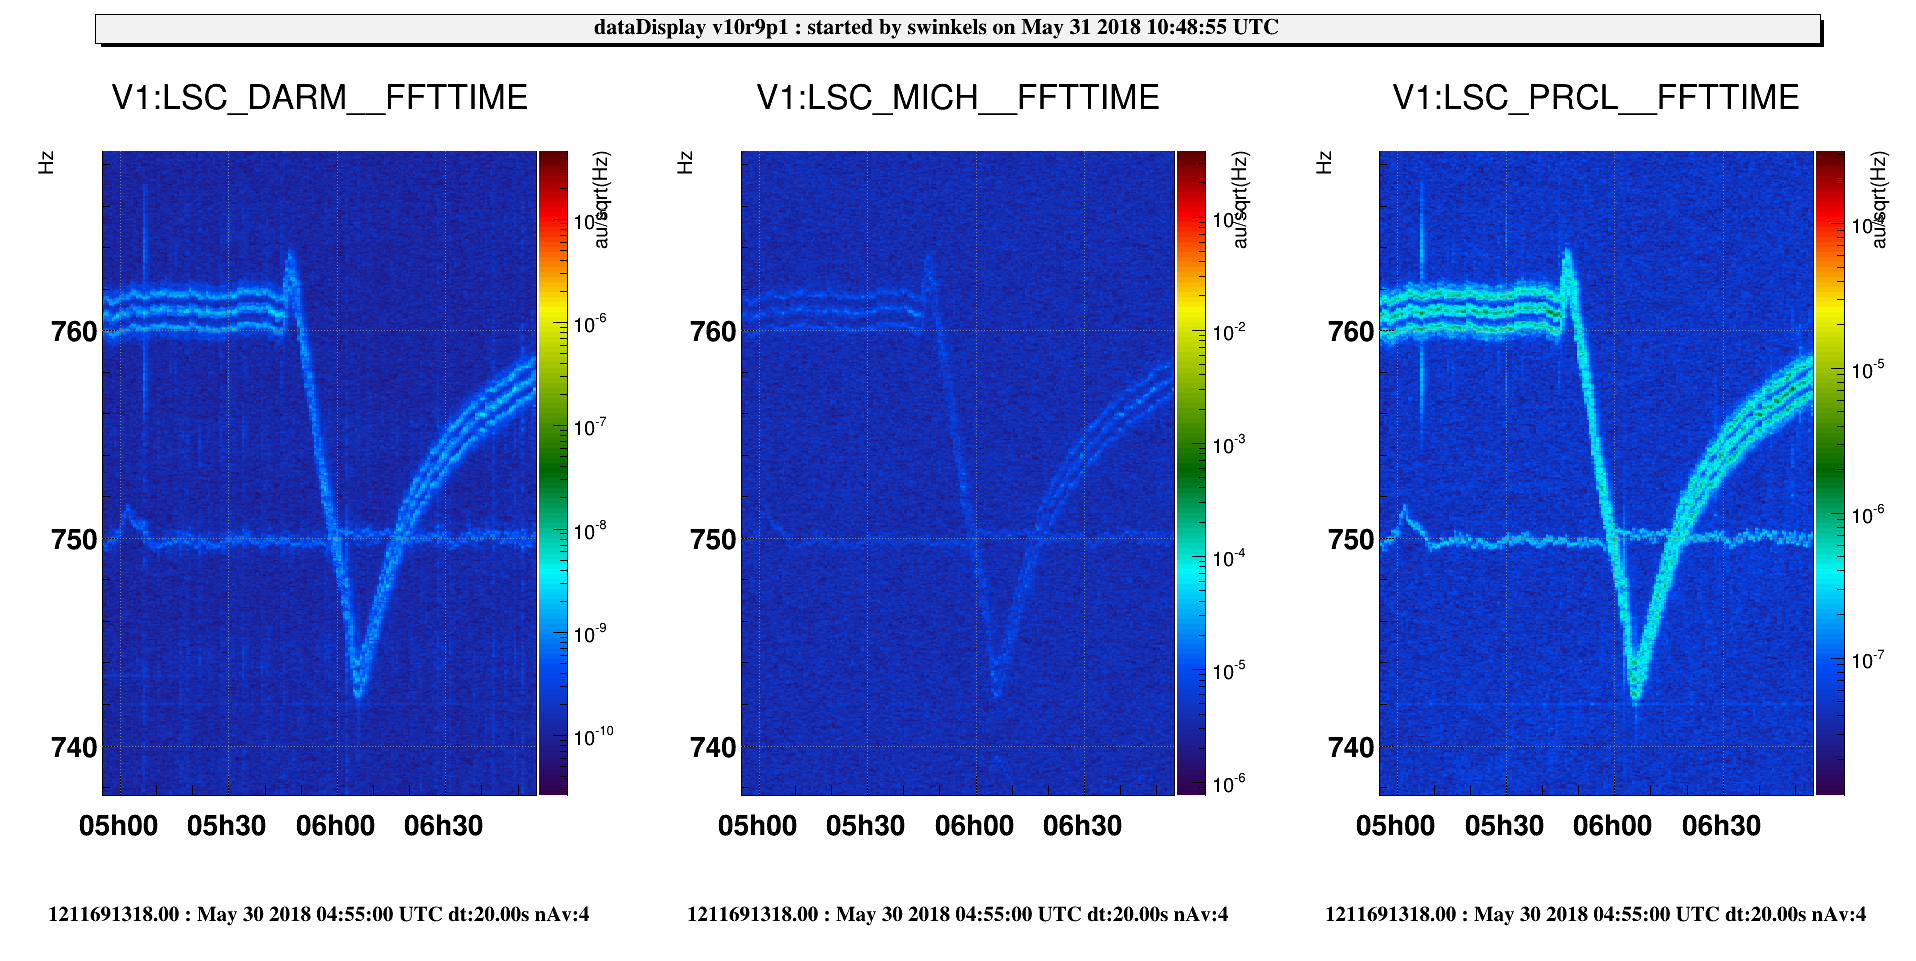
As can be seen on the plots 1 and 2, those lines, at the start of the test, are around the following frequencies: 180Hz, 220Hz, 272Hz, 320Hz, 380Hz, 435Hz, 480Hz, etc...
They are spaced by some value which varies between 40Hz and 60Hz.
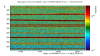
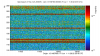
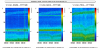
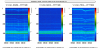
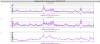
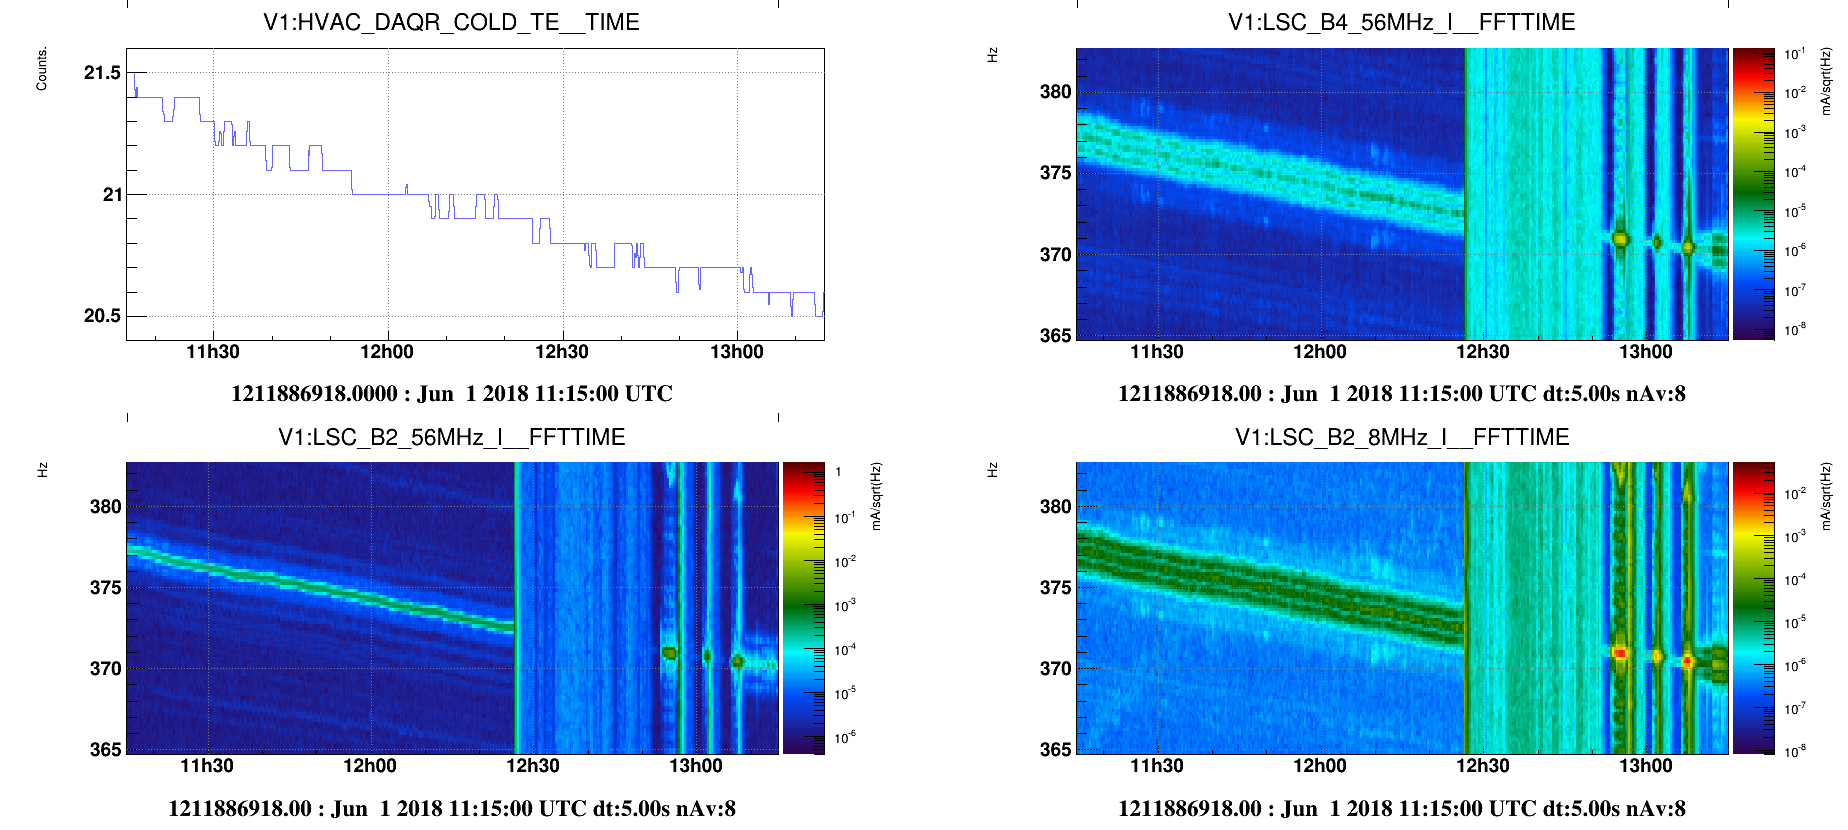
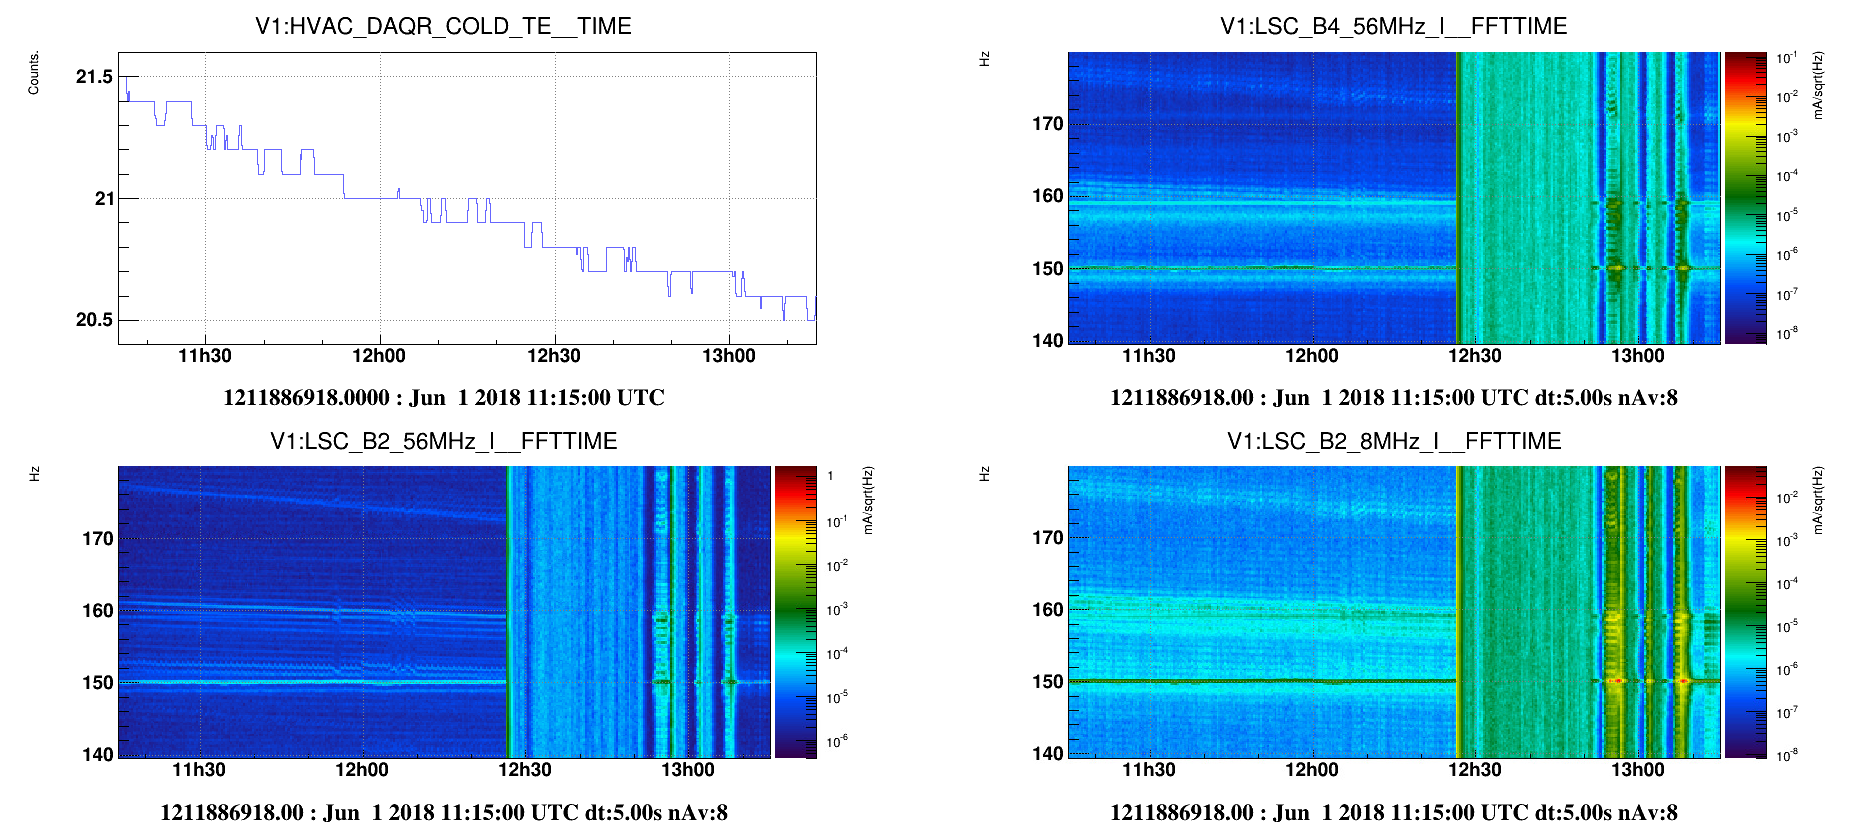
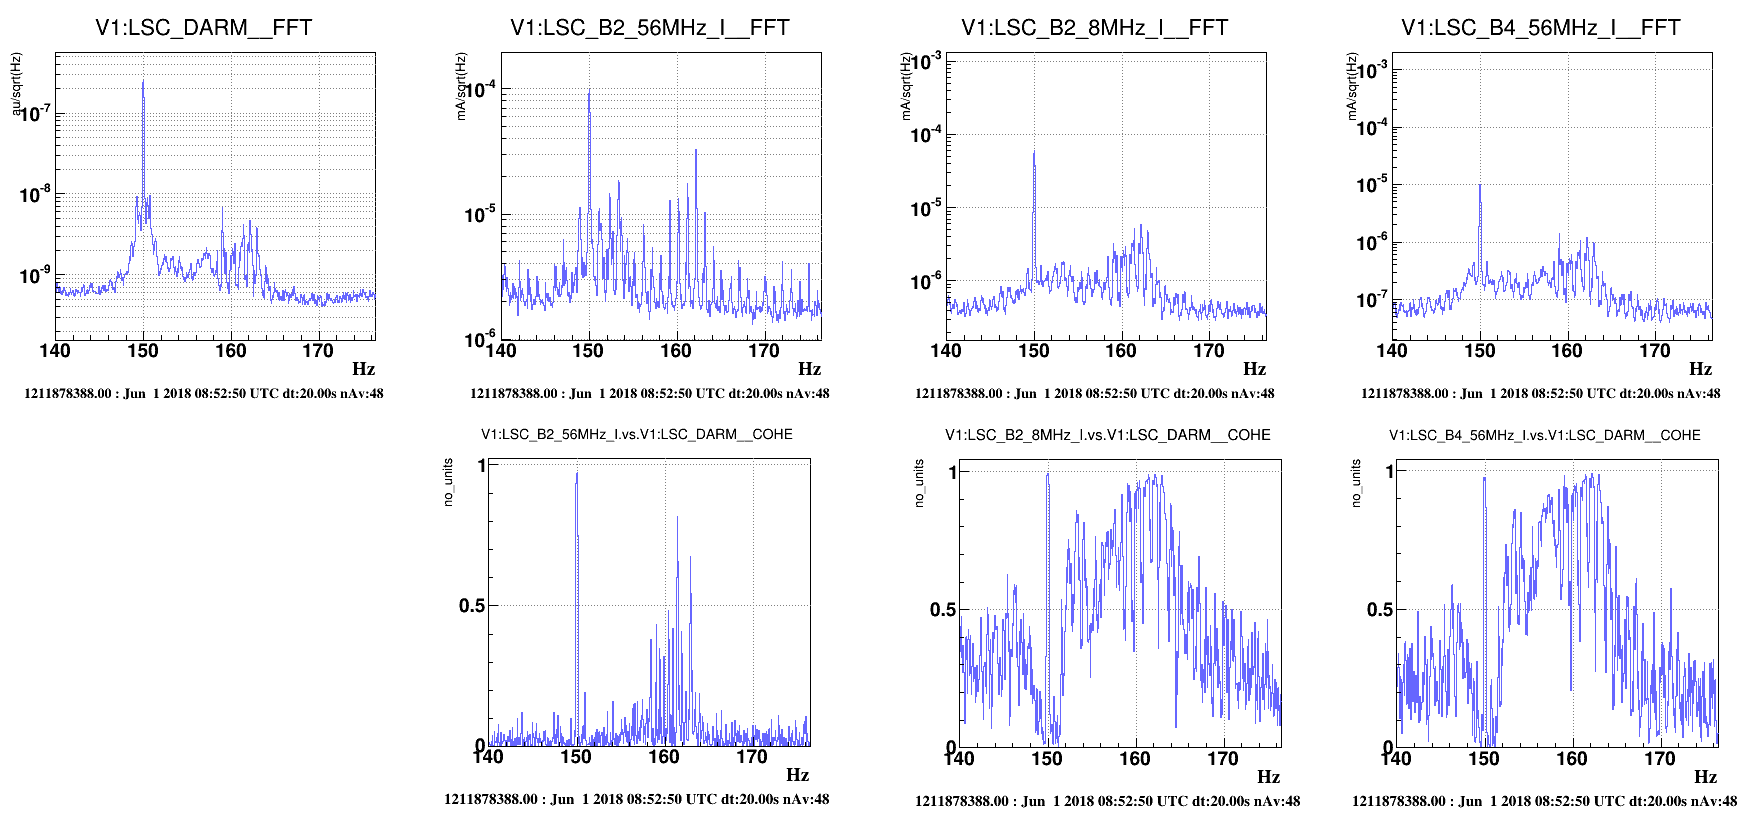
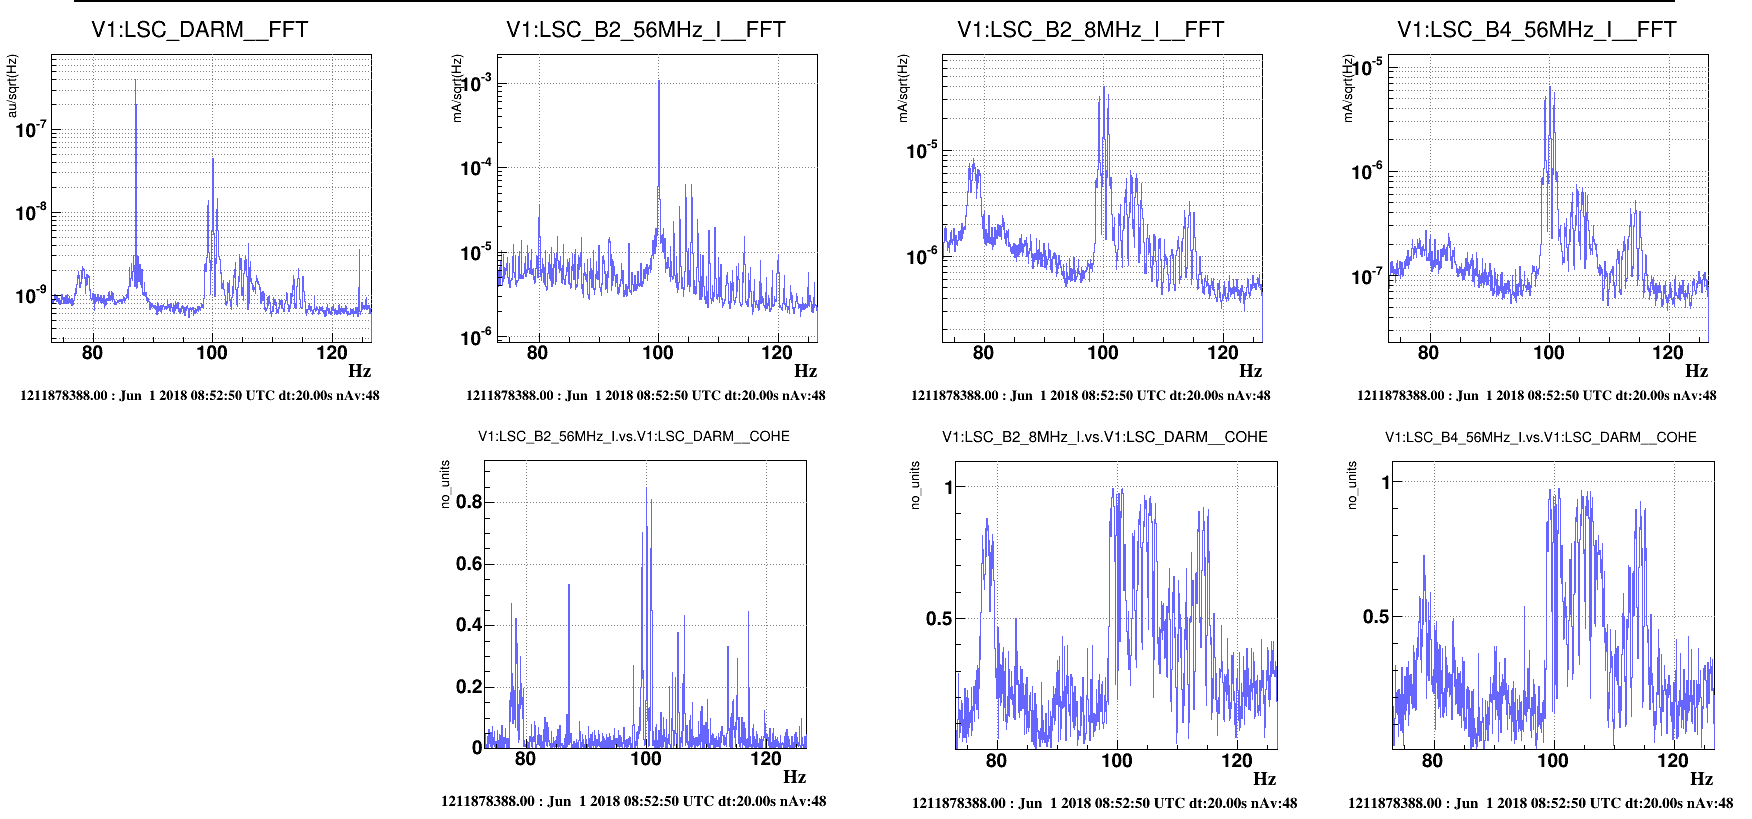
Interestingly, different demodulated photodiodes (also at different demodulation frequencies) show similar drifting forest of lines (roughly 1Hz spaced) during the DAQroom cool-down: examples are give in Figures 1 and 2. We can see there are bunches of peaks with different slope, ... higher order harmonics? but we could non find anti-drifting peaks.
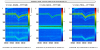
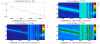
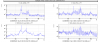
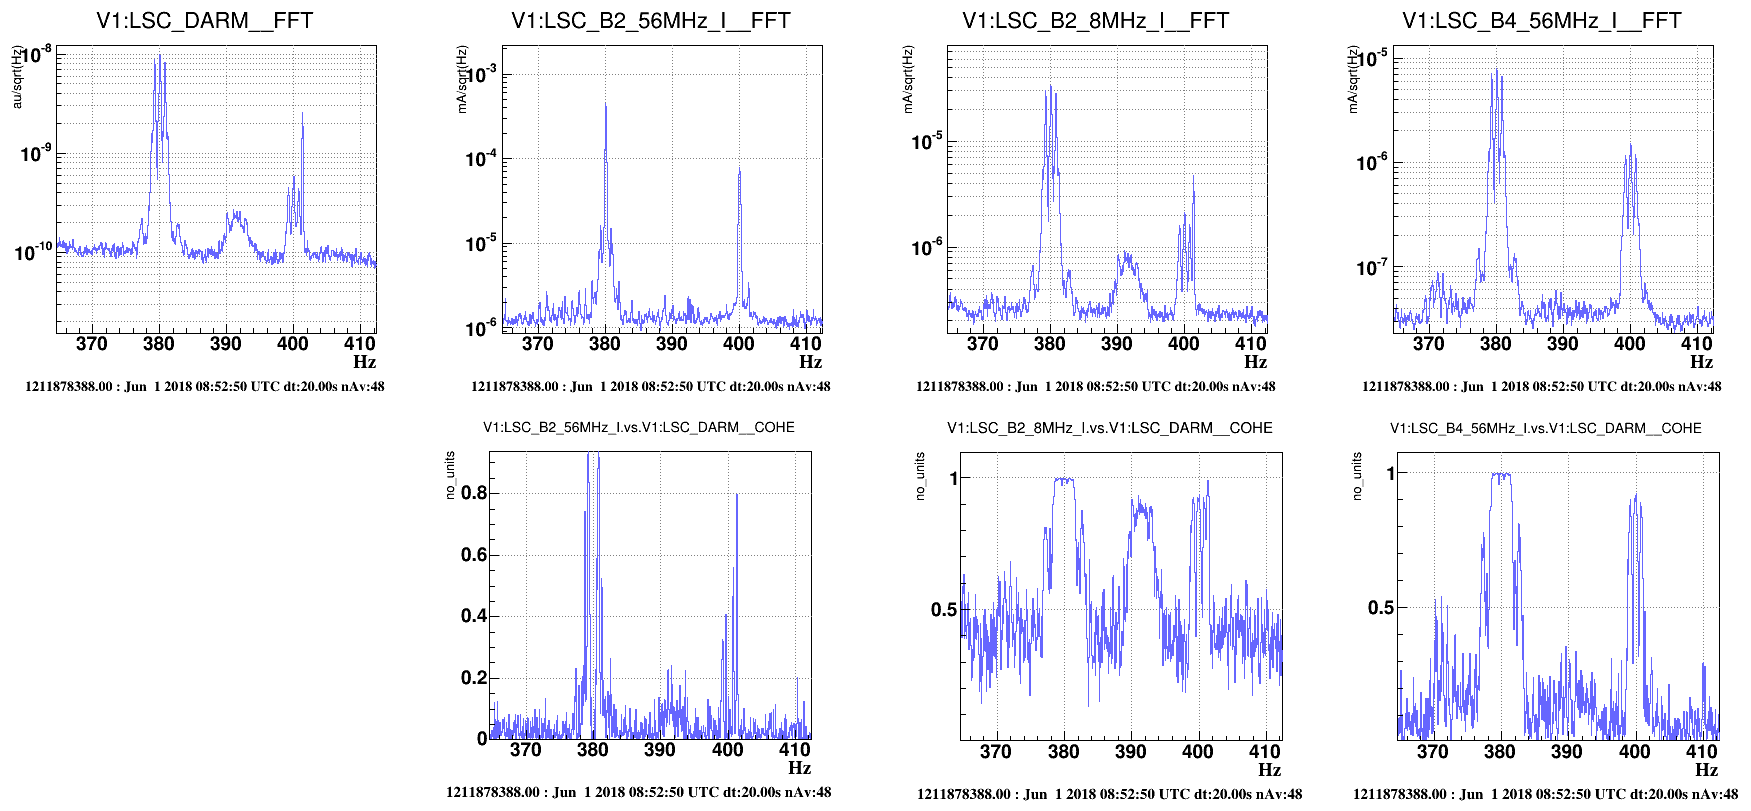
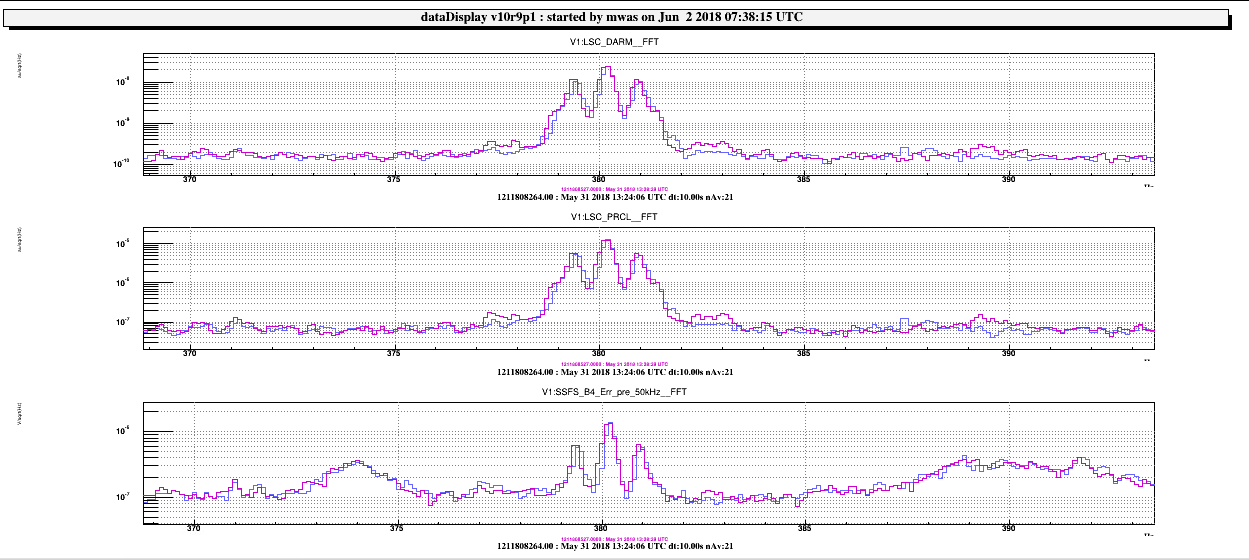
Several are common to LSC_DARM (Figures 3, 4, 5).

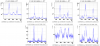
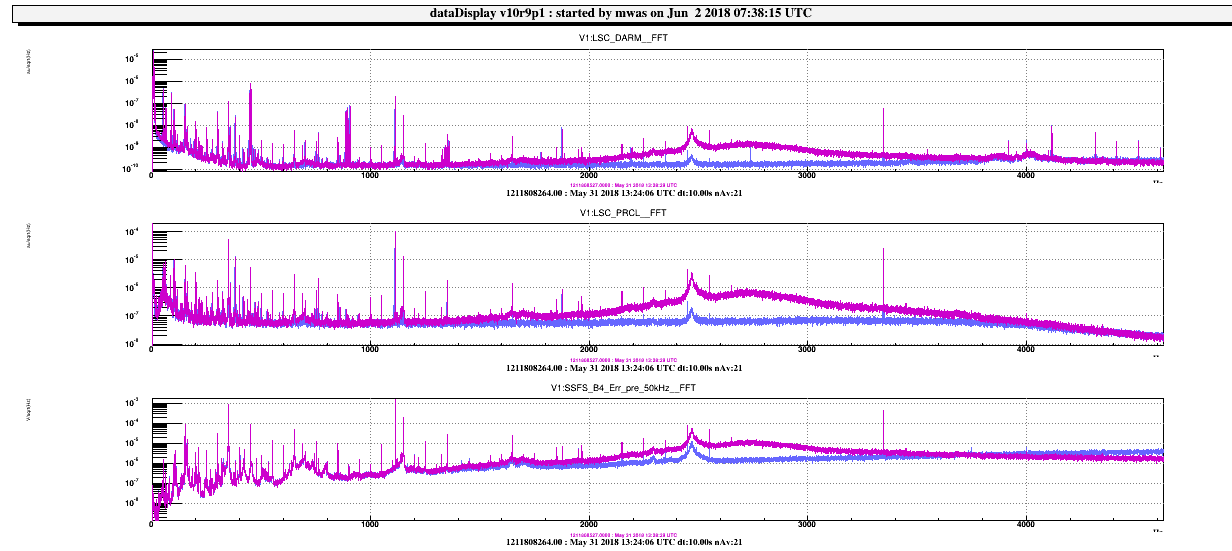
Looking at times when the SSFS gain was reduced, see figure 1, we can try to understand where the forest of lines comes from in the laser frequency.
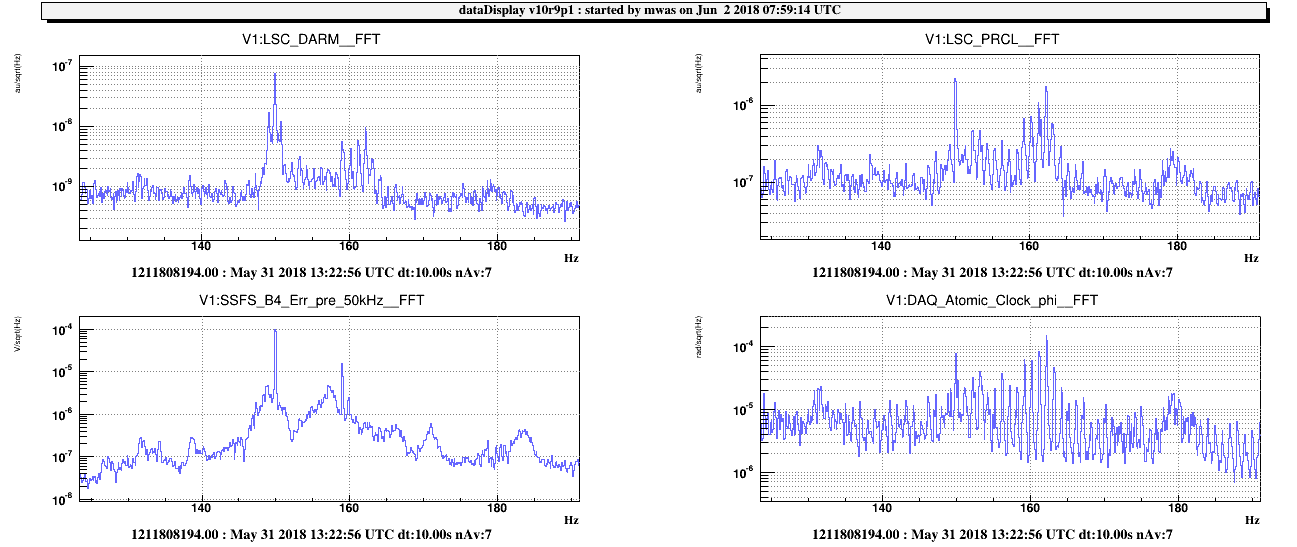
Figure 2 and 3, are zoom in on the forest at 380Hz and 160Hz. They do not change in height when changing the SSFS gain. This would suggest that the lines are polluting the SSFS error signal, and are then impressed on the laser frequency.
In addition the lines at 160Hz are not visible in the SSFS error spectrum, but are visible in the LSC B4 56MHz I channel, which is the same photodiode (but with the demodulation phase not necessarily well adjusted).
Looking at figure 4, these lines are clearly visible in the demodulated signal of the atomic clock 10MHz signal. So the likely origin of these lines, is the demodulation phase noise spoiling the SSFS error signal by mixing it with the MICH error signal.
10 days ago this was already present, and the demodulation phase noise multiplied by the MICH error signal are clearly coherent at these frequencies (160Hz and 380Hz).

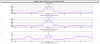
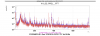
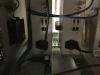
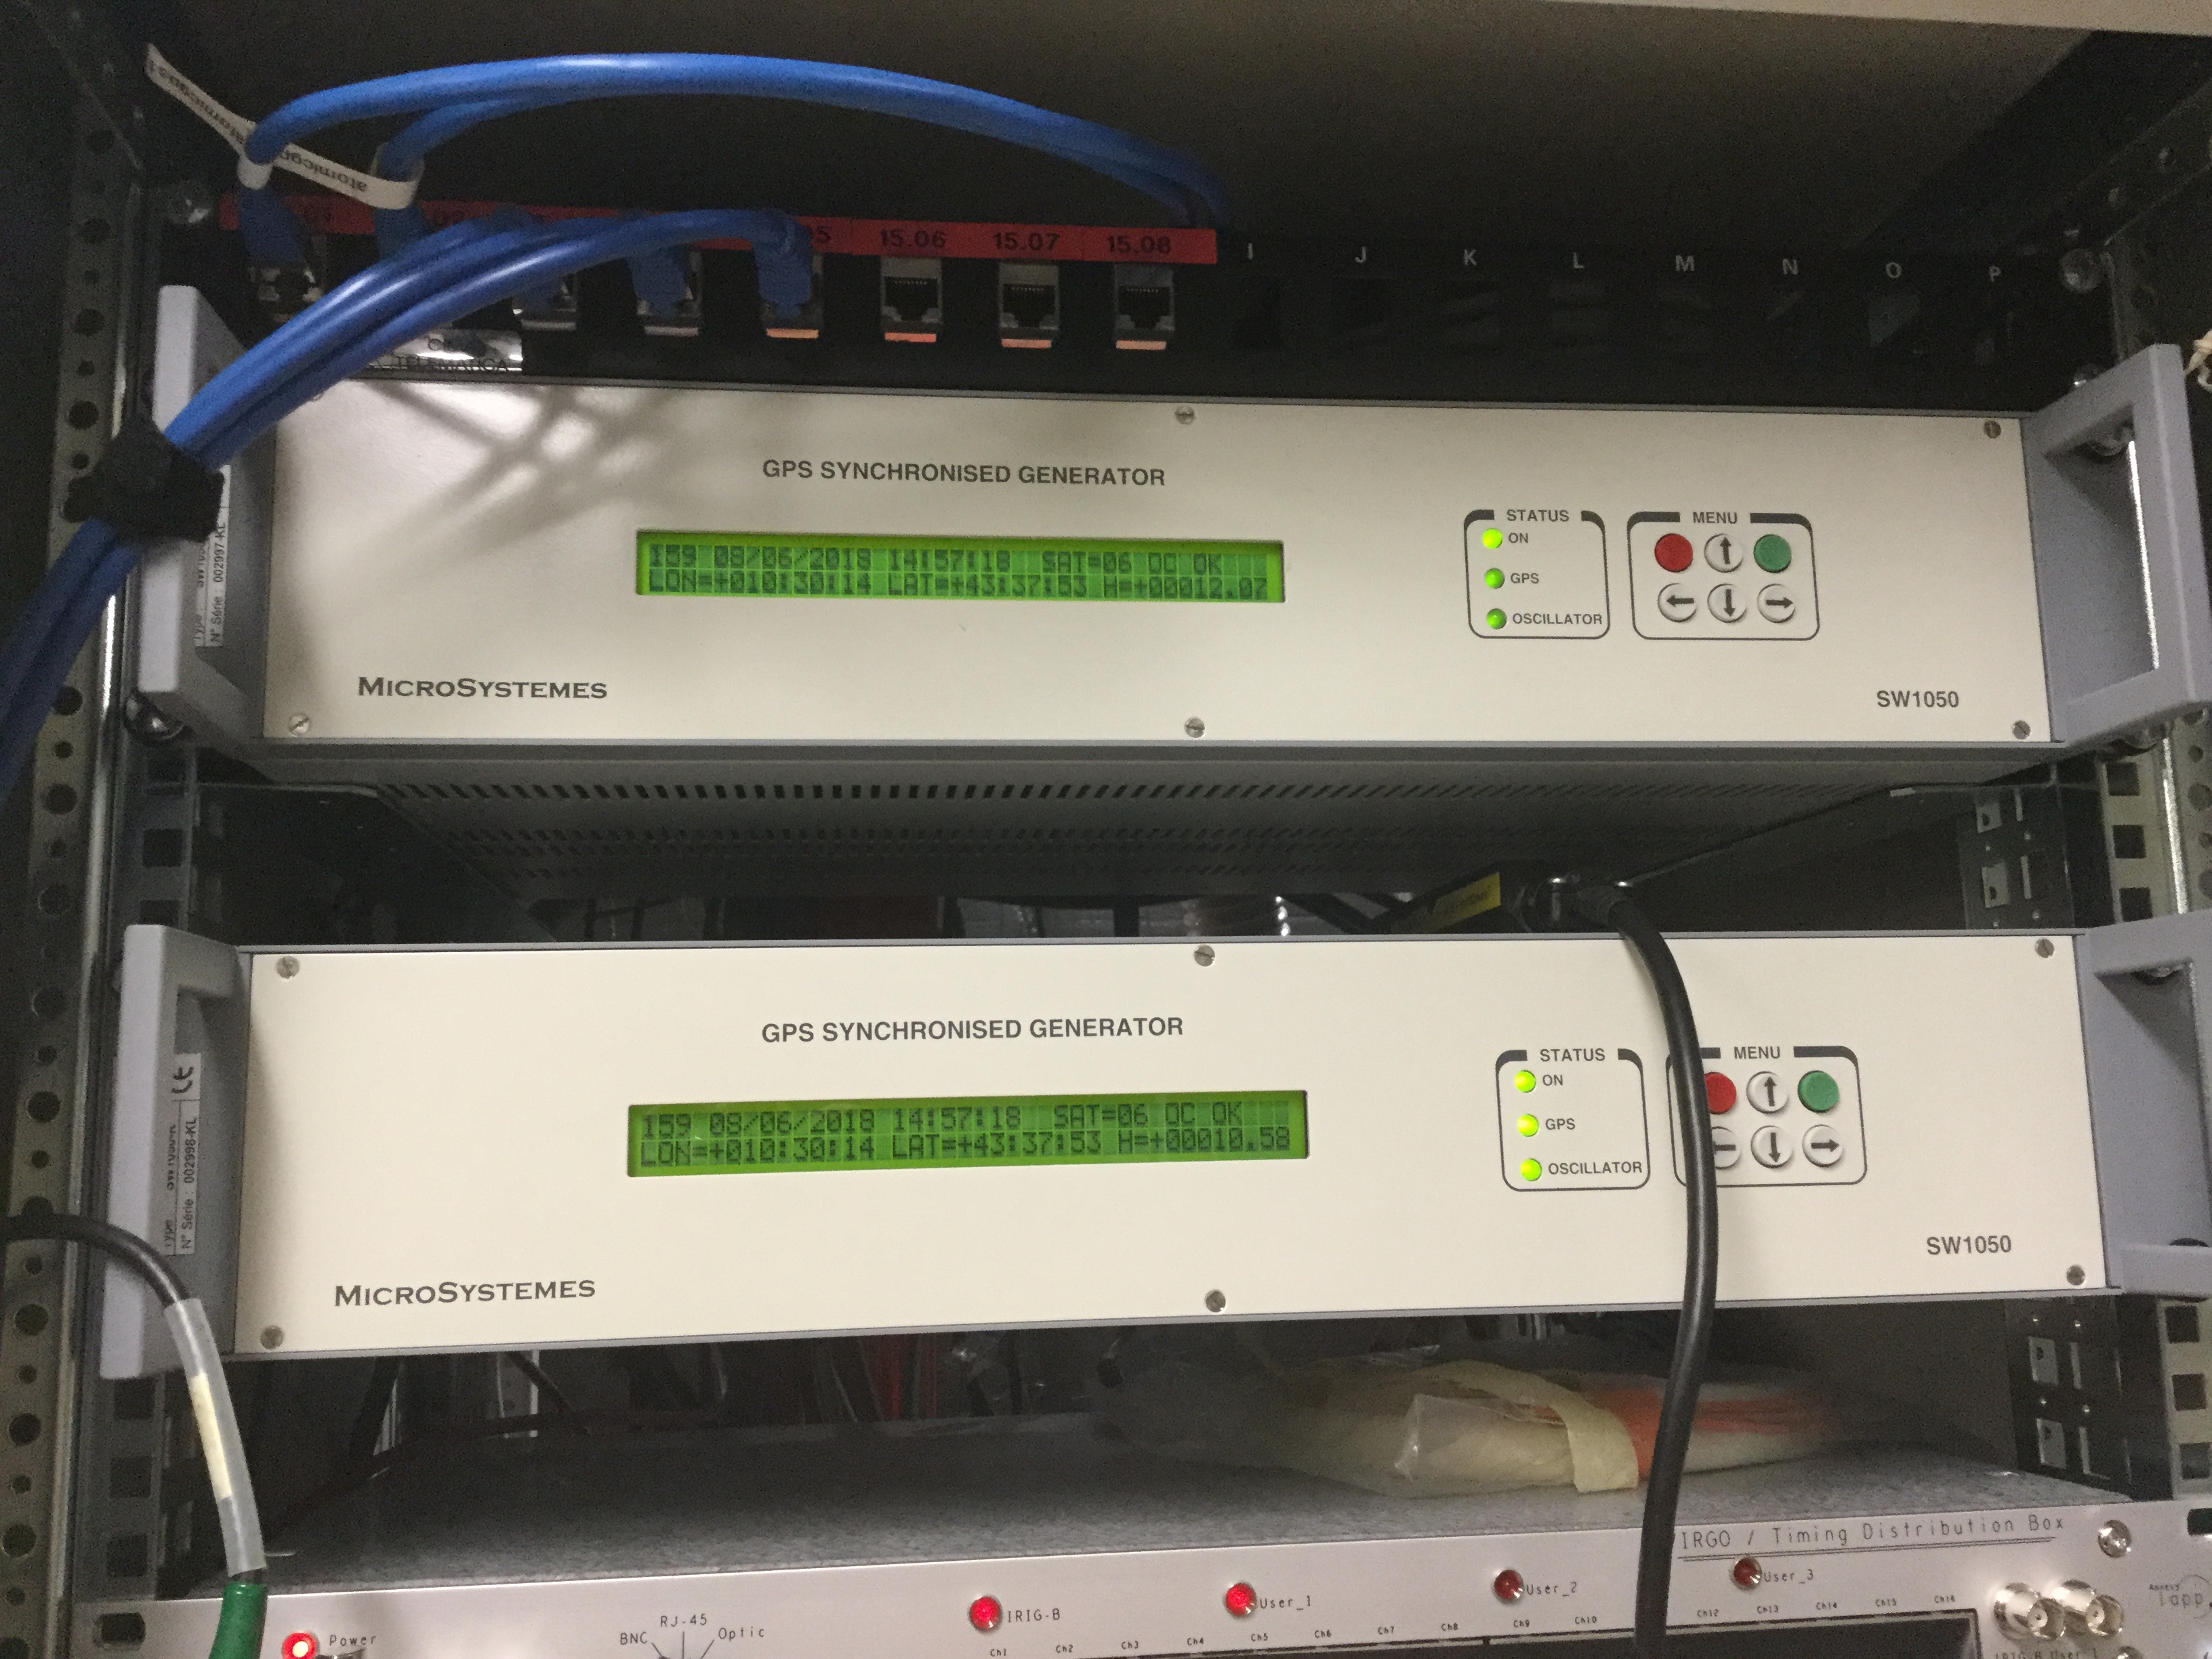
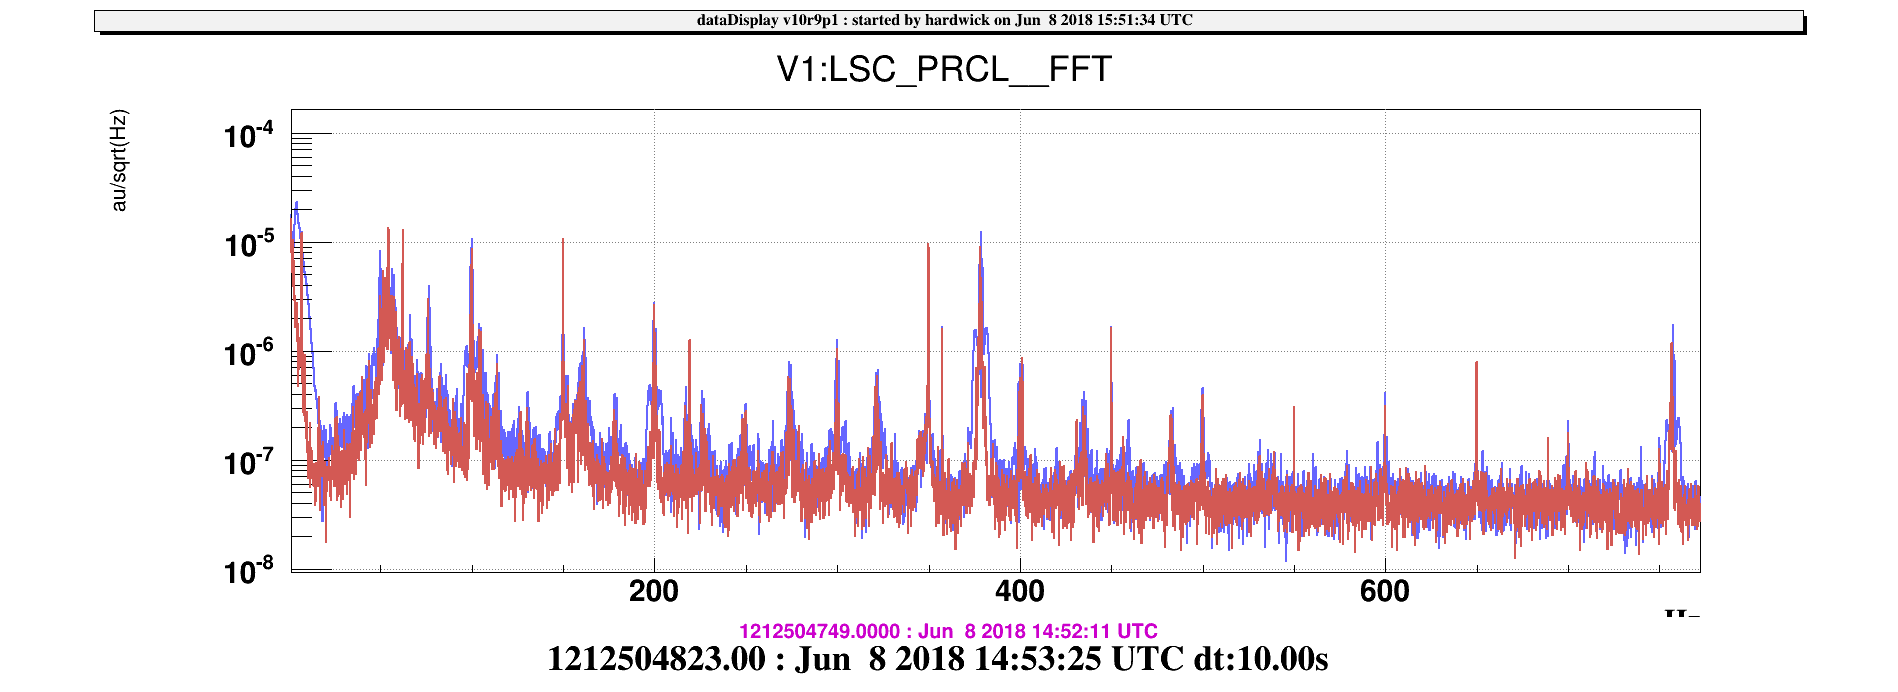
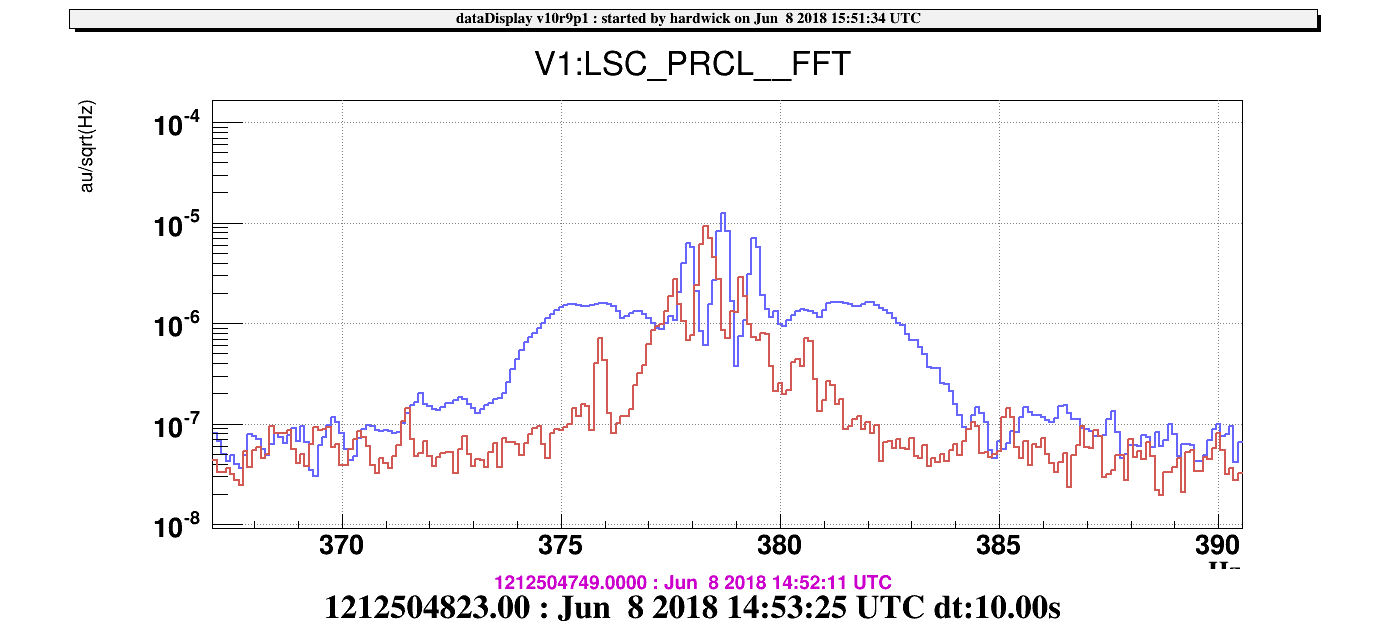
Tapping on only this chassis at ~4 Hz generates ~4 Hz sidebands on many of the frequencies that responded to the previous temperature test, namely 100 Hz and harmonics and 378 Hz and harmonics. Broad spectrum during no tapping (red) and tapping (blue) attached, along with example zoom around 378 Hz peaks.
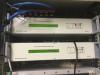
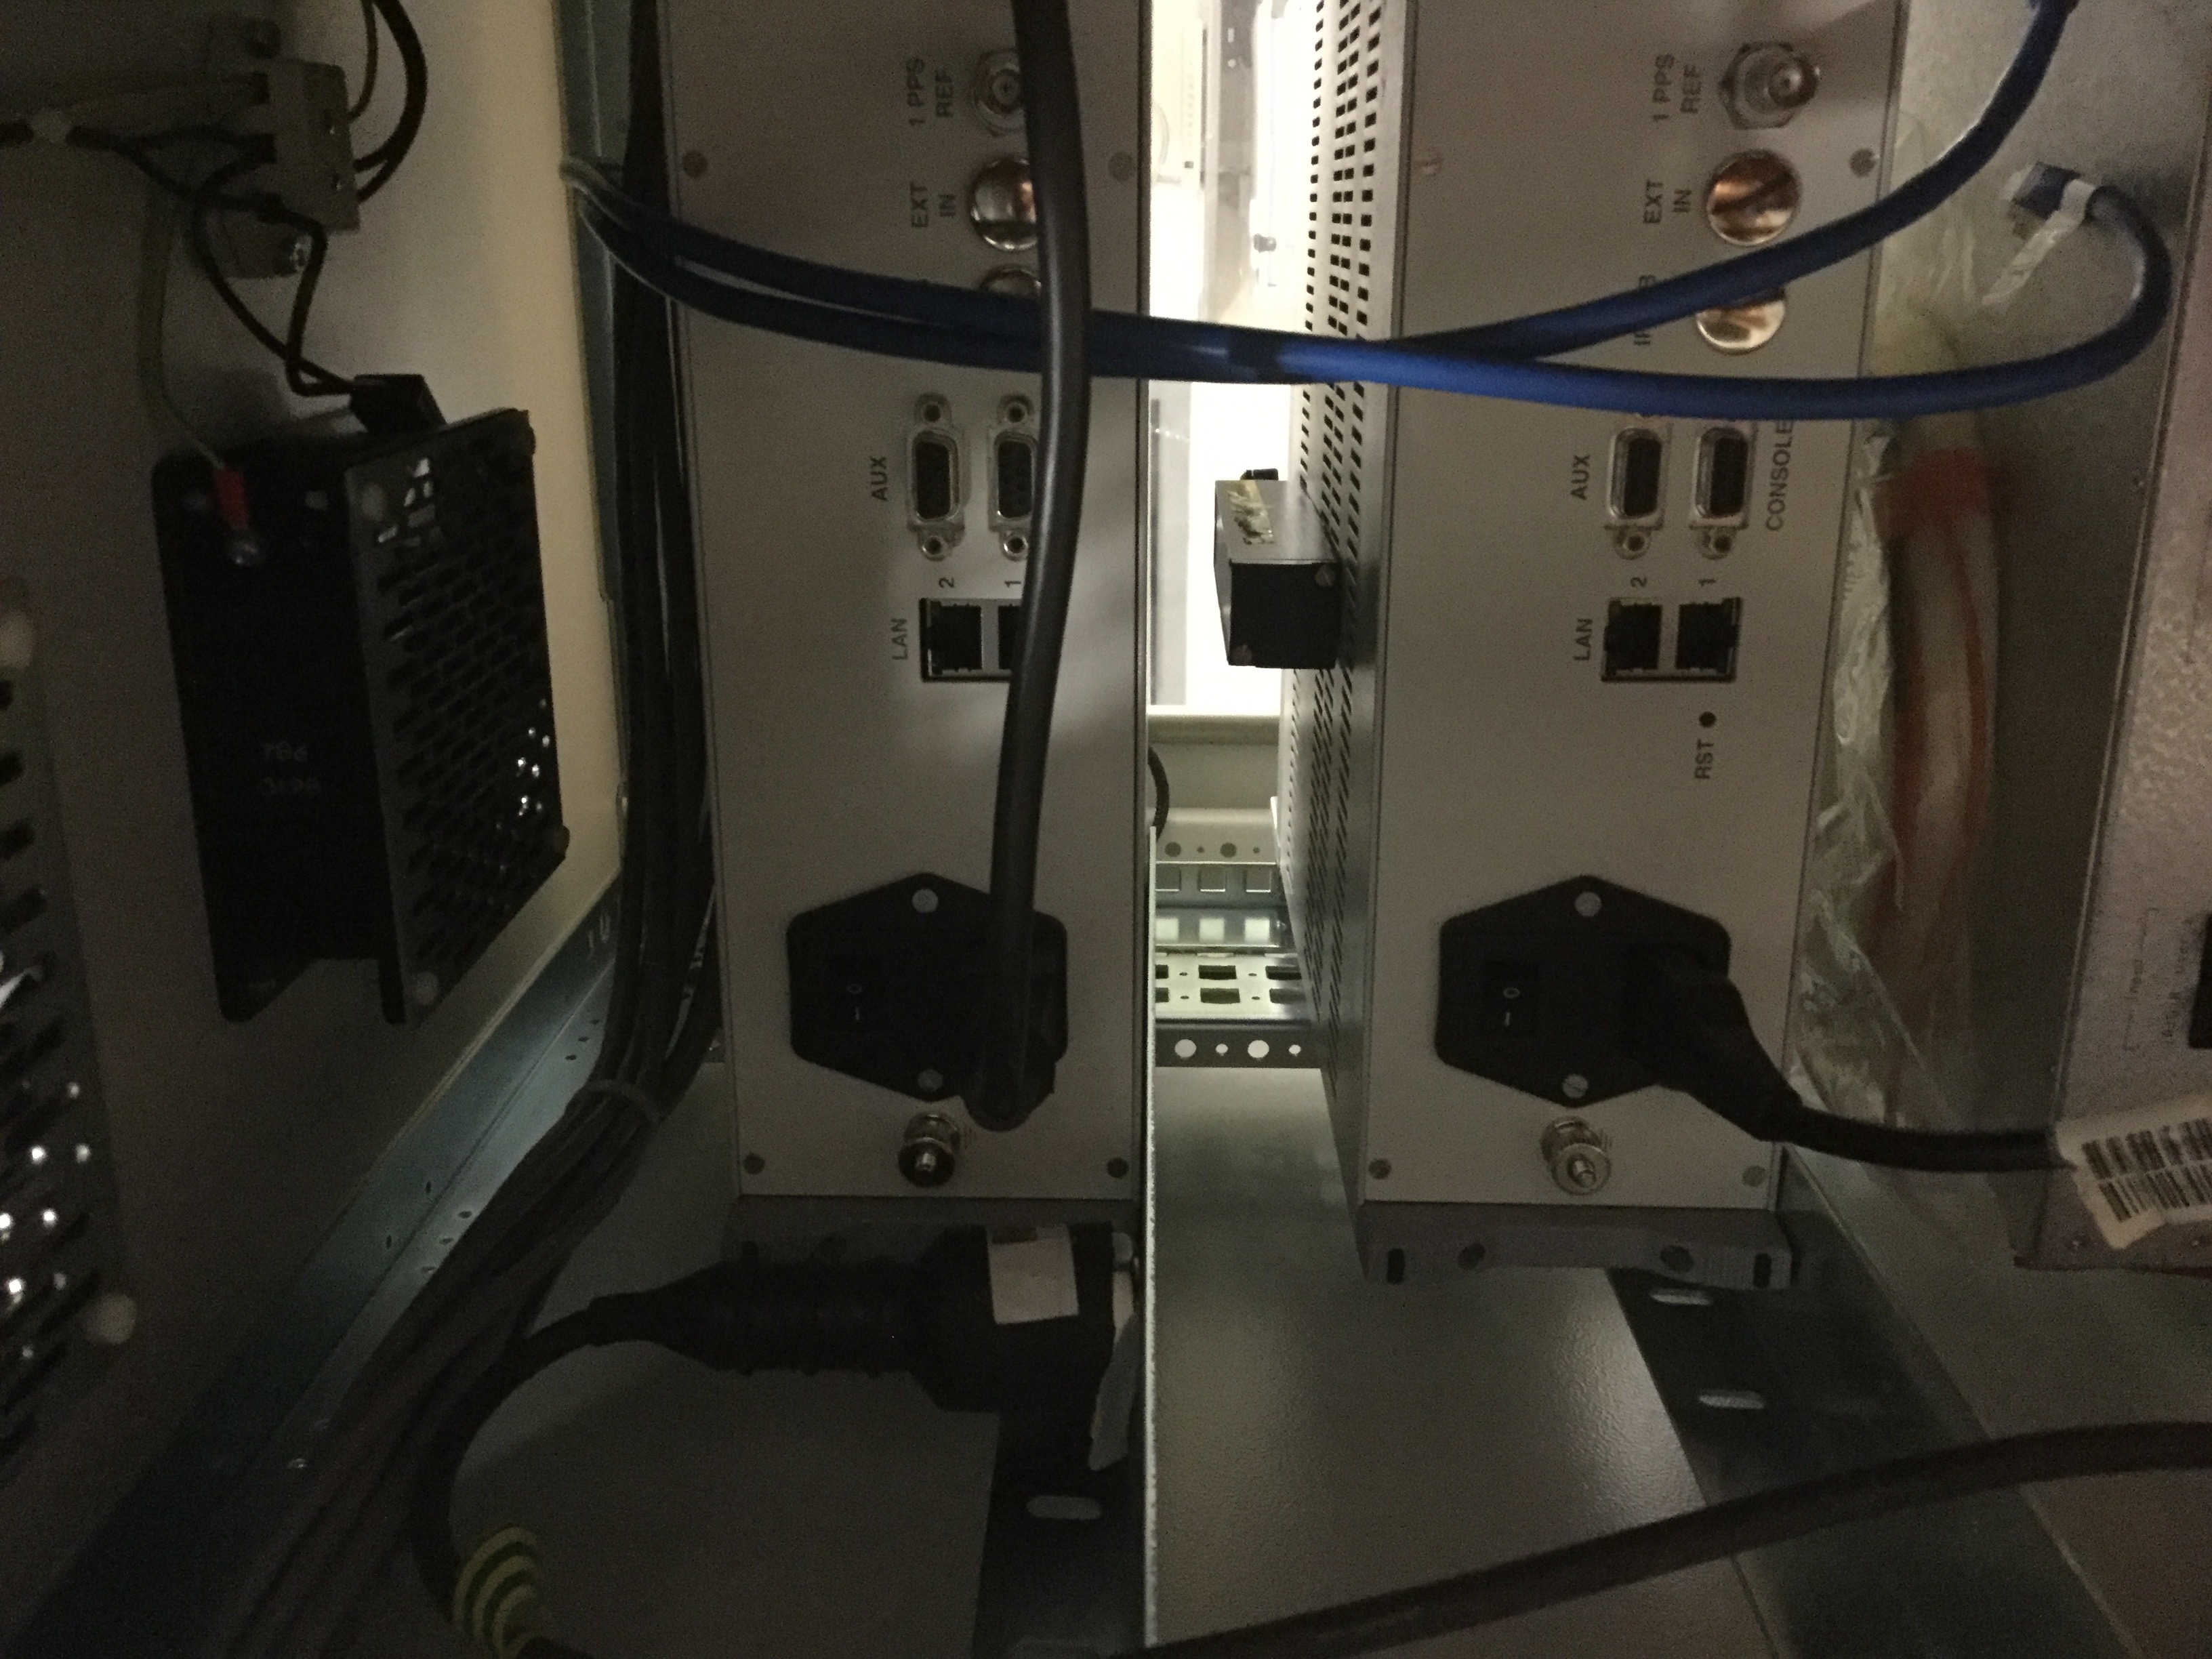
We have attached an accelerometer and a magnetometer (last photo attached) to this timing chassis; peaks at above mentioned frequencies were not visible in the sensors but we will look for coherence over the weekend.