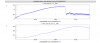
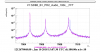
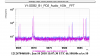
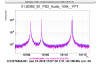
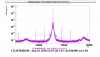
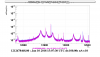
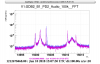
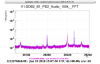
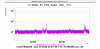
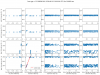
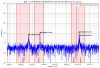
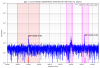
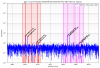
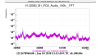
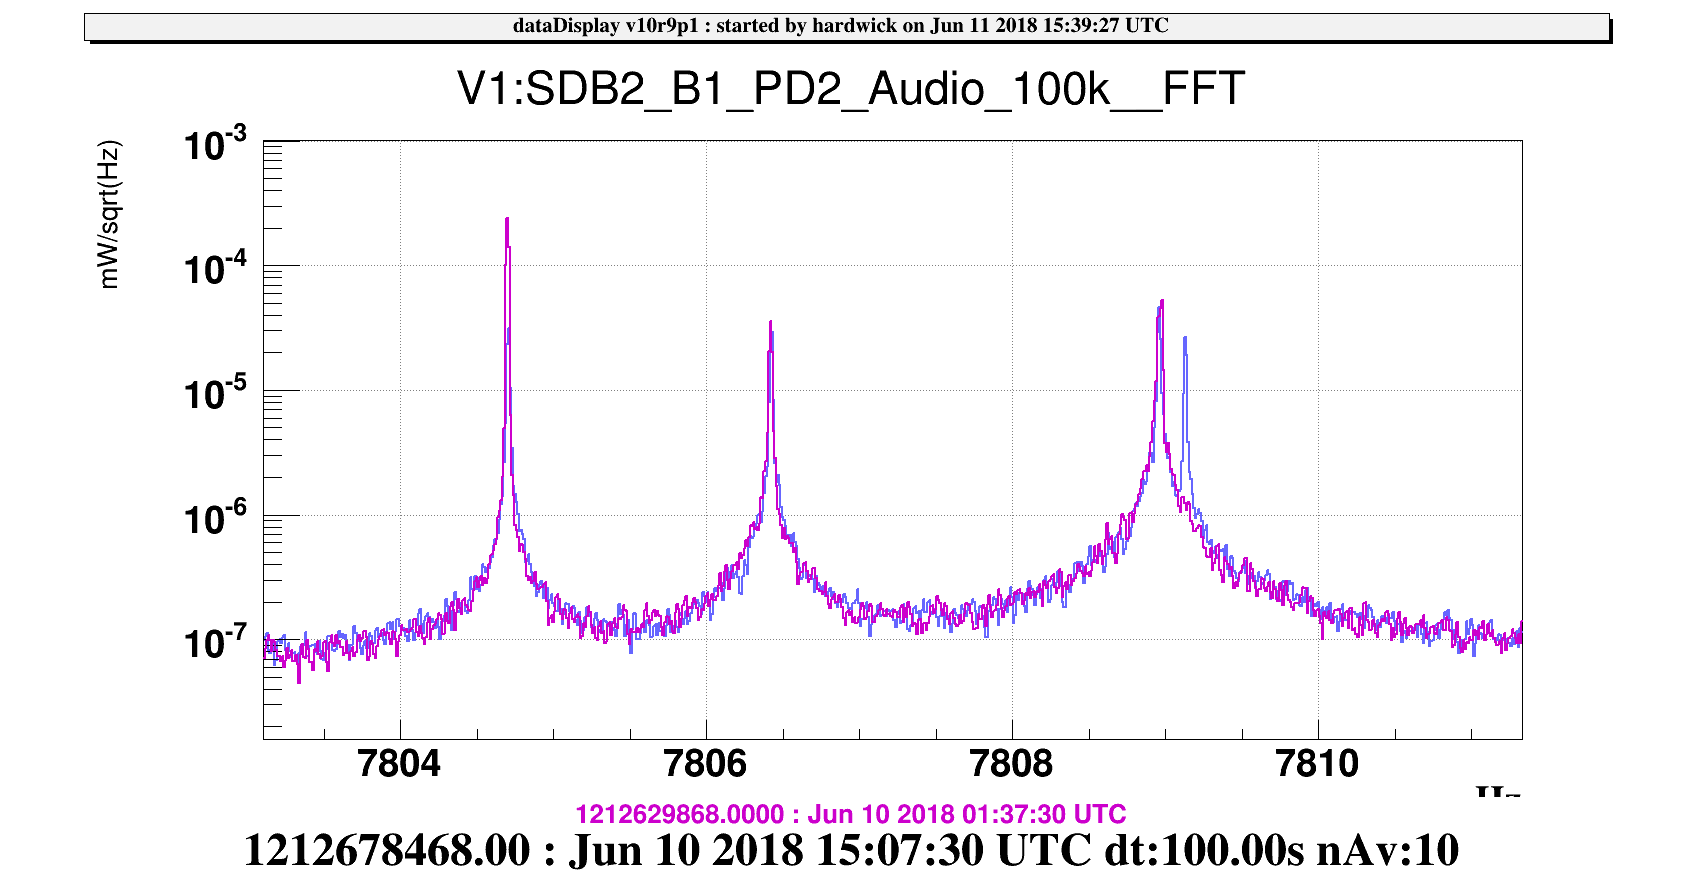
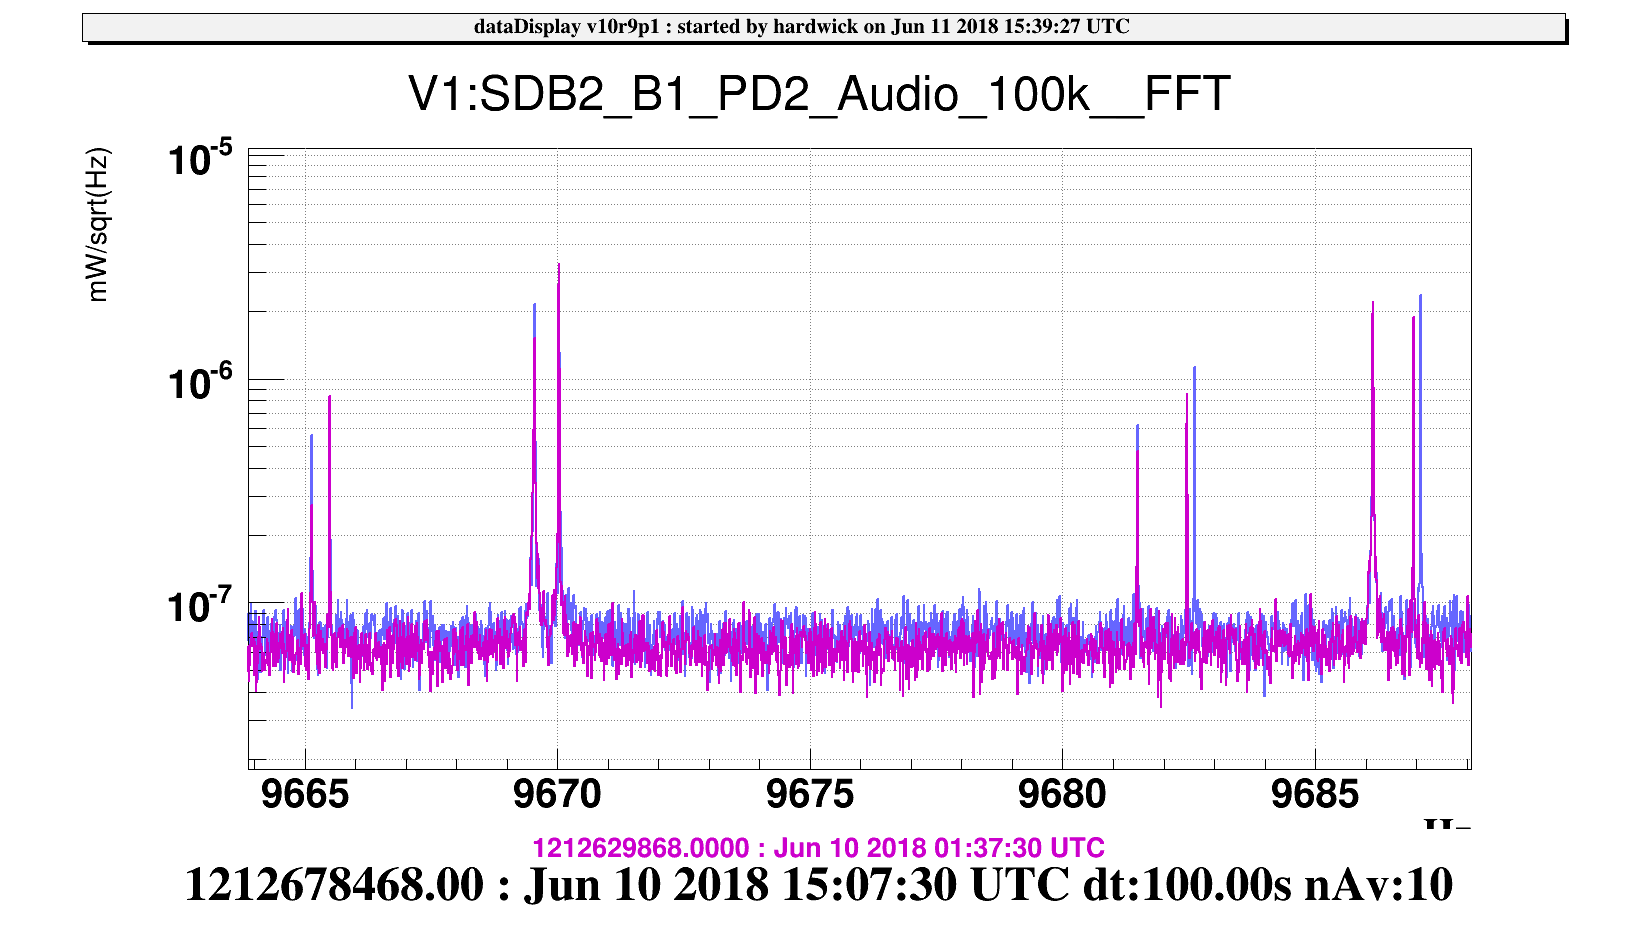
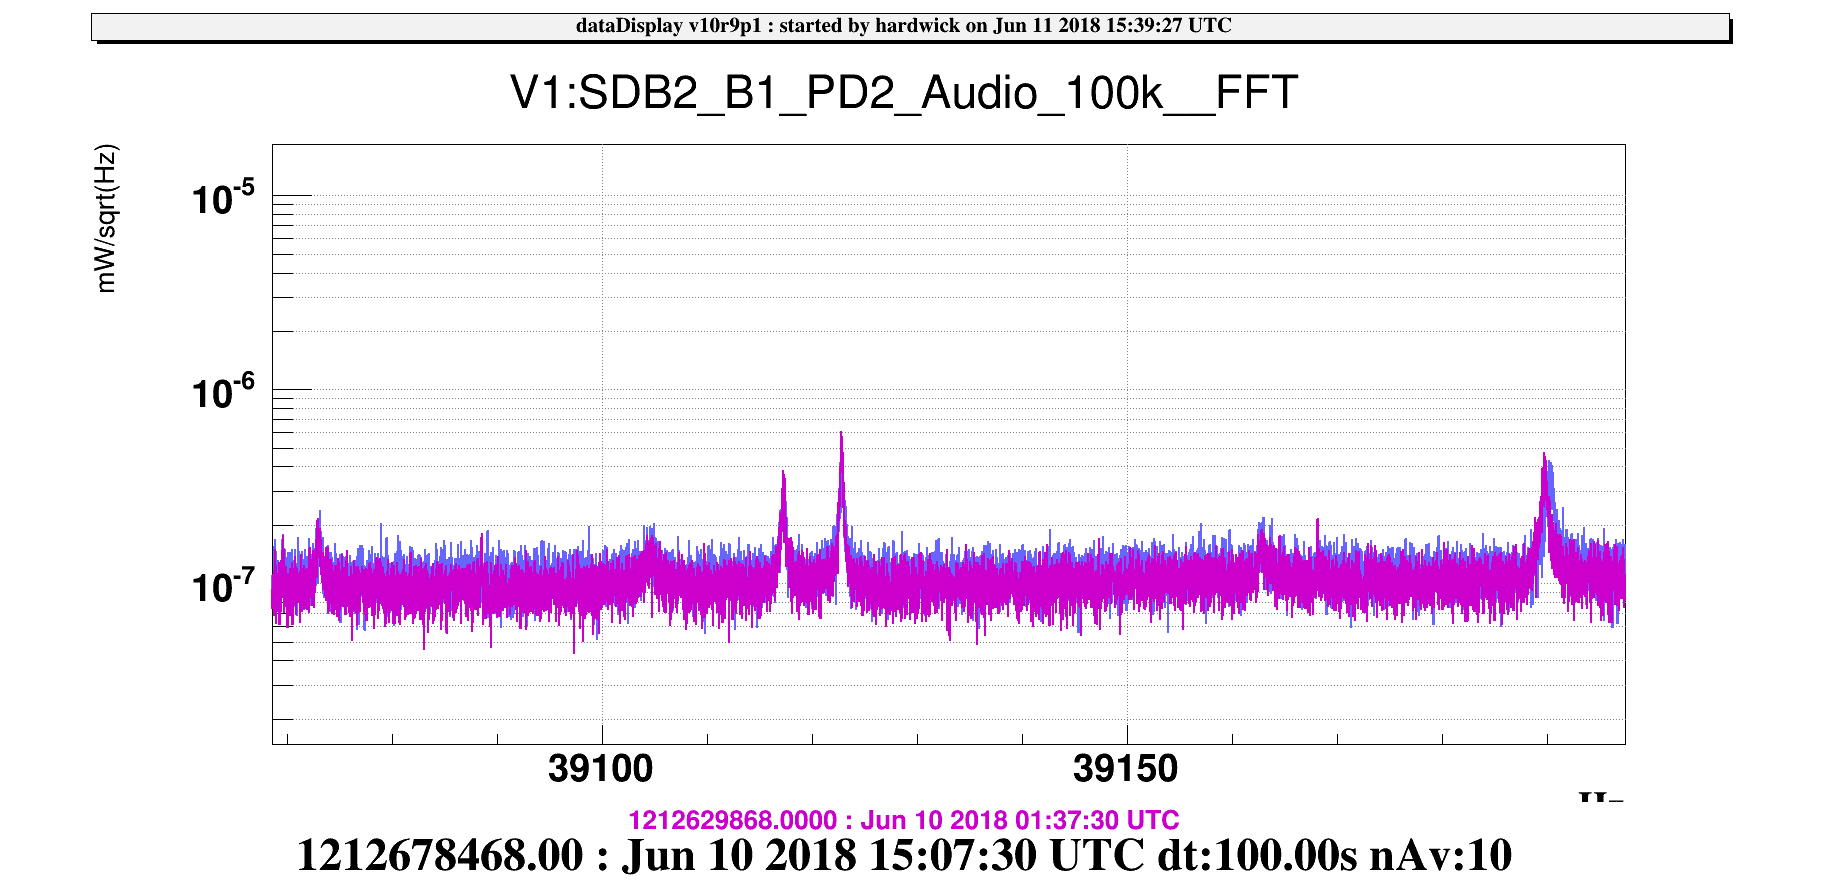
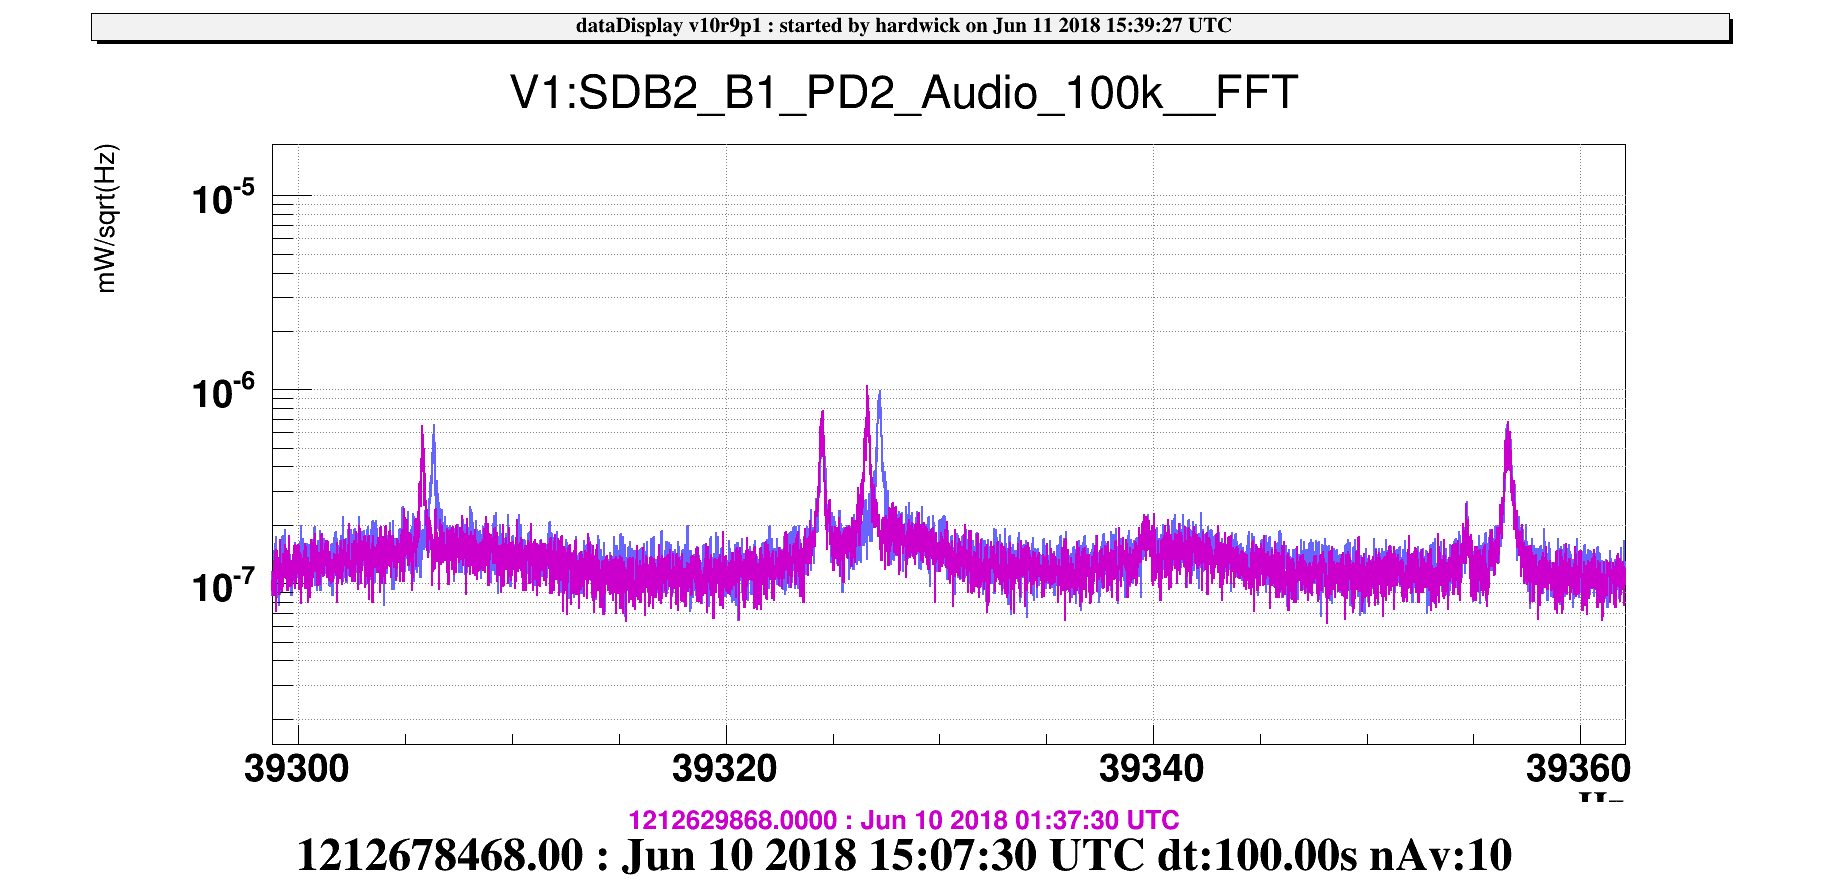
I've used the large temperature change over the past weekend to identify WETM mirror modes. - - - - - - Eigenfrequencies of the test masses are proportional to square root of Young's modulus: f ~ E1/2, where E := Young's modulus. The Young's modulus for fused silica has some temperature dependence ( measured to be (dE/dT)/E = 1.52e-4 / K ); as temperature increases, Young's modulus increases, so the mode frequency increases over a lock stretch with self heating, ring heaters, or with a strong ambient temperature increase. With the accidental temperature change test at WE over the weekend (starting Sunday morning ~1:00 UTC, log 41771), we are thus able to identify modes of of the West End mirror by their frequency shifts. The first attachment shows the rise of the room temperature on the top and the subsequent rise of the ring heater temperature sensor on the bottom, the latter lagging by ~6.7 hours. In the rest of the attachments, I zoom into relevant frequency bands (specified in name of attachment) of the high rate V1:SDB2_B1_PD2_Audio_100k channel. We had two several hour locks on Sunday during the WE temperature change, the first lock starting shortly before the temperature change began. In the plots, purple is taken at the beginning of the first lock and blue is taken at end of second lock, at which point room temp had increased by 1 C and RH temp had increased by 0.2 C. I have tried to highlight bands expected to have the highest parametric gain according to Dan Hoak's document VIR-0525A-16, but some bands I couldn't identify. Of note: - 7.8 kHz (Drum modes): In 41732, Swinkels noted the missing drum mode; as he suspected, we have two test masses with nominally same drum mode frequency ~7809 Hz. WE mirror drum mode was revealed with temp change. - 9.6 kHz: It had been thought that there was a mode group around 9670 Hz and 9685 Hz, but this indicates that the two mode groups are mixed. - 10.1 kHz: again, two masses with almost same nominal mode frequency - 12.8 kHz: what looks like a test mass mode with rather high amplitude, high PI gain? This would interact with LG02. - - - - - - Note: There are upcoming ring heater tests of the end mirrors which will further help with mode identification since the ring heaters will be stepped one at a time. keywords: parametric instability, PI, mirror modes, temperature change

Bas pointed out that drum mode tracker is not useful anymore because of the frequency shift (logbook #41732). But the temperature change in WE (logbook #41771) shifted the drum mode frequency to higher frequencies, and TCS_ETALON_XX_DRUM2_FREQ luckily could track this shift.
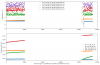
I did a similar analysis done a year ago (logbook #39039) to see the temperature dependence. Figure 1 is the plot comparing drum mode frequencies with NI,WI,NE,WE ring heater temperatures. You can see that TCS_ETALON_XX_DRUM2_FREQ follows ENV_TCS_WE_RH_TE. The temperature dependence is 0.85 Hz/K, which is consistent with a measurement done a year ago (logbook #39039). Other drum mode trackers are currently useless. We have to change the code to account for the frequency shift after the monolithic suspension installation.
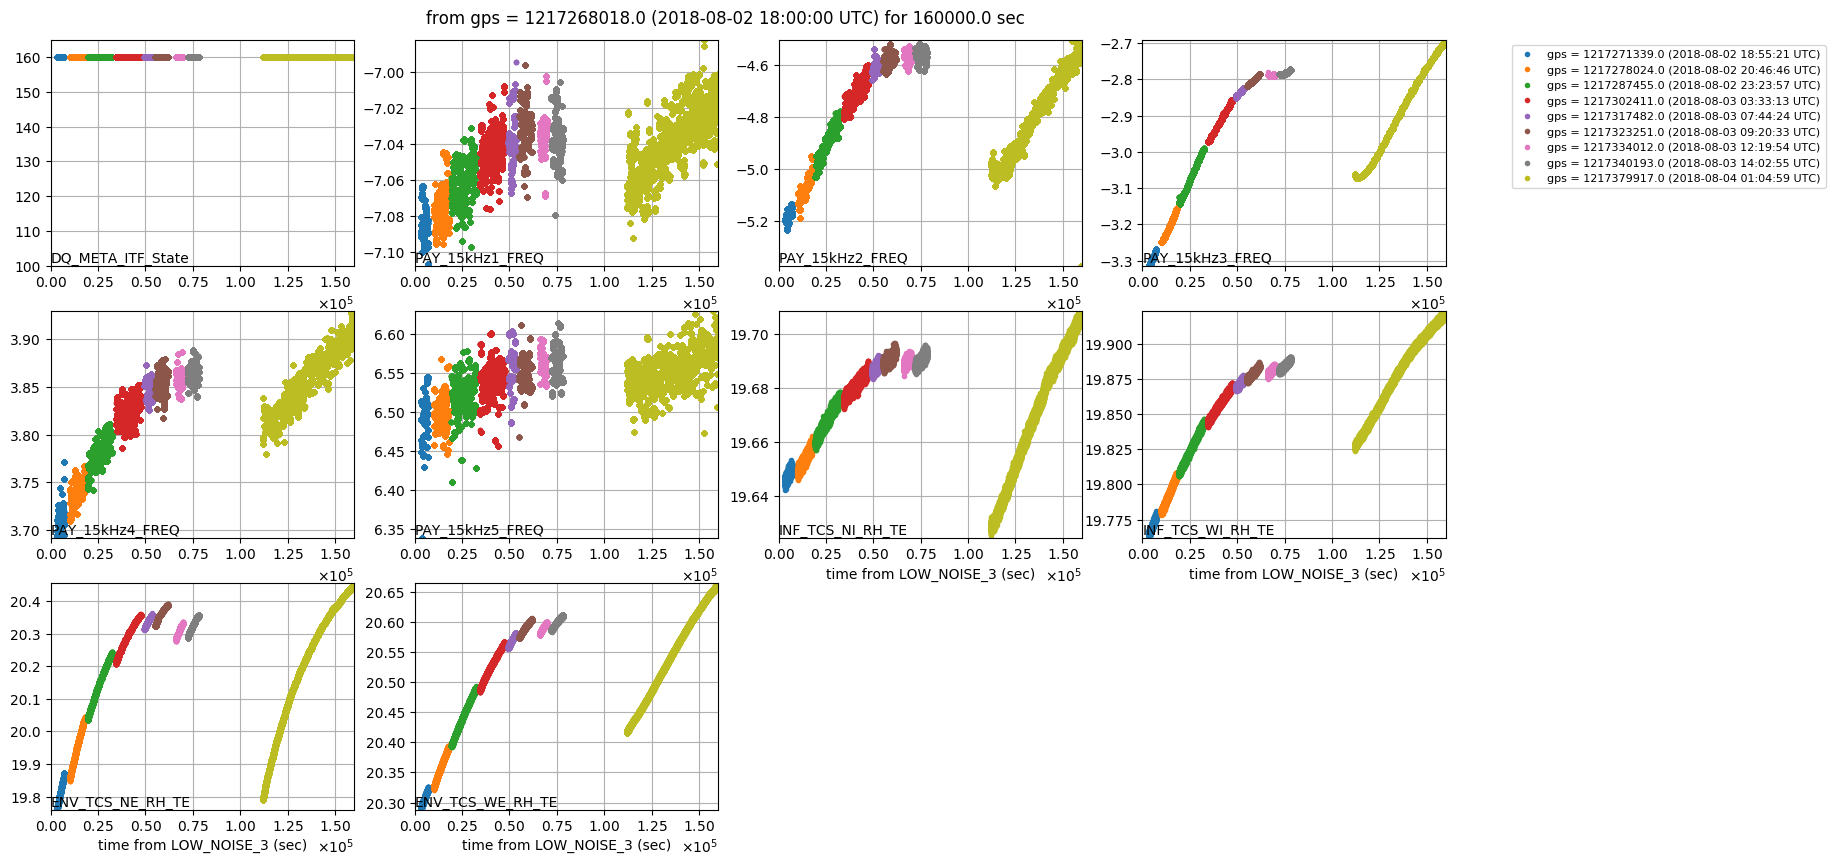
Figure 2 is the raw time series data used in this analysis. I only used the data when the interferometer is "locked" (LSC_B7_DC > 250).
See https://tds.virgo-gw.eu/ql/?c=13057
A first estimations of the Q's of this kind of mode indicate that for the WE mirror we are below 1e7 (from thermal peak).
Further investigation on the data are still ongoing.
Note (from Mwas on duplicate entry 41799): 'The line at 12.8kHz is not a mirror mode but the OMC1 length PZT dither at 12831.3Hz to get OMC lock signal. There should also be a line at 15569Hz which is the OMC2 length PZT dither.'
I confirm I also found the 15.5 kHz mode. Thank you!
We've updated Bas's drum mode tracker to the new frequencies (which shifted with the monolithic suspension install). We've also added 9.6 kHz modes.
Channels are:
- V1:PAY_DRUM#_AMPL and V1:PAY_DRUM#_FREQ where # = 1,2,3, or 4 in order of increasing frequency.
- V1:PAY_9pt6kHz#_AMPL and FREQ, where # = 1 - 8
These channels are available on MoniUsers starting 1212850711 (for Drum; 9pt6 came a few minutes later), at which time old channels (TCS_ETALON_XX_DRUM# and _WE_DRUM#) became unavailable.
Code available at /virgoDev/Automation/PyALP/PySpectral/algo.py.
Beamsplitter drum (~1875 Hz) and butterfly (~1256 Hz) now tracked as well as PAY_BS_DRUM/BUTTERFLY_AMPL/FREQ
Using the ring heater temperatures and line frequencies from the line tracker, the arm mirror modes upto 15kHz are identified.
For modes with higher frequencies, it was hard to identify from this method.
Summary:
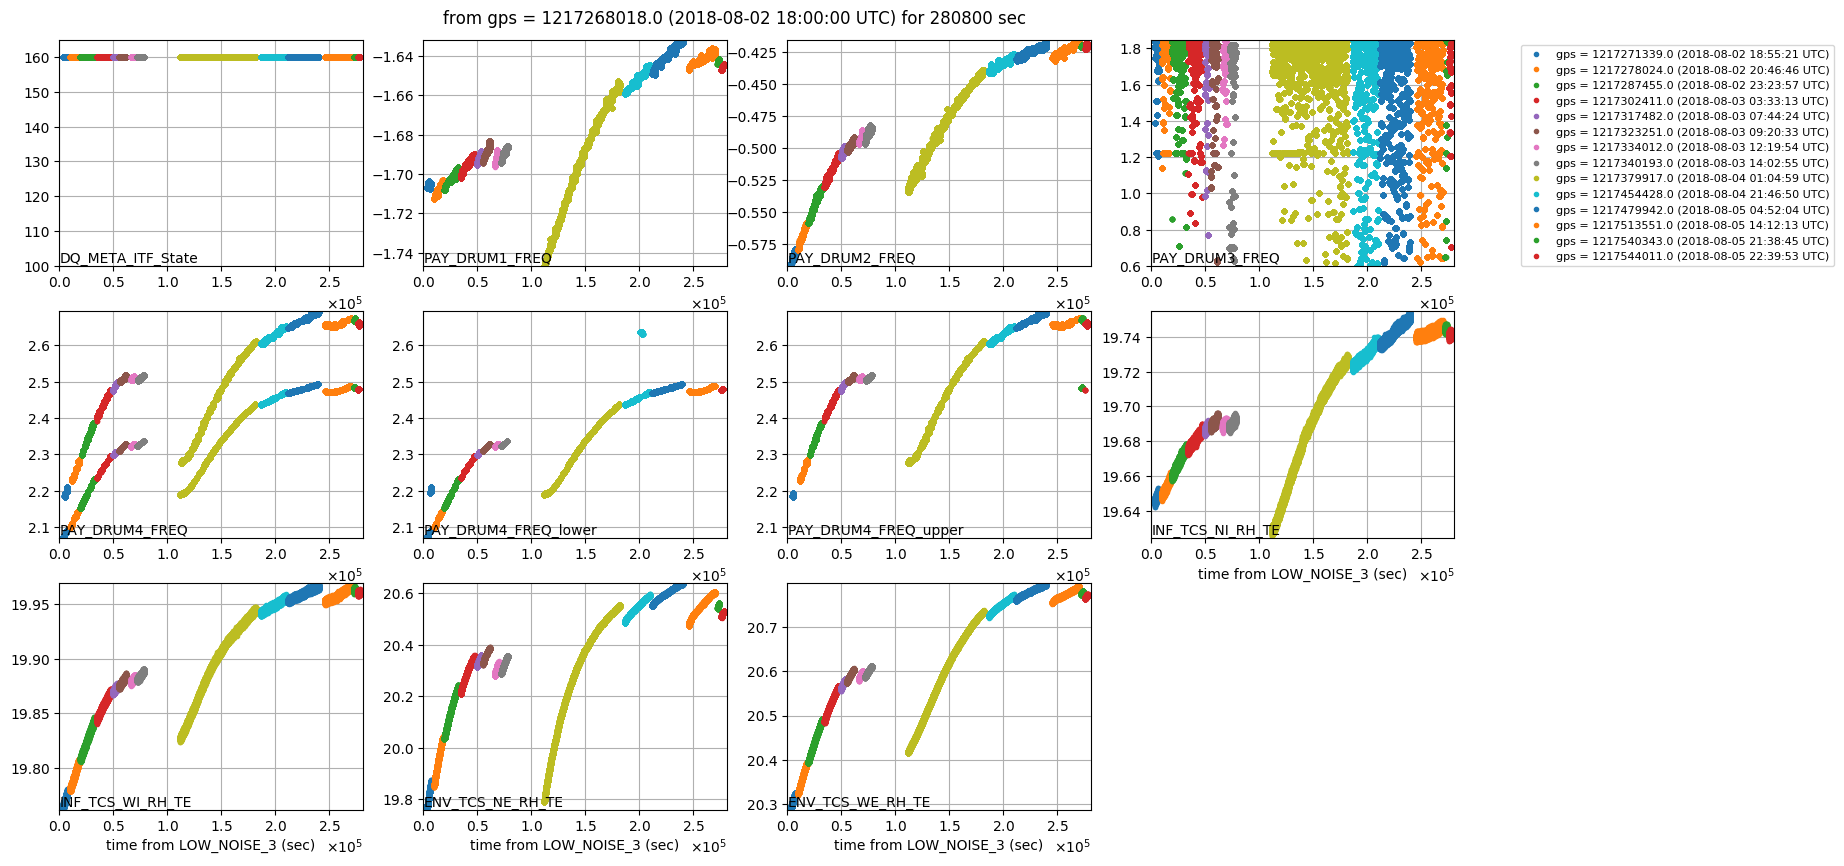
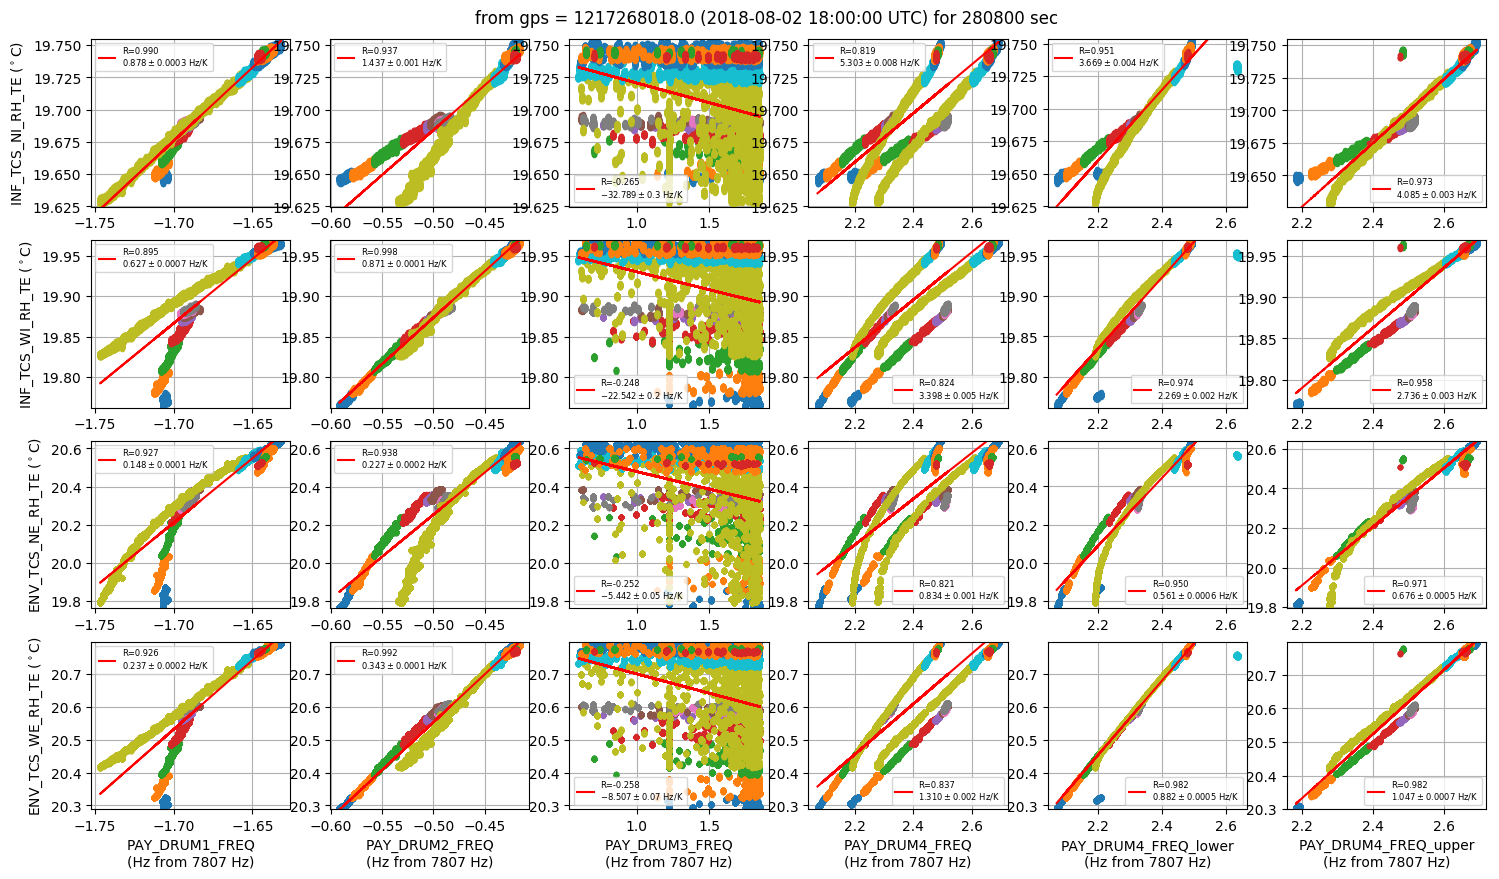
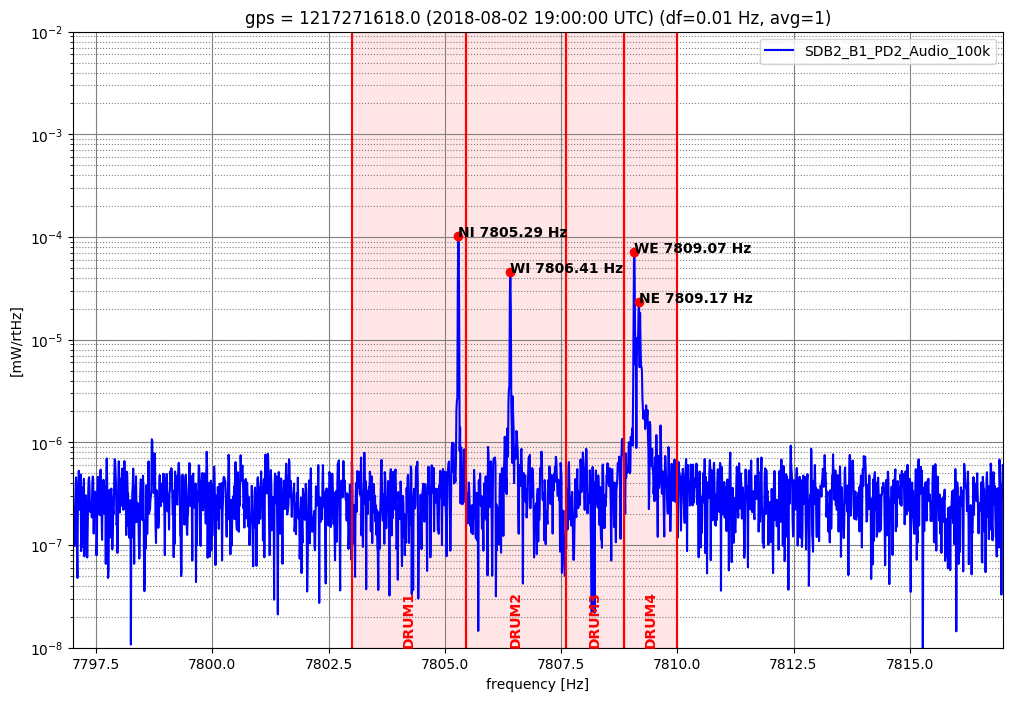
[Drum modes around 7.807kHz (time series plot, temperature vs line frequency plot, B1 spectrum)]
PAY_DRUM1_FREQ: NI 0.878 Hz/K
PAY_DRUM2_FREQ: WI 0.871 Hz/K
PAY_DRUM3_FREQ: currently no line in the band
PAY_DRUM4_FREQ: lower frequency is from WE 0.882 Hz/K, upper frequency from NE 0.676 Hz/K?
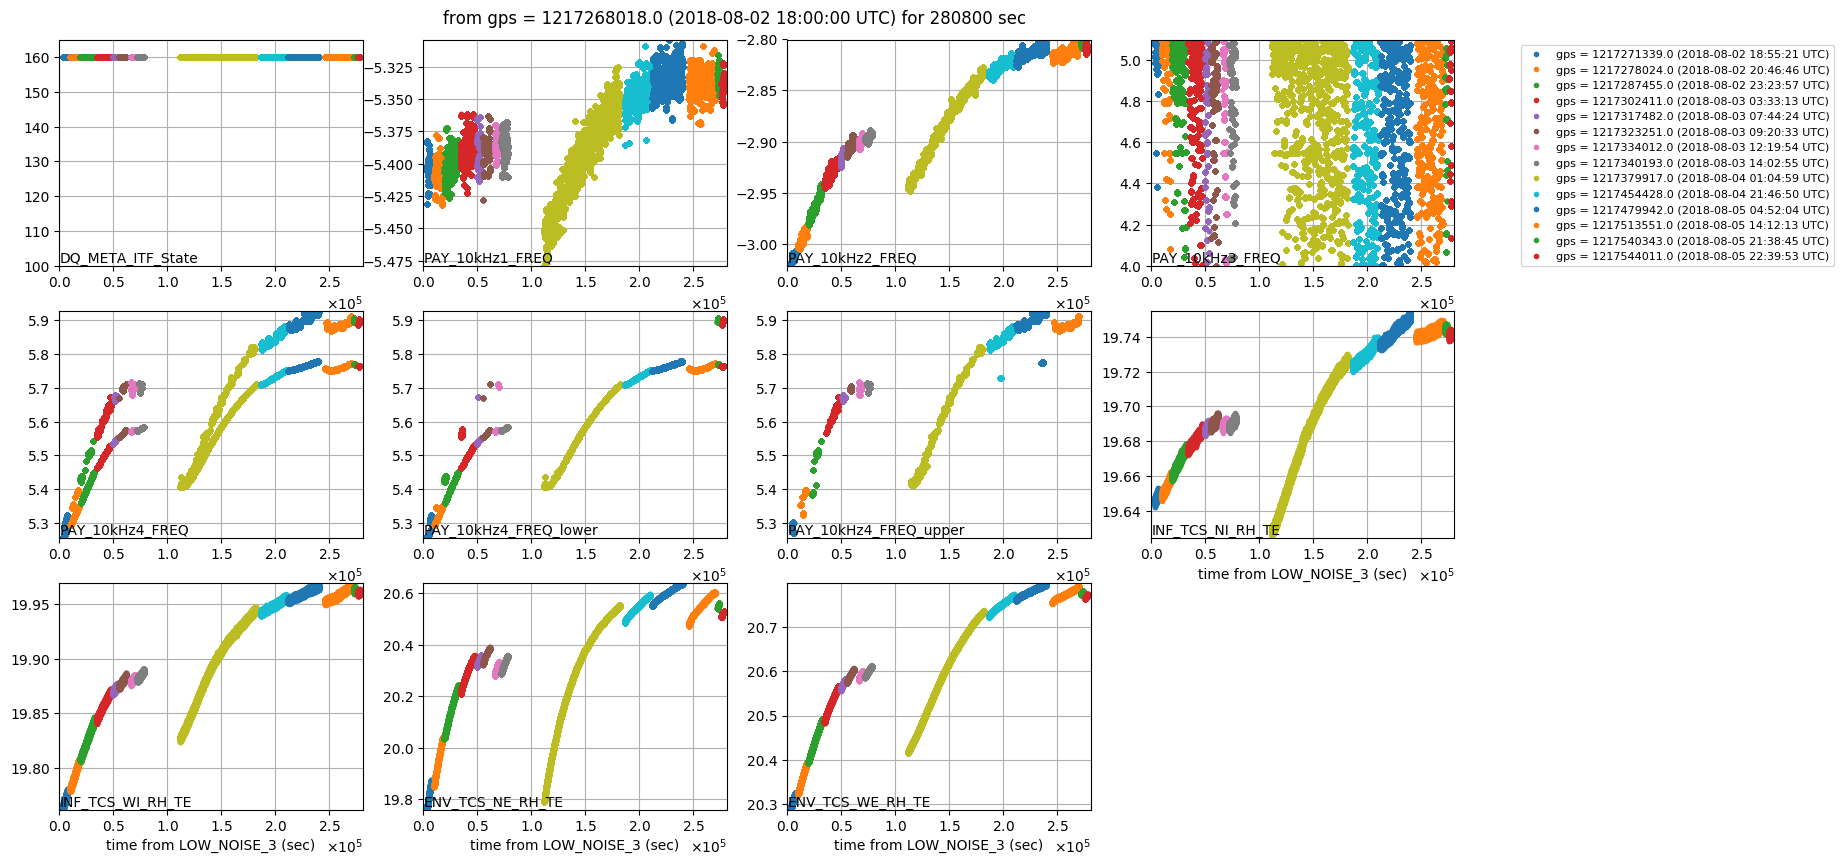
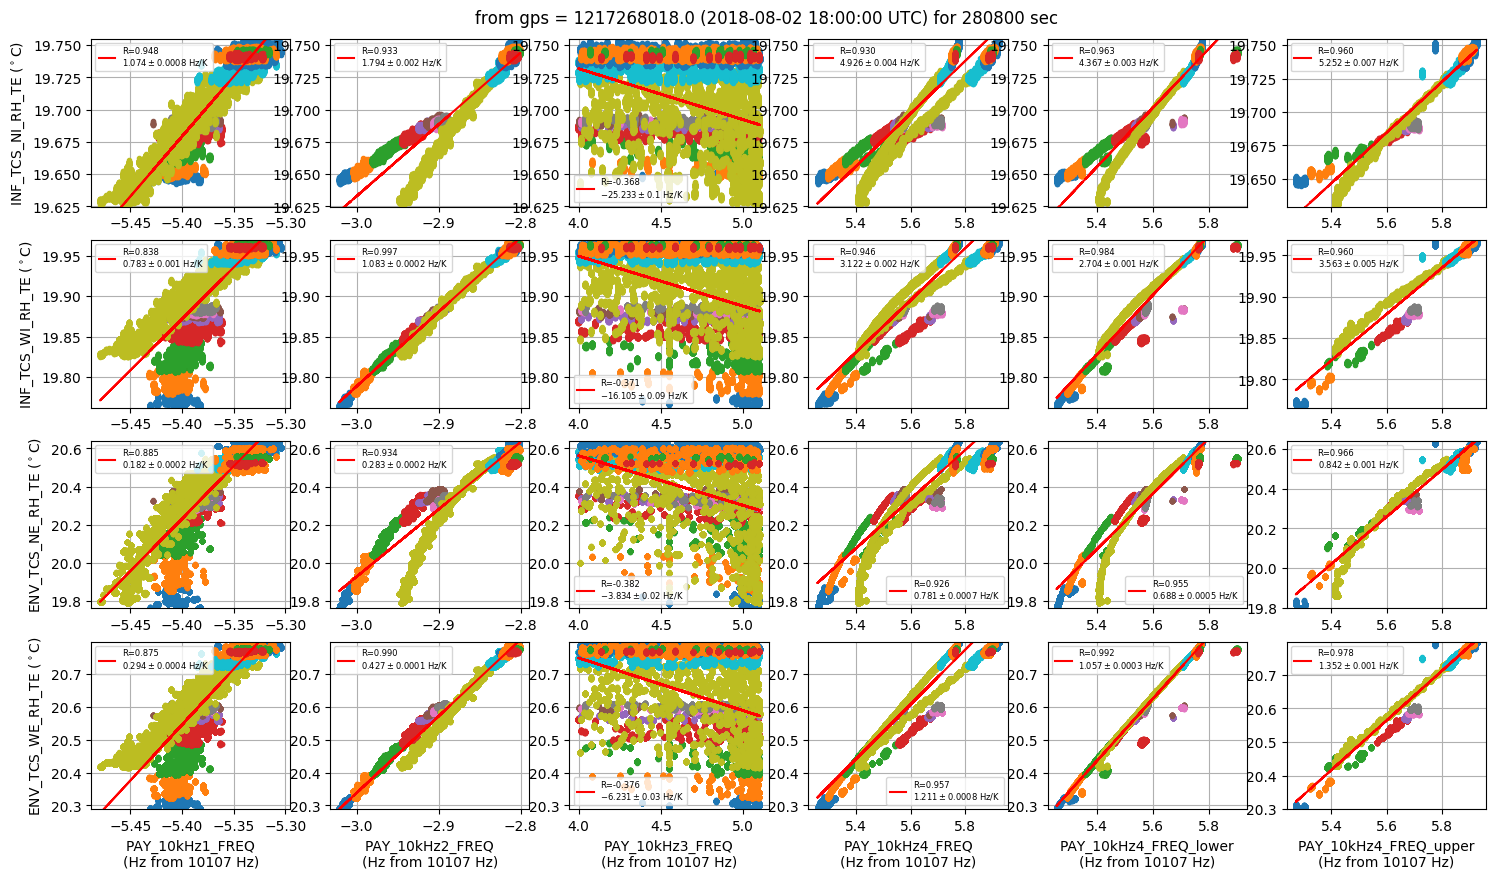
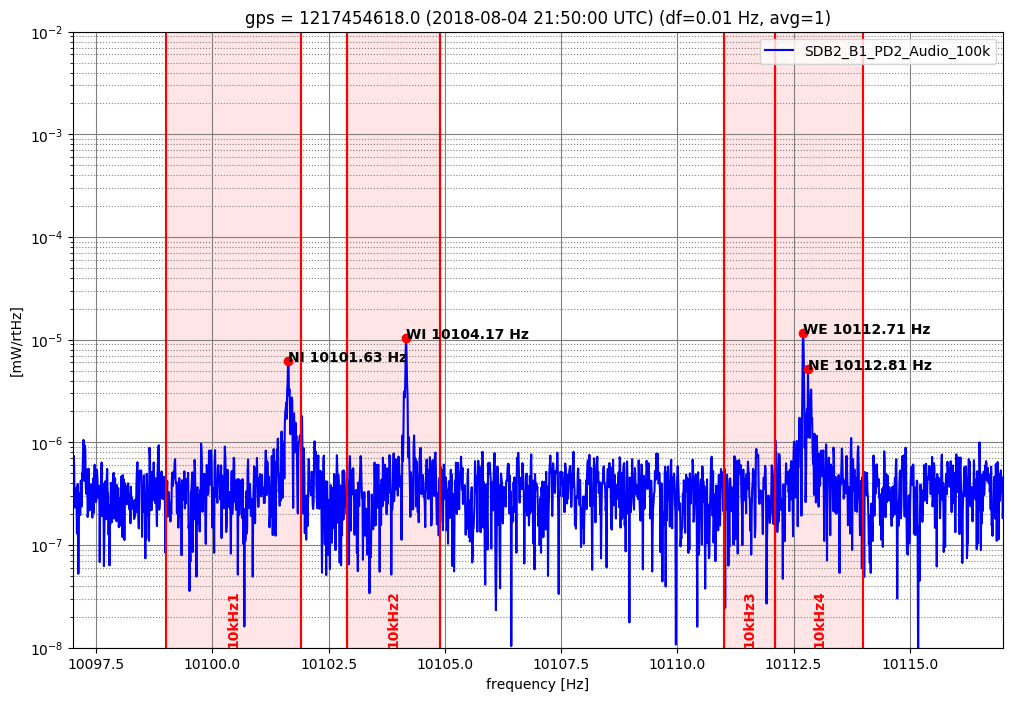
[Modes around 10.107kHz (time series plot, temperature vs line frequency plot, B1 spectrum)]
PAY_10kHz1_FREQ: NI 1.074 Hz/K
PAY_10kHz2_FREQ: WI 1.083 Hz/K
PAY_10kHz3_FREQ: currently no line in the band
PAY_10kHz4_FREQ: lower frequency is from WE 1.057 Hz/K, upper frequency from NE 0.842 Hz/K?
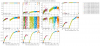
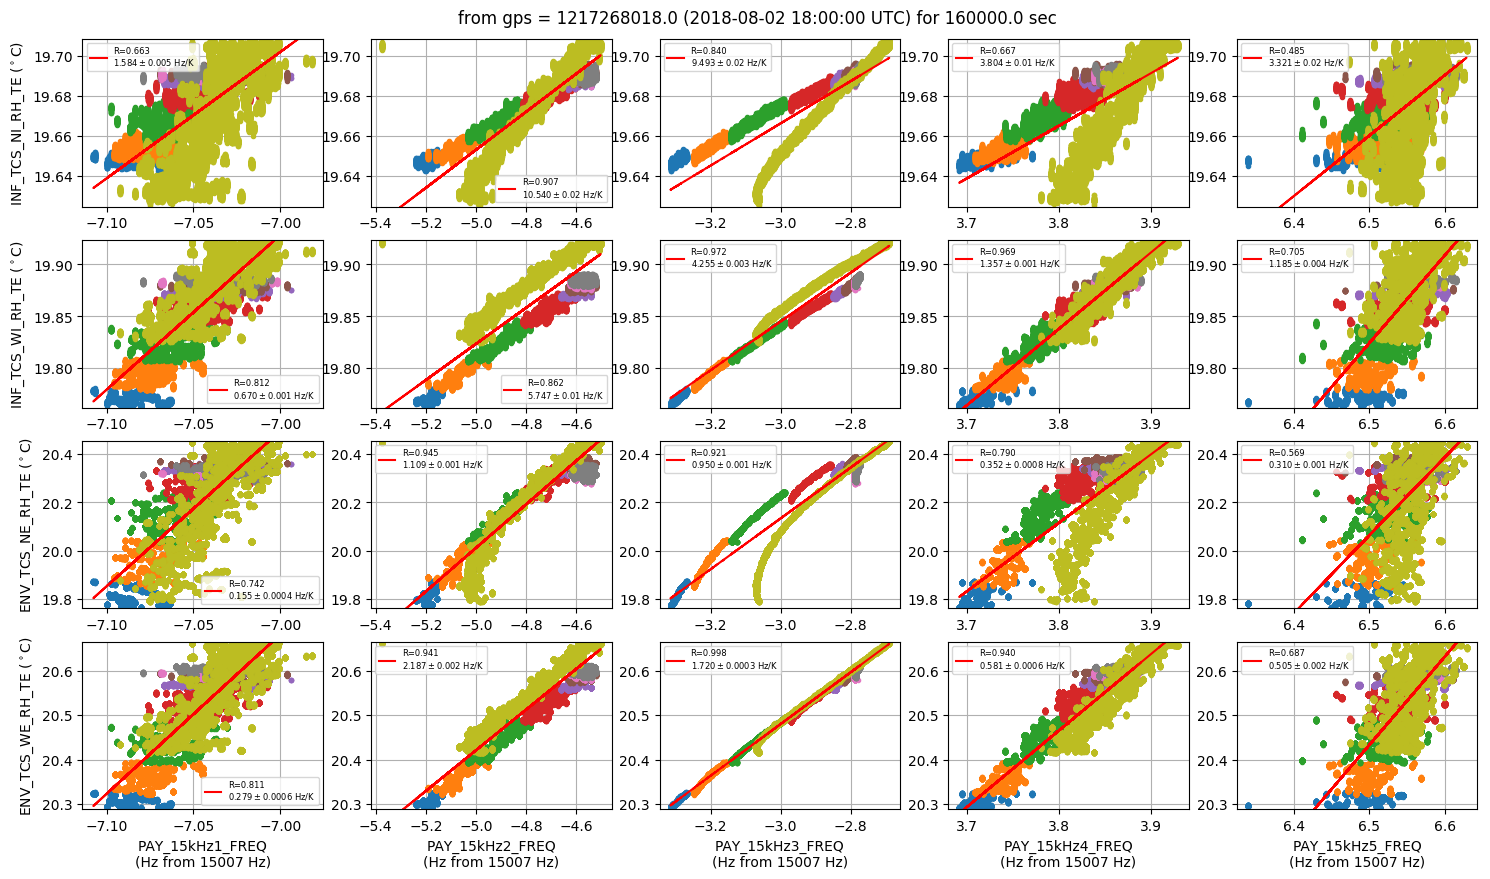
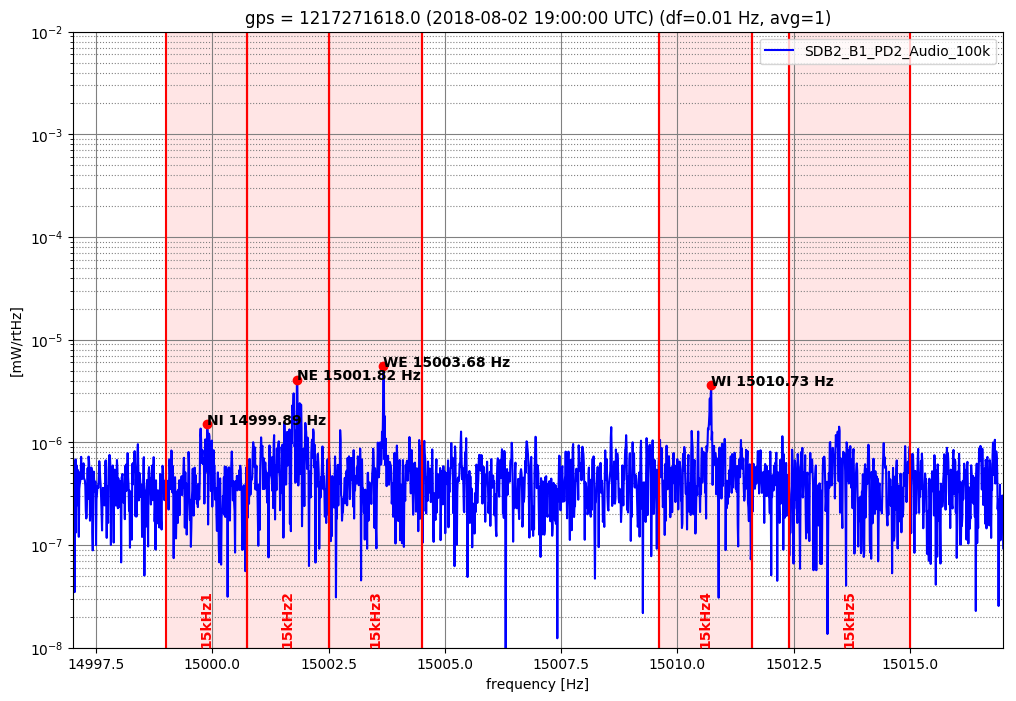
[Modes around 15.007kHz (time series plot, temperature vs line frequency plot, B1 spectrum)]
PAY_15kHz1_FREQ: NI? 1.584 Hz/K?
PAY_15kHz2_FREQ: NE? 1.109 Hz/K?
PAY_15kHz3_FREQ: WE 1.720 Hz/K
PAY_15kHz4_FREQ: WI? 1.357 Hz/K?
PAY_15kHz5_FREQ: unclear
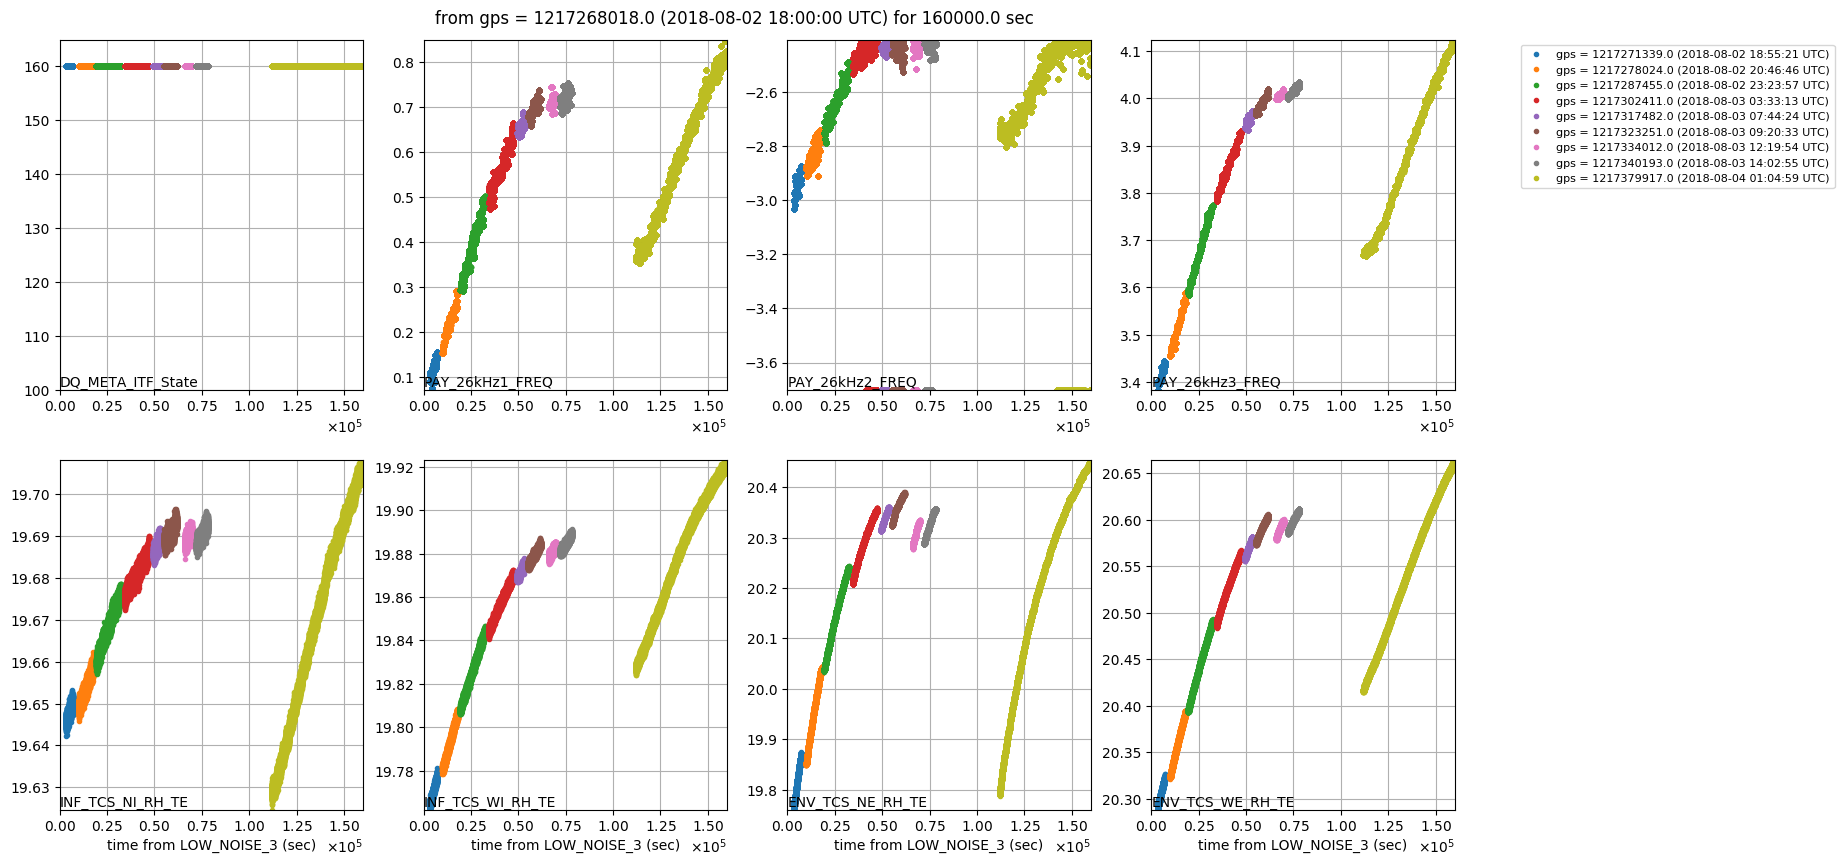
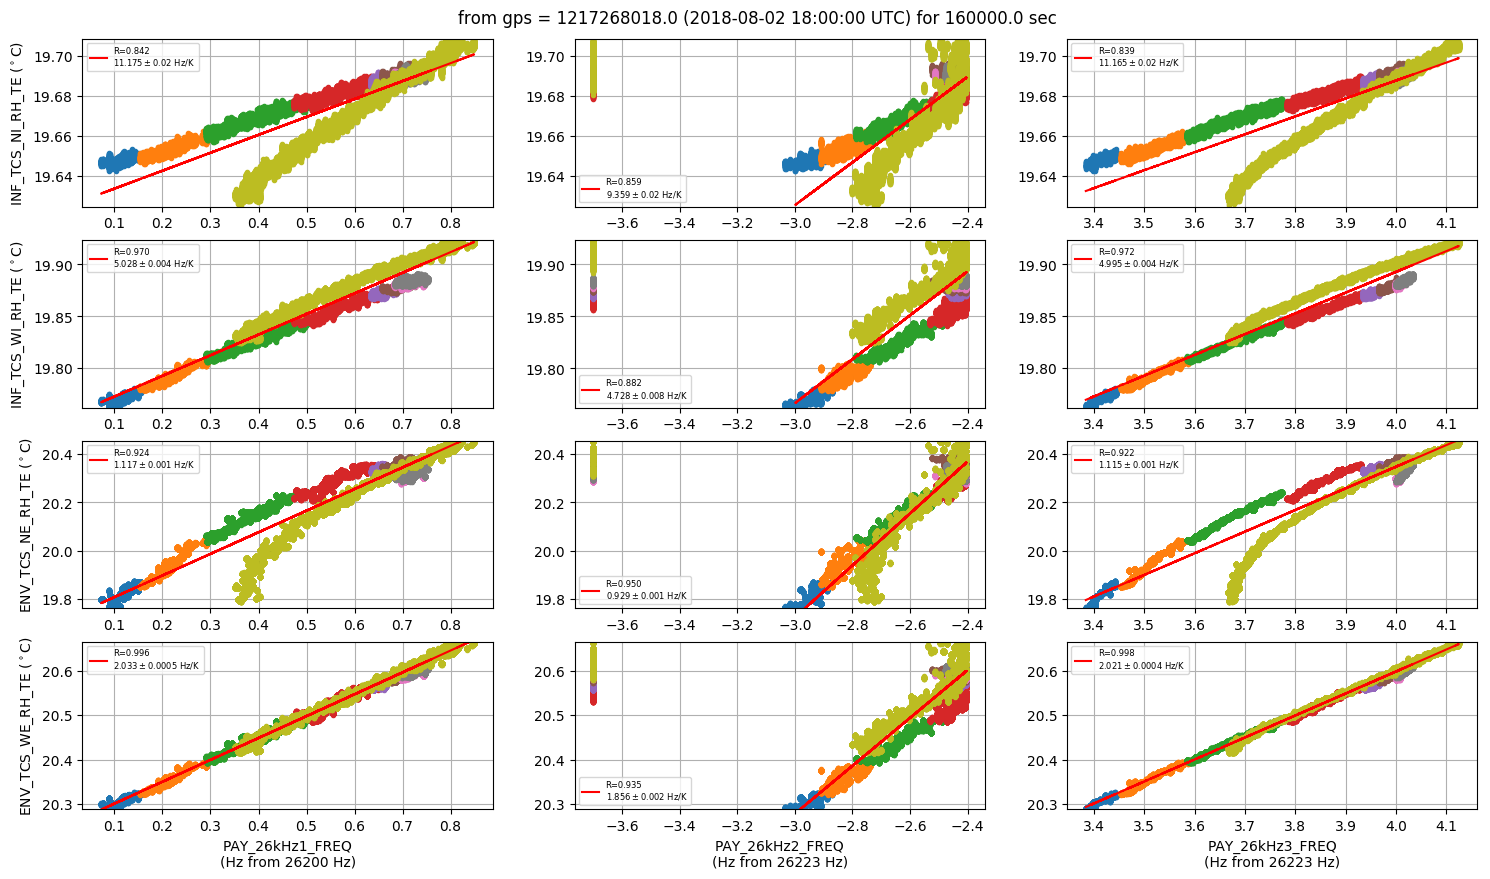
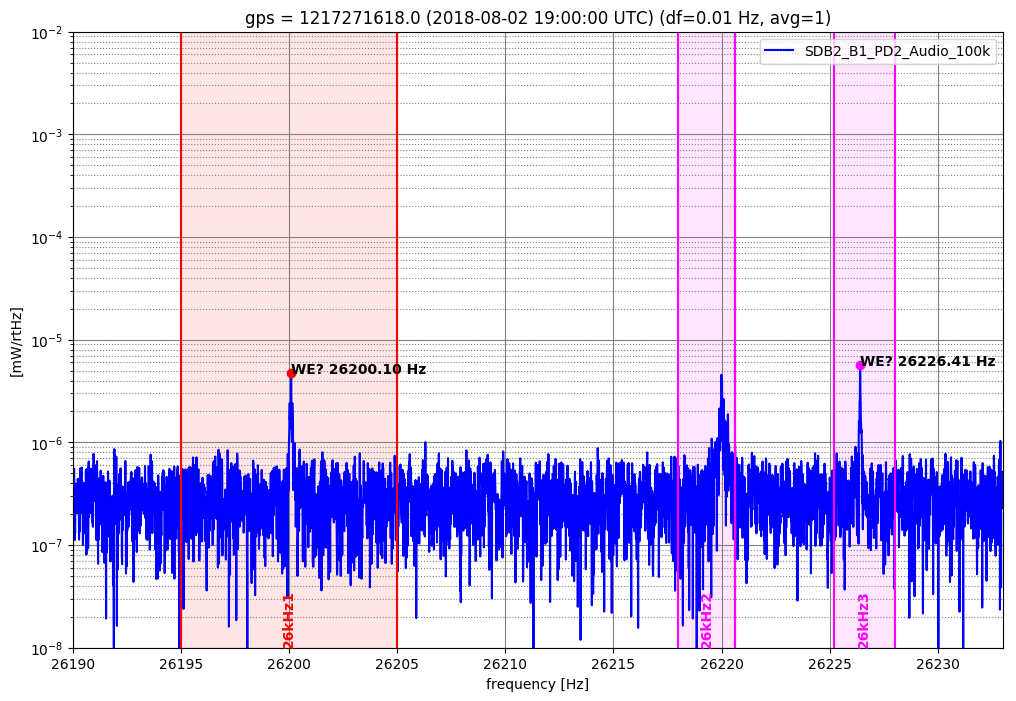
[Modes around 26.2kHz (time series plot, temperature vs line frequency plot, B1 spectrum)]
PAY_26kHz1_FREQ: WE? 2.033 Hz/K
PAY_26kHz2_FREQ: unclear
PAY_26kHz3_FREQ: WE? 2.021 Hz/K
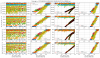
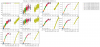
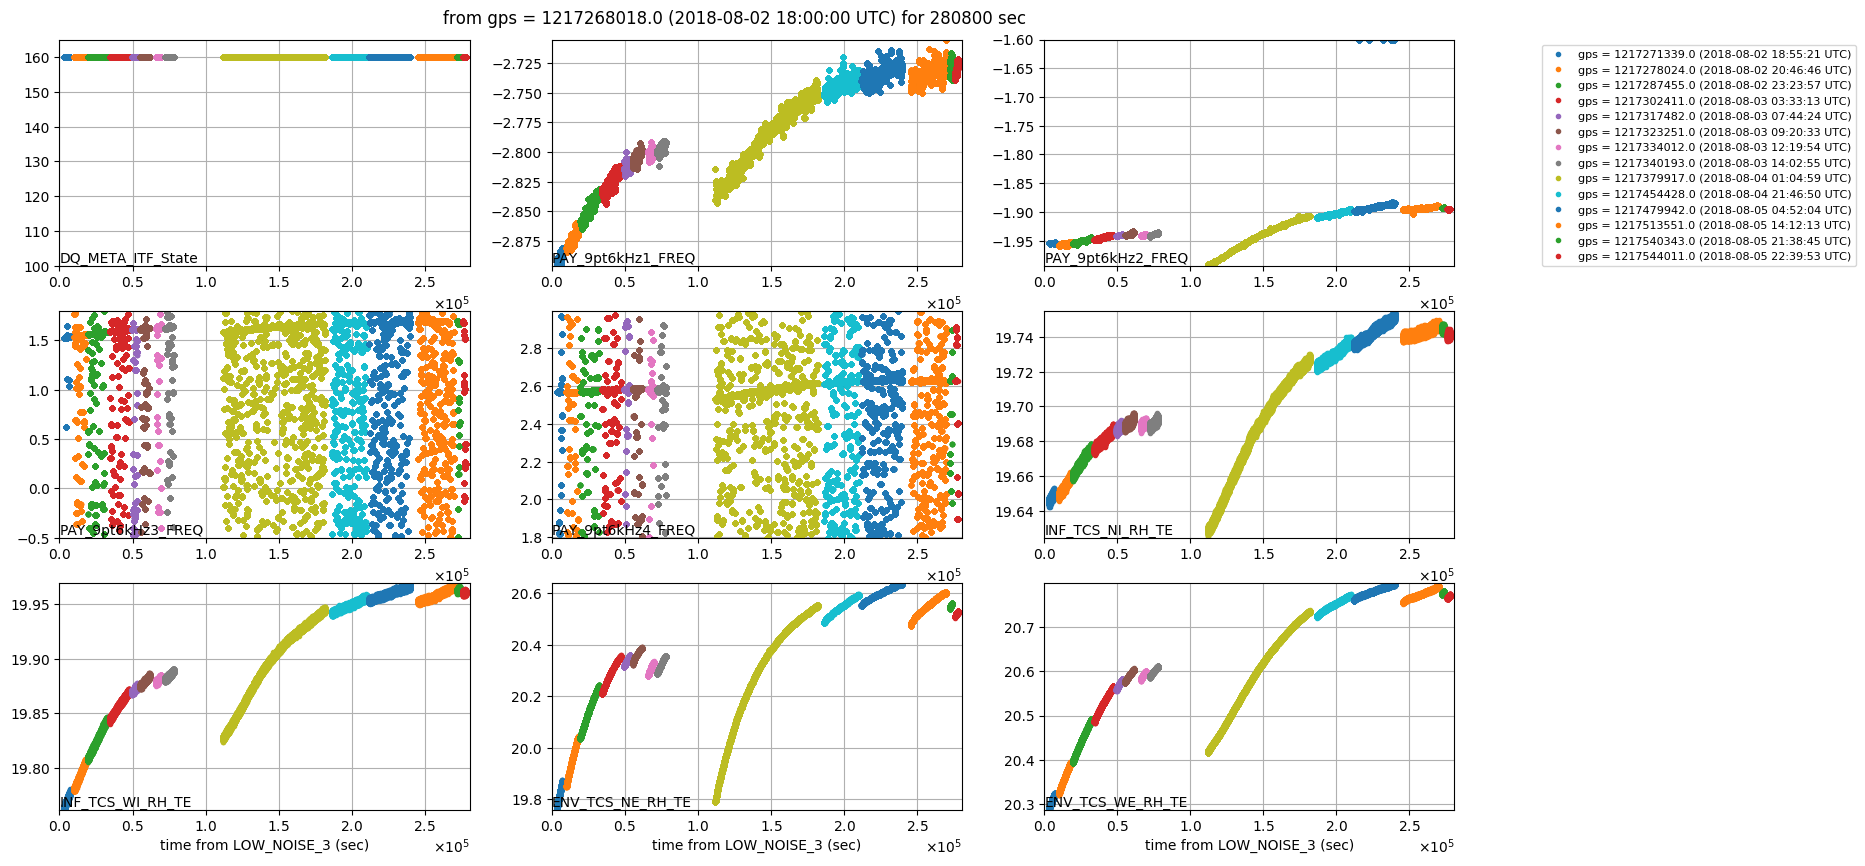
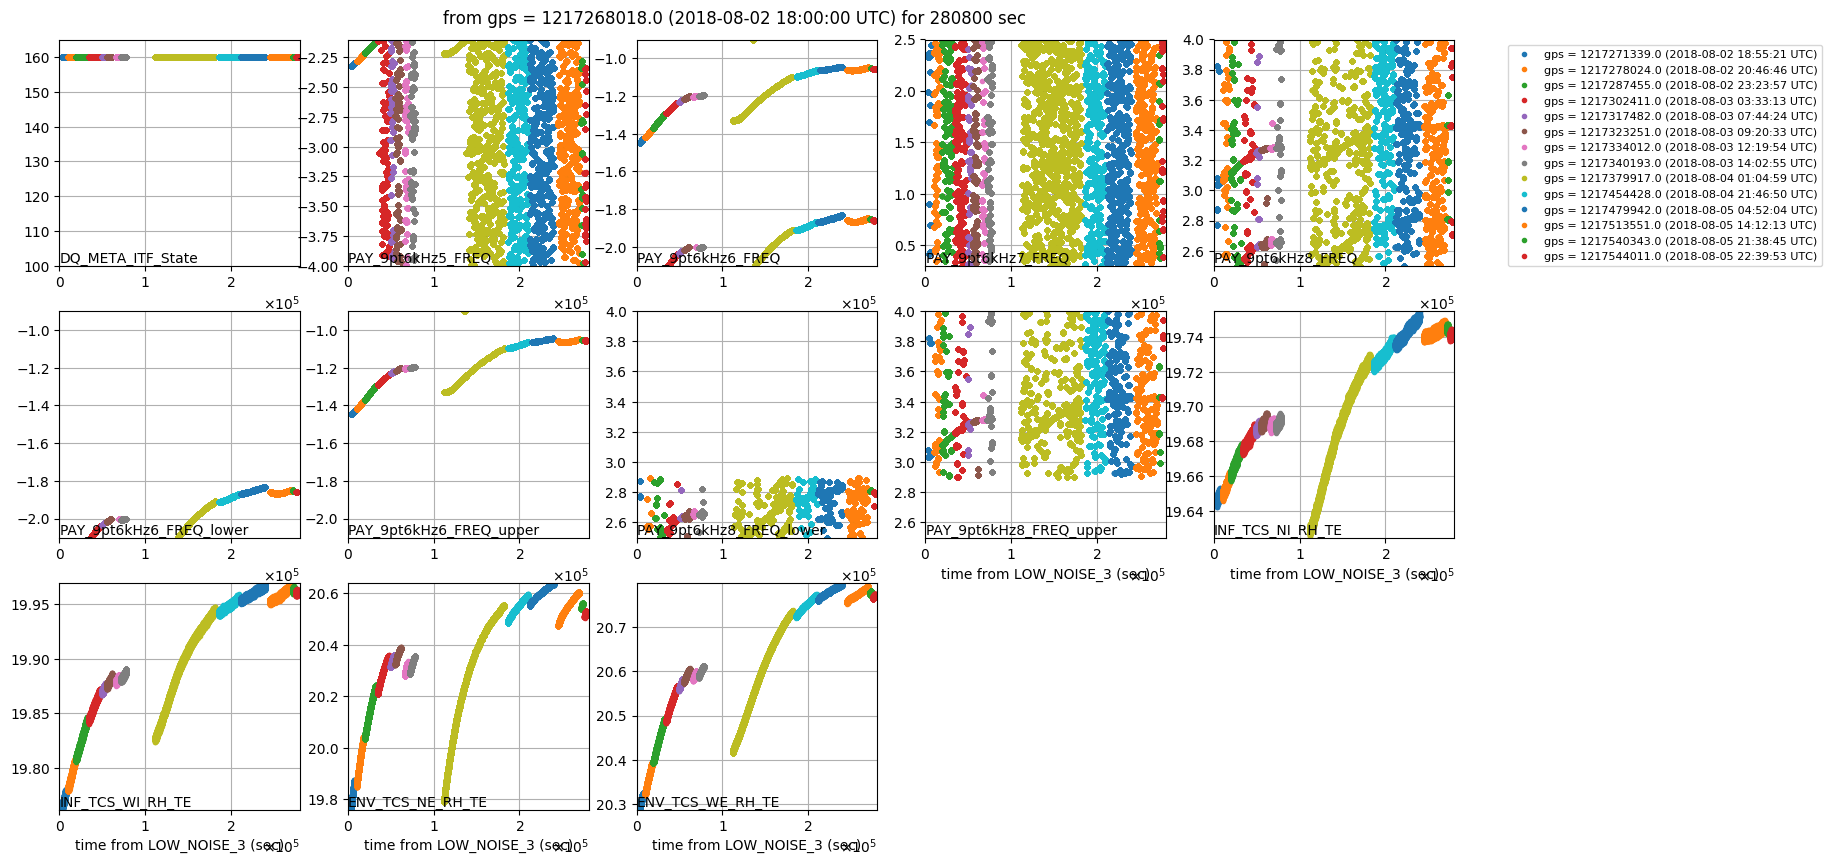
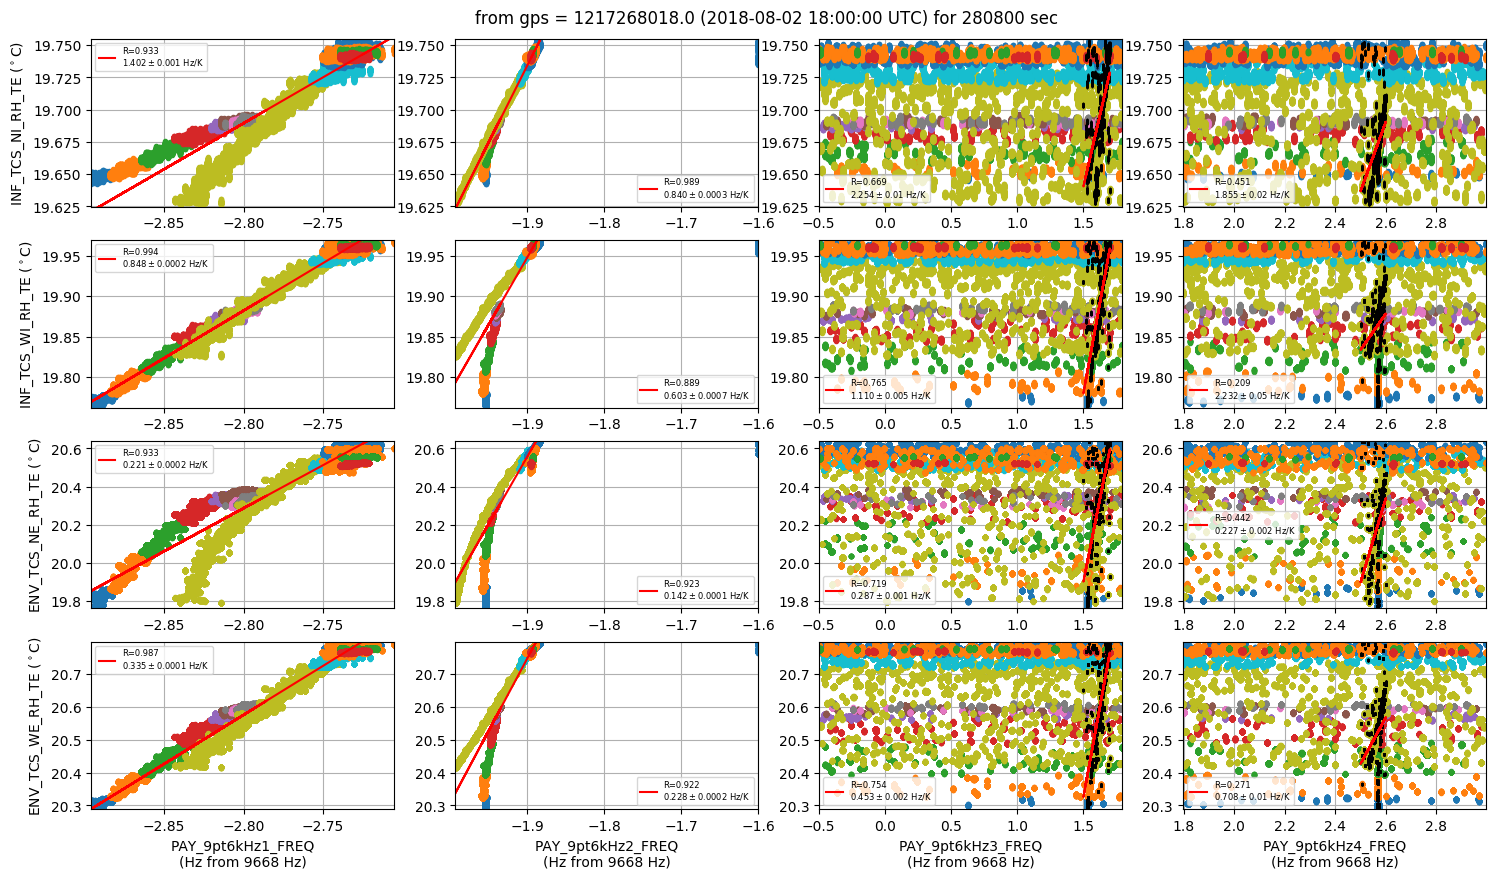
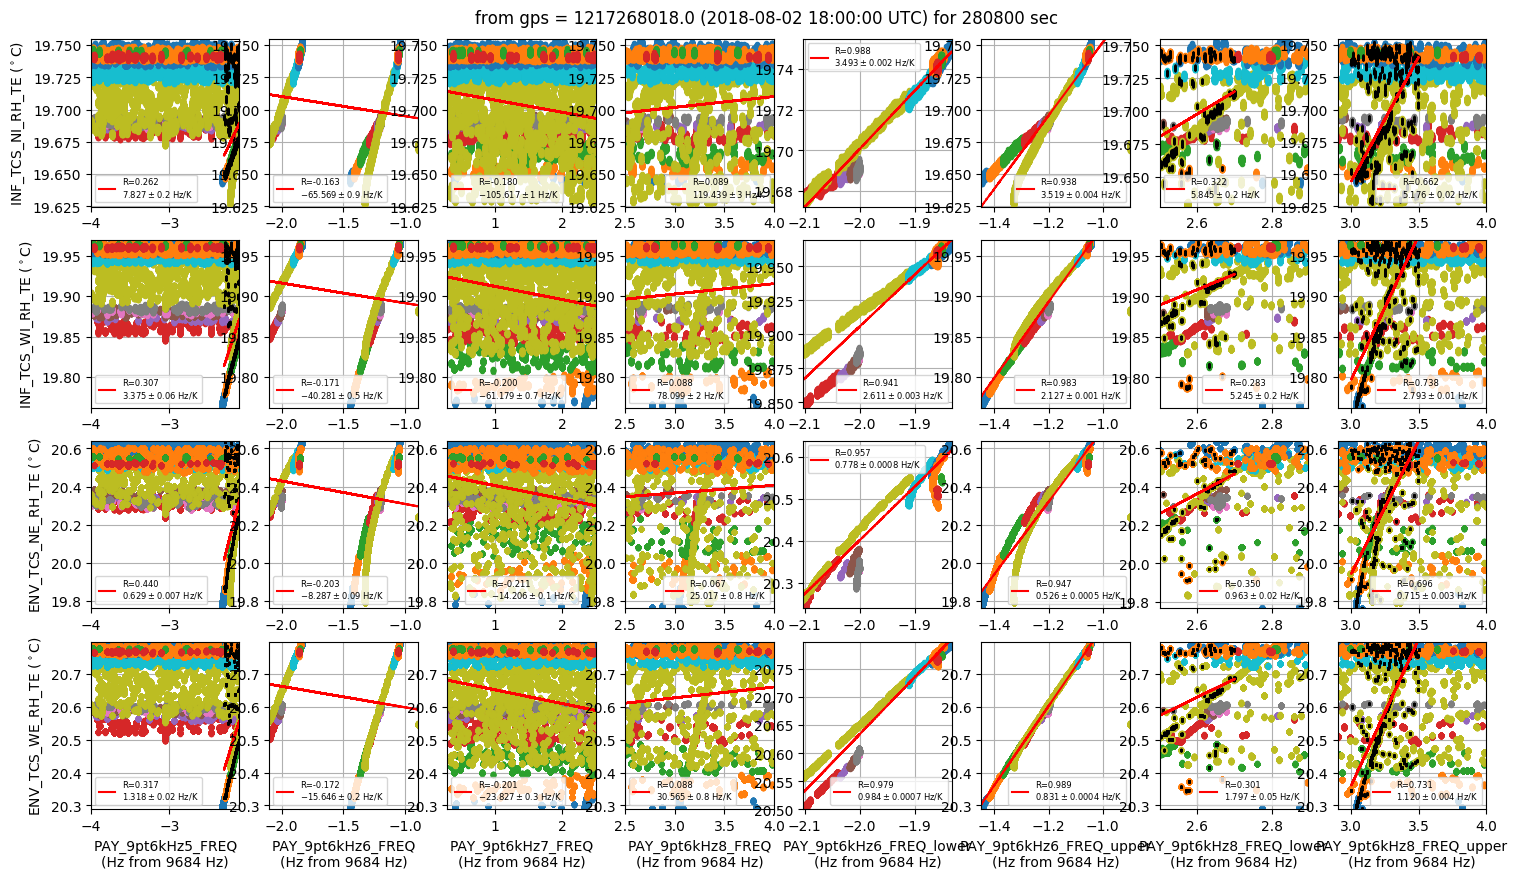
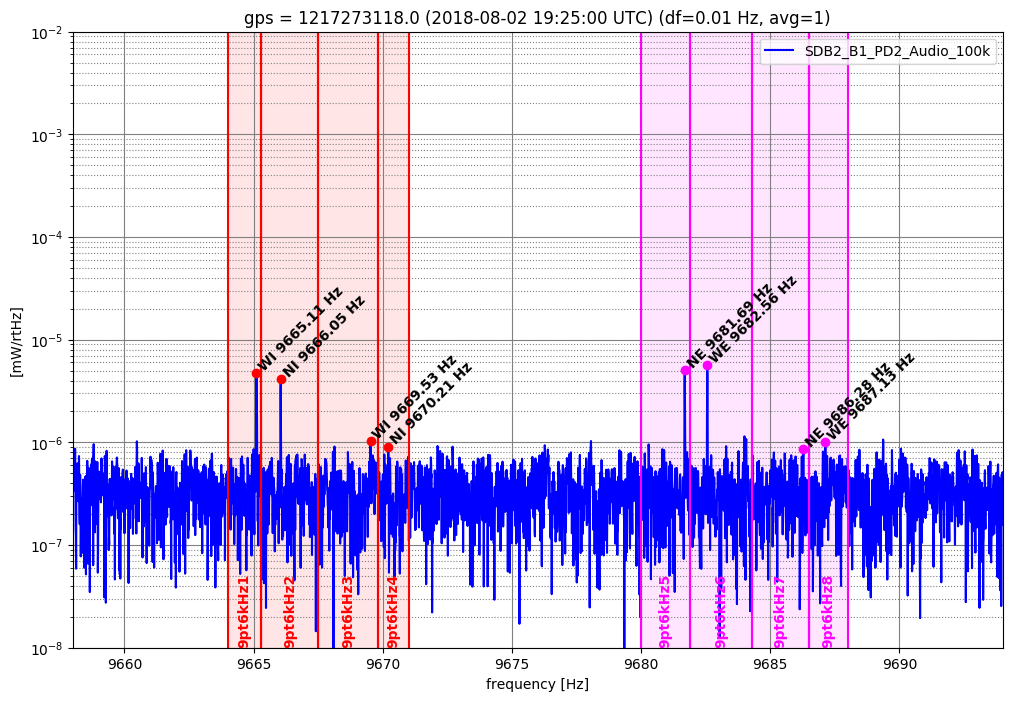
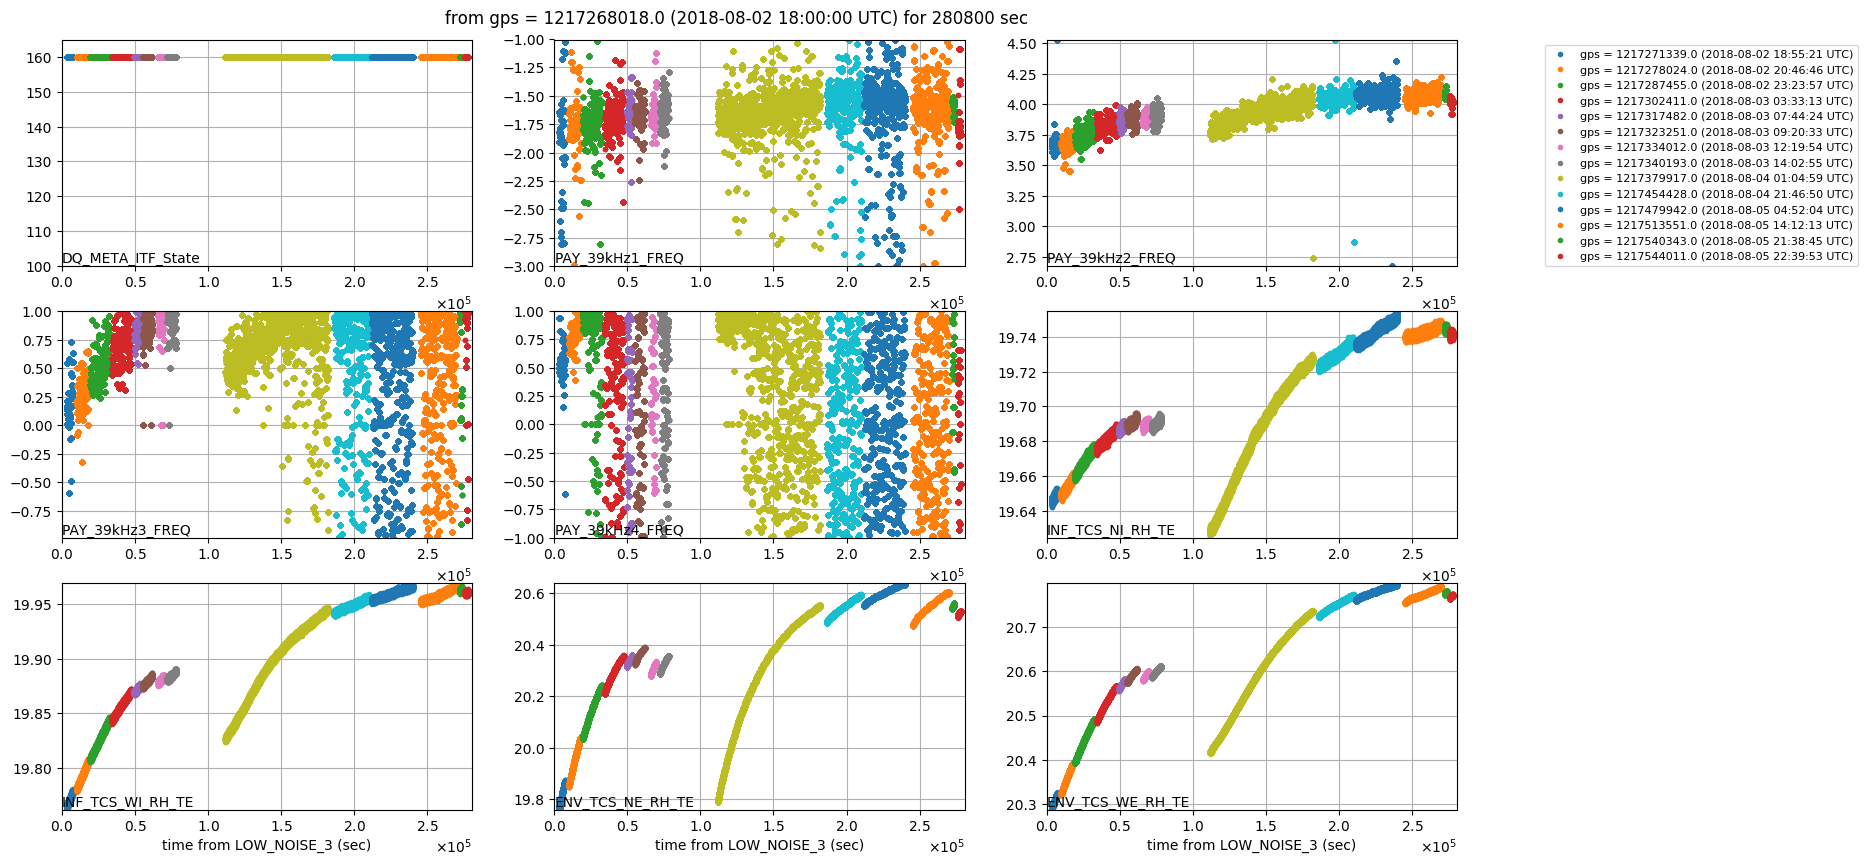
[Modes around 9.67-8kHz (time series plot 1-4 5-8, temperature vs line frequency plot 1-4 5-8, B1 spectrum)]
PAY_9pt6kHz1_FREQ: WI 0.849 Hz/K
PAY_9pt6kHz2_FREQ: NI 0.840 Hz/K
PAY_9pt6kHz3_FREQ: WI (noisy)
PAY_9pt6kHz4_FREQ: NI (noisy)
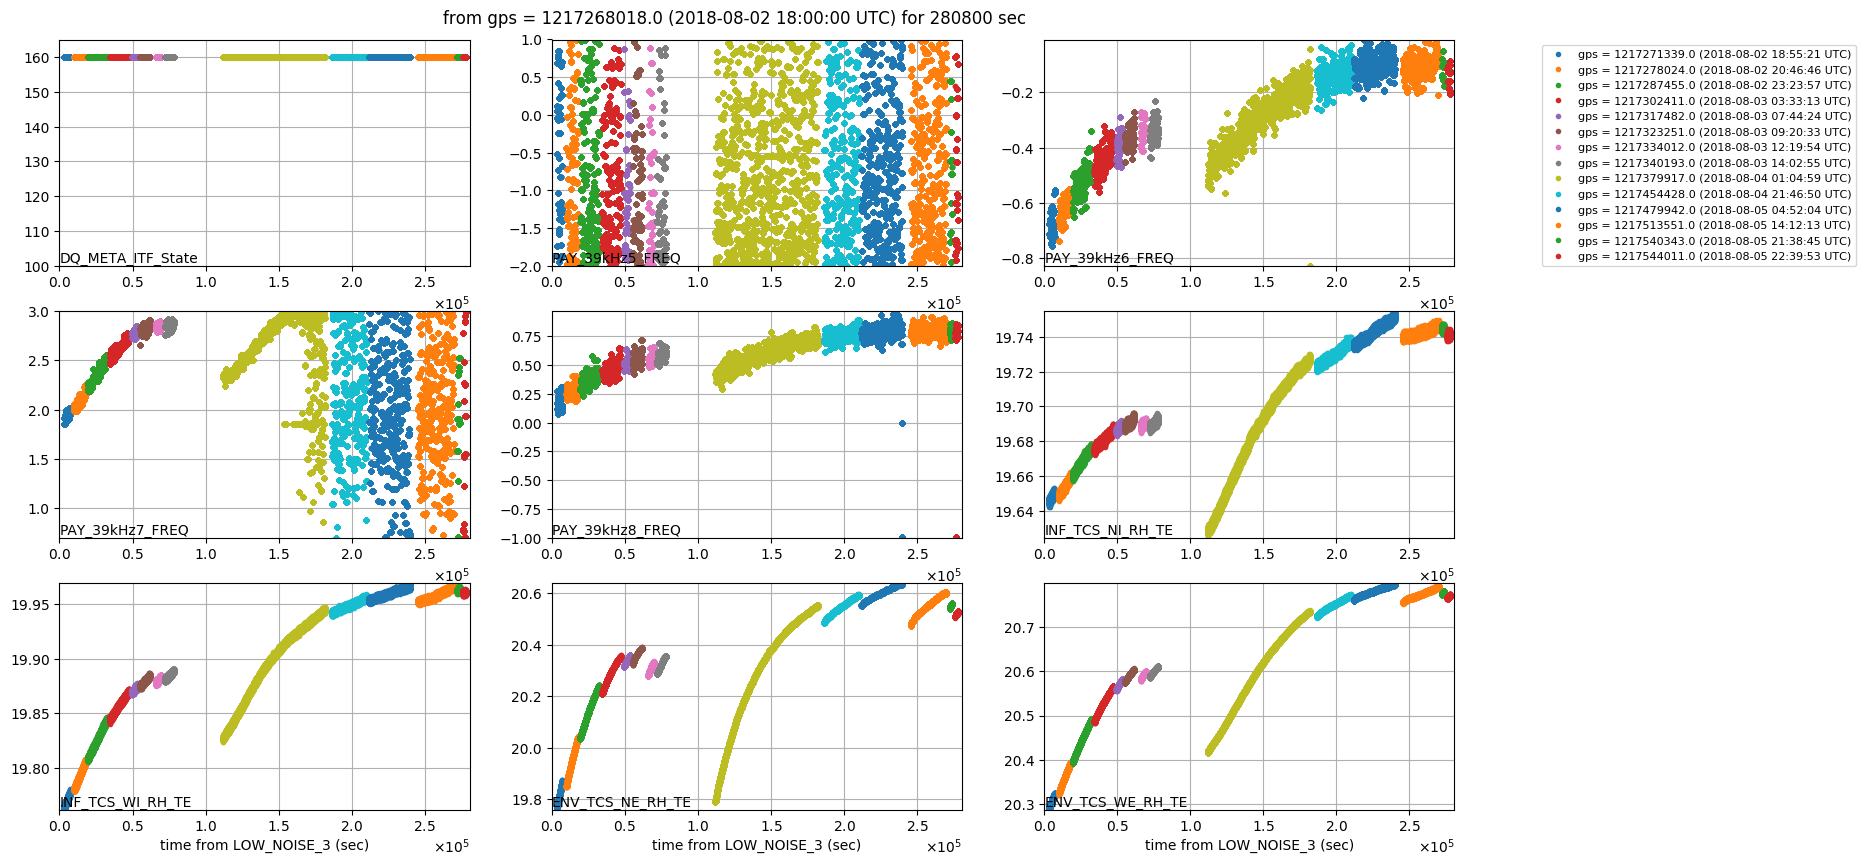
PAY_9pt6kHz5_FREQ: NE 0.629 Hz/K? (line moves to 9pt6kHz6)
PAY_9pt6kHz6_FREQ: lower frequency from NE 0.778 Hz/K?, upper frequency from WE 0.831 Hz/K
PAY_9pt6kHz7_FREQ: NE, but basically no line in the band (line moves to 9pt6kHz8)
PAY_9pt6kHz8_FREQ: lower frequency from NE, upper frequency from WE (noisy)
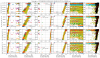
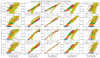
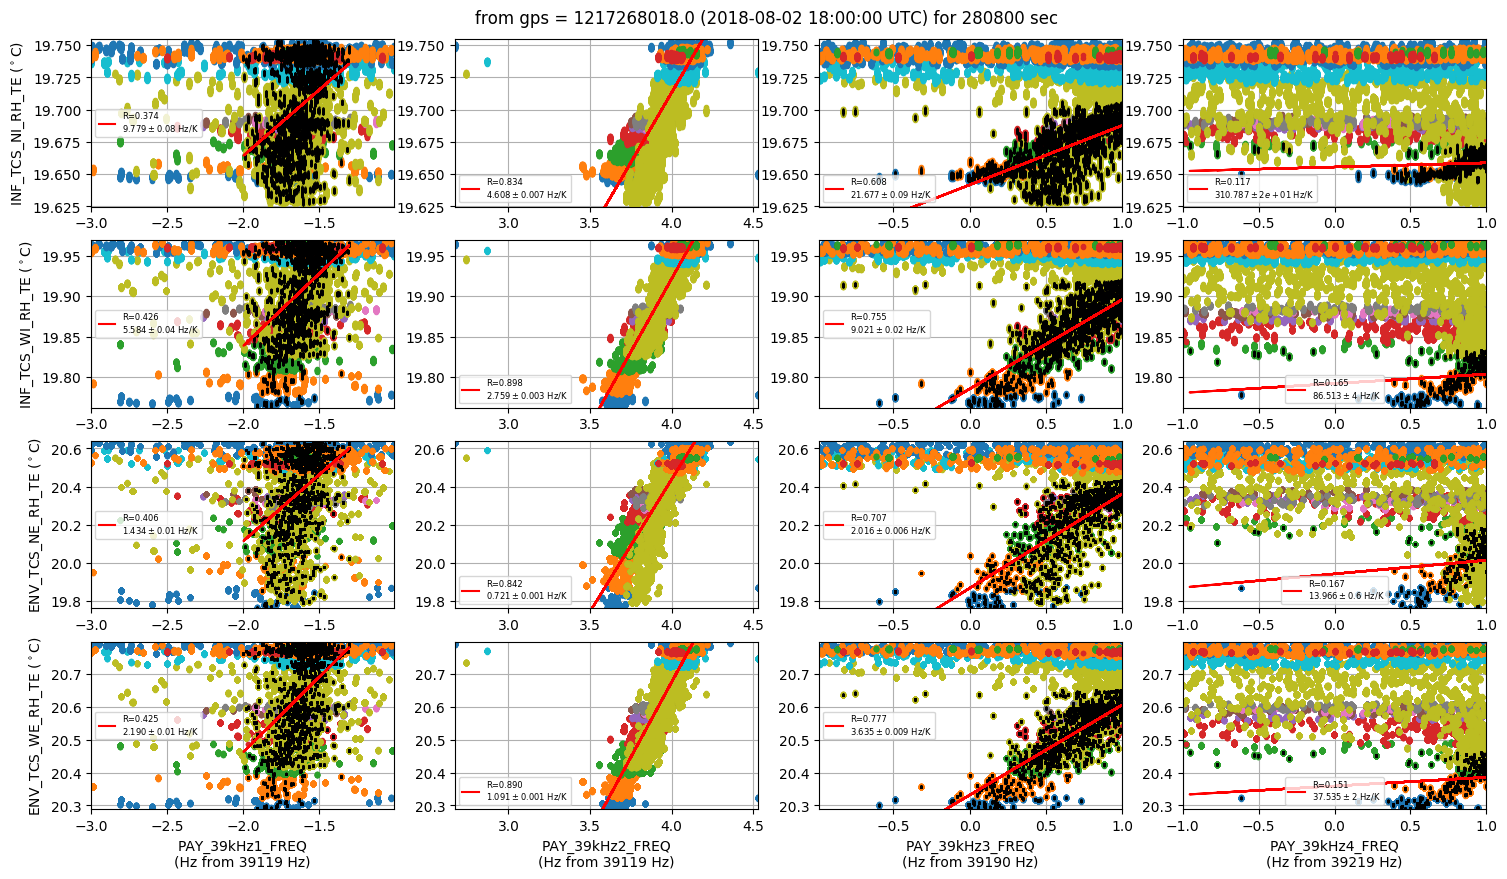
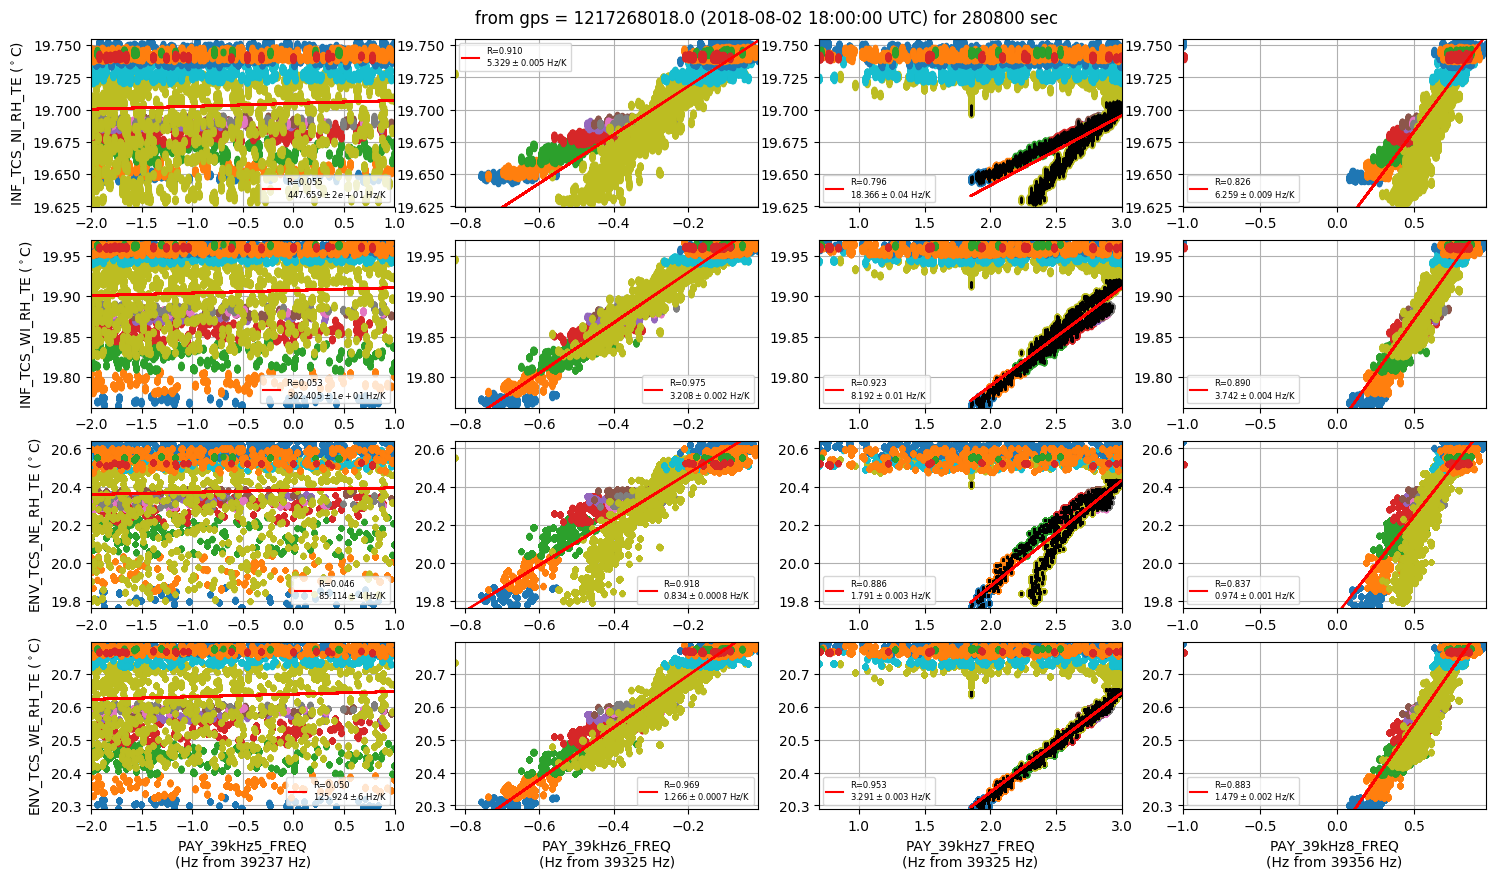
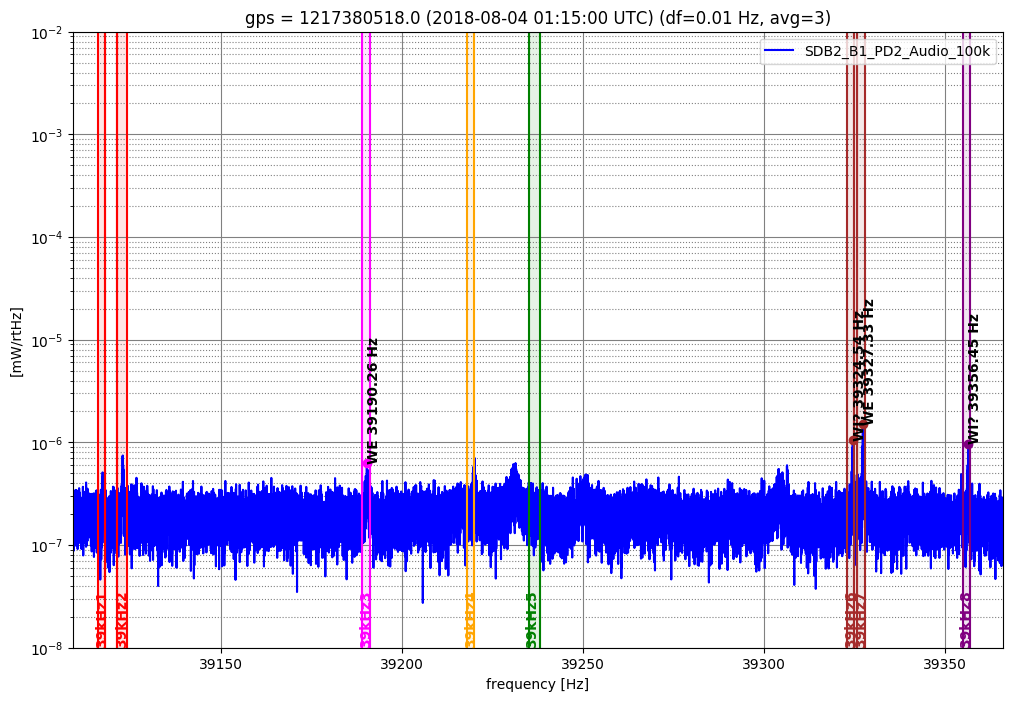
[Modes around 39.2-3kHz (time series plot 1-4 5-8, temperature vs line frequency plot 1-4 5-8, B1 spectrum)]
PAY_39kHz1_FREQ: unclear
PAY_39kHz2_FREQ: unclear
PAY_39kHz3_FREQ: WE 3.635 Hz/K?
PAY_39kHz4_FREQ: unclear
PAY_39kHz5_FREQ: currently no line in the band
PAY_39kHz6_FREQ: WI 3.208 Hz/K
PAY_39kHz7_FREQ: WE 3.291 Hz/K
PAY_39kHz8_FREQ: WI? 3.742 Hz/K
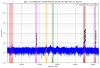
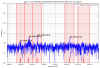
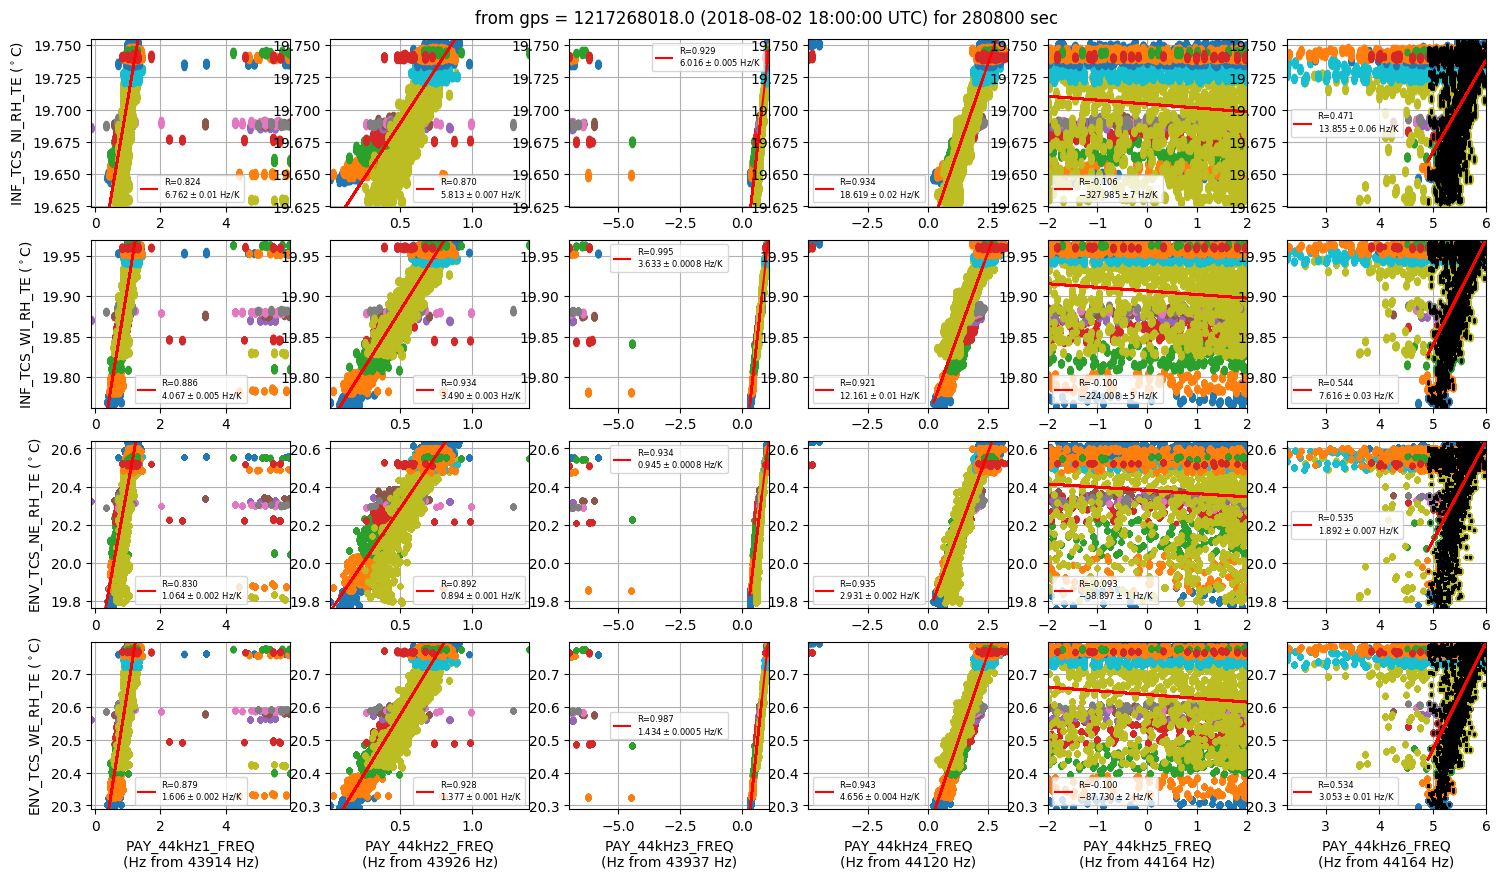
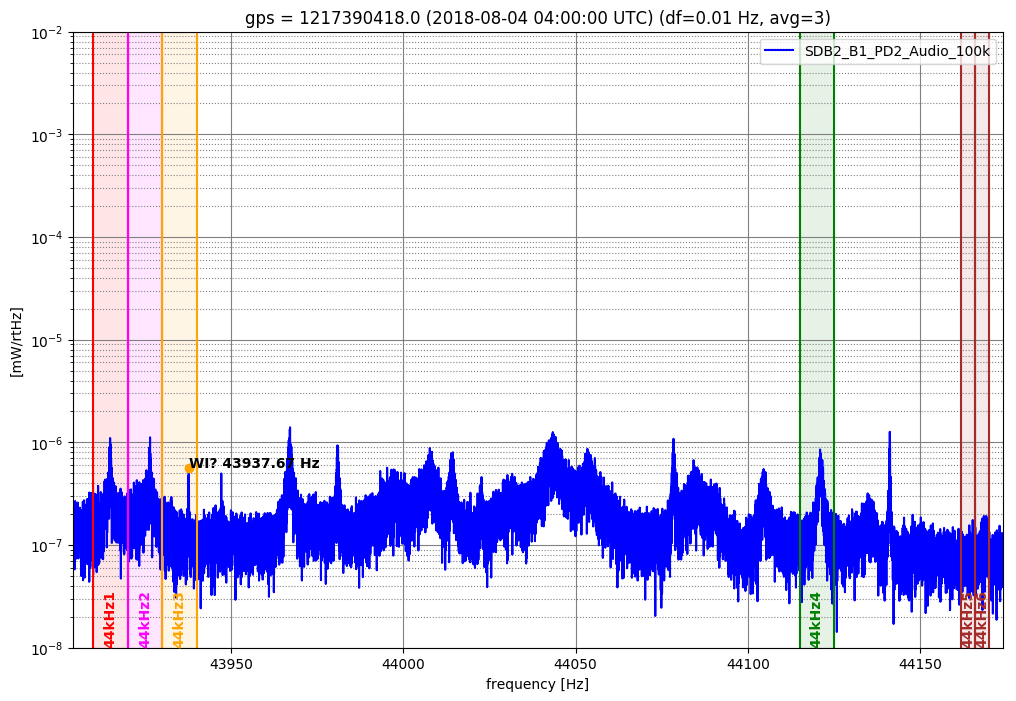
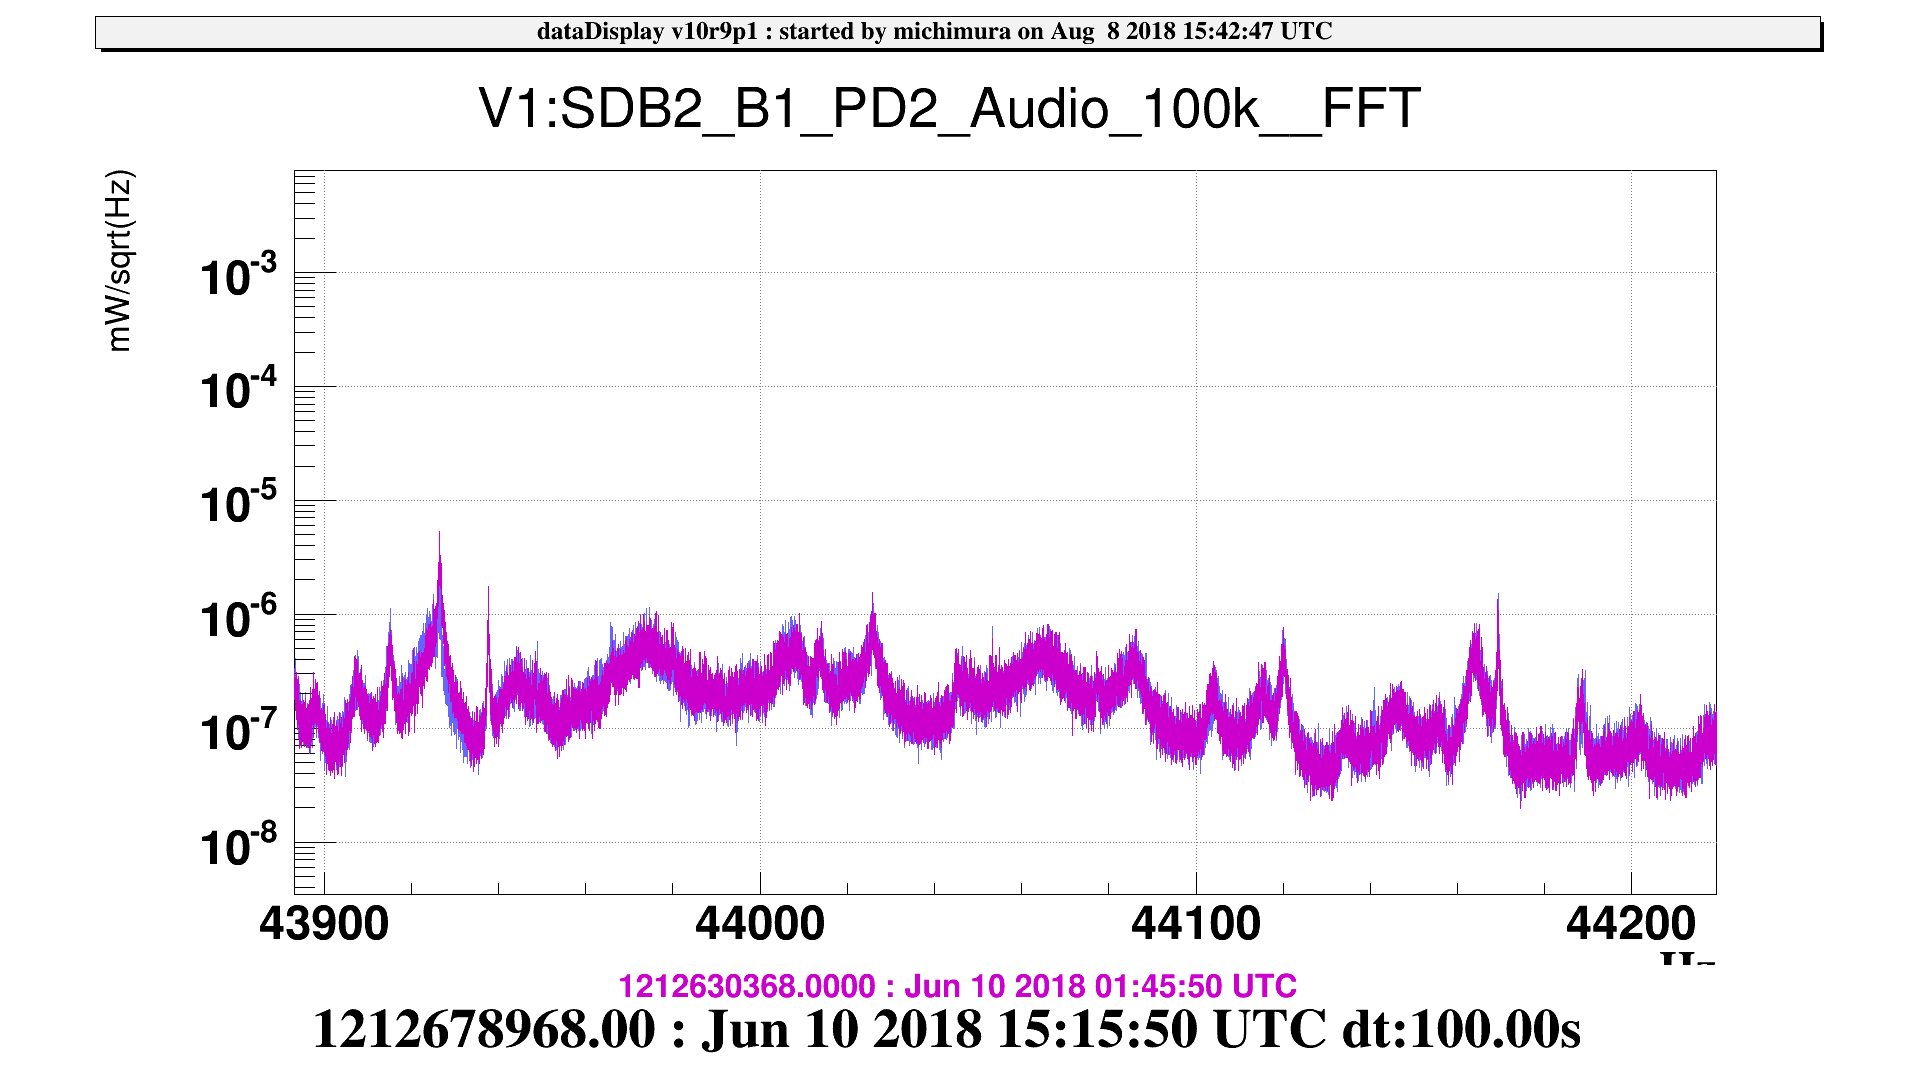
[Modes around 43.9-44.1kHz (time series plot, temperature vs line frequency plot, B1 spectrum)]
PAY_44kHz1_FREQ: unclear
PAY_44kHz2_FREQ: unclear
PAY_44kHz3_FREQ: WI? 3.633 Hz/K?
PAY_44kHz4_FREQ: unclear
PAY_44kHz5_FREQ: currently no line in the band
PAY_44kHz6_FREQ: unclear
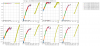
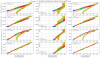
Dots in different colors indicate data from different locks.
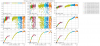
Method:
I did a similar analysis done a year ago by Bas (logbook #39039), using 4 days of data during the commissioning run in Aug 2-5. Data in LOW_NOISE_3 is used.
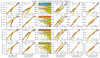
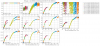
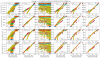
1. Make temperature vs line frequency plots using ring heater temperatures (INF_TCS_NI_RH_TE, INF_TCS_WI_RH_TE, ENV_TCS_NE_RH_TE, ENV_TCS_WE_RH_TE) and line tracker frequency outputs (PAY_{mode}_FREQ).
2. Calculated correlation coefficients and linear fitted to get the temperature dependence. Used these information to identify the mirror.
3. For line tracker frequency output channels tracking two modes, I splitted the data into two using moving average using the time window of 3000 seconds. Lower frequency output is labeled with the suffix _lower, and upper frequency output is labeled with the suffix _upper.
Result:
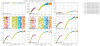
[Drum modes around 7.807kHz]
From correlation coefficients, we can clearly see that DRUM1 is from NI and DRUM2 is from WI.
DRUM3 is now tracking nothing, and DRUM4 is tracking two modes. Lower frequency of DRUM4 can be identified to be WE from the correlation coefficient.
Upper frequency of DRUM4 is therefore NE.
These results are consistent with previous studies (logbook #41935, #41794 (this figure) and VIR-0505A-18).
The temperature dependance of drum mode frequencies is ~0.88 Hz/K, which is consistent with previous studies (logbook #39039, #41798).
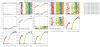
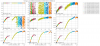
[Modes around 10.107kHz]
Modes can be identified similarly with drum modes.
These results are consistent with previous studies (logbook #41794 (this figure) and VIR-0505A-18).
The temperature dependance of mode frequencies is ~1.07 Hz/K.
[Modes around 15.007kHz]
For these modes, some of the lines moved from one channel to different channel, so I only used the first half (~ 2 days) of the data.
15kHz3 can be clearly identified to be WE and is consistent with logbook #41794 (this figure).
Others are quite unclear, but considering the combination of high correlation coefficients and temperature dependance close to 1.7 Hz/K obtained from WE, 15kHz1, 15kHz2 and 15kHz4 are likely to be from NI, NE and WI respectively.
[Modes around 26.2kHz]
For these modes, the line at 26kHz2 moved out from the frequency region, so I only used the first half (~ 2 days) of the data.
Both 26kHz1 and 26kHz3 has high correlation with WE temperature, as already found in logbook #41794 (this figure).
They might not be from mirror modes, but something from WE.
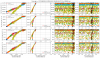
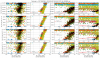
[Modes around 9.6kHz]
These modes are tricky (they were also quiet during the weekend).
From study in logbook #41794 (this figure), we can see that 9pt6kHz6 and 9pt6kHz8 are from WE. There are 4 groups but they do not correspond to 4 mirrors and groups are mixed.
From correlation coefficients, we can clearly see that 9pt6kHz1 is from WI and 9pt6kHz2 is from NI.
Therefore, we can guess that 9pt6kHz3 and 9pt6kHz4 are also from WI and NI, respectively, although these channels are noisy due to small amplitude during the weekend. For fitting the data of these channels, I only used the data which has not too large fluctuation from the trend we can see by our eye (data used is indicated with black dots).
The rest is 9pt6kHz5 and 9pt6kHz7 and they are from NE. 9pt6kHz7 is currently out of band and NE mode is actually tracked by 9pt6kHz8. Also, NE line in 9pt6kHz5 moved to 9pt6kHz6 during the weekend.
We can also confirm that all the temperature dependances of mode frequencies are ~0.84 Hz/K.
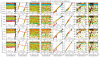
[Modes around 39.2-3kHz]
These modes were quiet and unclear.
From study in logbook #41794 (this figure and this figure), we can see that 39kHz3 and 39kHz7 are from WE, and correlation coefficients support this.
We can also see that 39kHz6 and 39kHz8 have high coherence with WI temperature and similar temperature dependance (~3.2-3.7 Hz/K).
For 39kHz1, it was noisy and unclear.
For 29kHz2, correlation coefficients are similar for each mirror and unclear.
For 39kHz4, the line moved away from the band and we don't have much data.
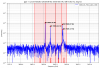
If you look at the B1 spectrum, we see peak at 39306 Hz, which is not tracked by the line tracker. No line in 39kHz5 band.
We might have to check these modes and line tracker bands again when these modes are excited.
[Modes around 43.9-44.1kHz]
For these modes, no plot is in logbook #41794. So, I made one here.
As you can see, no peaks in this line tracker frequency band moved during large temperature change in WE in June 10.
44kHz3 has high correlation with WI temperature, so it might be from WI, but others are unclear.
May be we should look into these modes again.

