Reports 1-1 of 1 Clear search Modify search
Injection system (General activities)
lagabbe, spinicelli, ruggi - 18:37 Monday 01 June 2026 (69150) Print this report
Measurement of the sensing matrix of BPL

To measure the sensing and driving matrix of BPL, a sinusoidal signal at 2 Hz, with 0.2 V amplitude was injected on channels:

  • PZT_EIB_M1BH_CORR
  • PZT_EIB_M1BV_CORR
  • PZT_LB_M14H_CORR
  • PZT_LB_M14V_CORR

Directly on the piezo correction signal. The BPL loop was open while injecting noise.

The signals were injected respectively at GPS times [1464363022, 1464363121, 1464363296, 1464363397] , each injection lasted for 60 s.

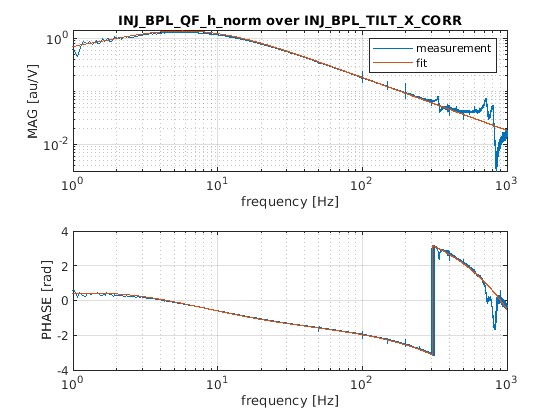
The channels QF_h_norm, QF_v_norm, QN_h_norm and QN_v_norm were monitored to see the effect of each piezo on each quadrant.

Piernicola's matlab script "Sensing_matrix_BPL.m" was used to compute the matrices:


sensing_matrix =

   -0.6230   -0.0278    0.0033    0.0012
    0.0233   -0.3838    0.0010   -0.0059
   -0.5035    0.0063    0.4332    0.0151
    0.0154    0.3421    0.0166    0.2886


driving_matrix =

   -1.6099   -0.1078   -1.8808    0.3216
    0.1242   -2.6459    0.0738    3.1261
    0.0118    0.0090    2.3271   -0.1449
    0.0085   -0.0545   -0.1126    3.5359

However, the loop does not close. We tried to adjust the setpoint of the piezo (TILT/SHIFT_X/Y_CORR_SET) so as the norm signal of the QPDs come close to 0, and tried several values of the DRIFT_FILTER gain but we did not succeed.

Paolo got a similar driving matrix, the values of the set point has to be studied more deeply.


Comments to this report:
lagabbe, melo, derossi, spinicelli, ruggi, pinto - 17:40 Wednesday 03 June 2026 (69157) Print this report

The sensing and driving matrices measured in the precedent post 69150 were wrong, due to an error on the threshold on the phase that separates the positive from the negative responses between the piezo and the quadrants. The new matrices were computed:
sensing_matrix =
   -0.6230   -0.0278    0.0033    0.0012
    0.0233   -0.3838   -0.0010   -0.0059
   -0.5035   -0.0063   -0.4332   -0.0151
    0.0154    0.3421    0.0166   -0.2886

driving_matrix =
   -1.5909   -0.1001    1.8540   -0.0972
    0.1081   -2.5520    0.0166   -3.0190
   -0.0128    0.0071   -2.2893   -0.1237
   -0.0080    0.0517    0.1270   -3.3971
 
Using the new driving matrix, we managed to lock the BPL loop in drift control (f < 5 Hz). And then in broadband.
When the BPL is locked in broadband, a 122 Hz signal appeard on the QPD signal spectrums.
 69157_1780499525_BPL.png
 
In order to measure the open loop transfer function, the BPL loop was open and a colored noise signal with a 0.001 V amplitude was injected on the channels:

  • TILT_X_CORR 13:42:00 UTC
  • TILT_Y_CORR 13:45:30 UTC
  • SHIFT_X_CORR 13:48:40 UTC
  • SHIFT_Y_CORR 13:52:00 UTC

To see the transfer function at low frequency, a 0.03 V signal at frequency < 20 Hz was injected on the same channels at the times:

  • TILT_X_CORR 14:27:00 UTC
  • TILT_Y_CORR 14:30:00 UTC
  • SHIFT_X_CORR 14:32:30 UTC
  • SHIFT_Y_CORR 14:36:00 UTC

 The shape of the open loop transfer functions from the CORR signal to the corresponding of the quadrant signals are similar. The following plot is a  transfer function from TILT_X_CORR signal to QF_h_norm during a low frequency injection:
69157_1780501191_BPL_TILT_plant.jpg
 
The 122 Hz noise was due to a saturation of the control loop, so the loop filter was changed. The QPDs signal spectrums in closed loop, with the old and with the new filter are shown in the following plot:
 69157_1780500318_BPL_CL.png
The 122 Hz signal disapeared.

Images attached to this comment
Search Help
×

Warning

Error

The present report has been modified outside this window. Please check for its integrity in the main page.

Refreshing this page will move this report into drafts.

×